


Written by:

Reviewed by:

- February 19, 2026
- 19 min read
Moving Average: A Comprehensive Guide for Traders
The ultimate guide to moving averages in trading, how SMAs and EMAs work, and how traders use different MAs to identify trends.
What is a Moving Average (MA)?
A moving average is a technical indicator that shows the average price of an asset over a set period of time, plotted as a line on the chart.
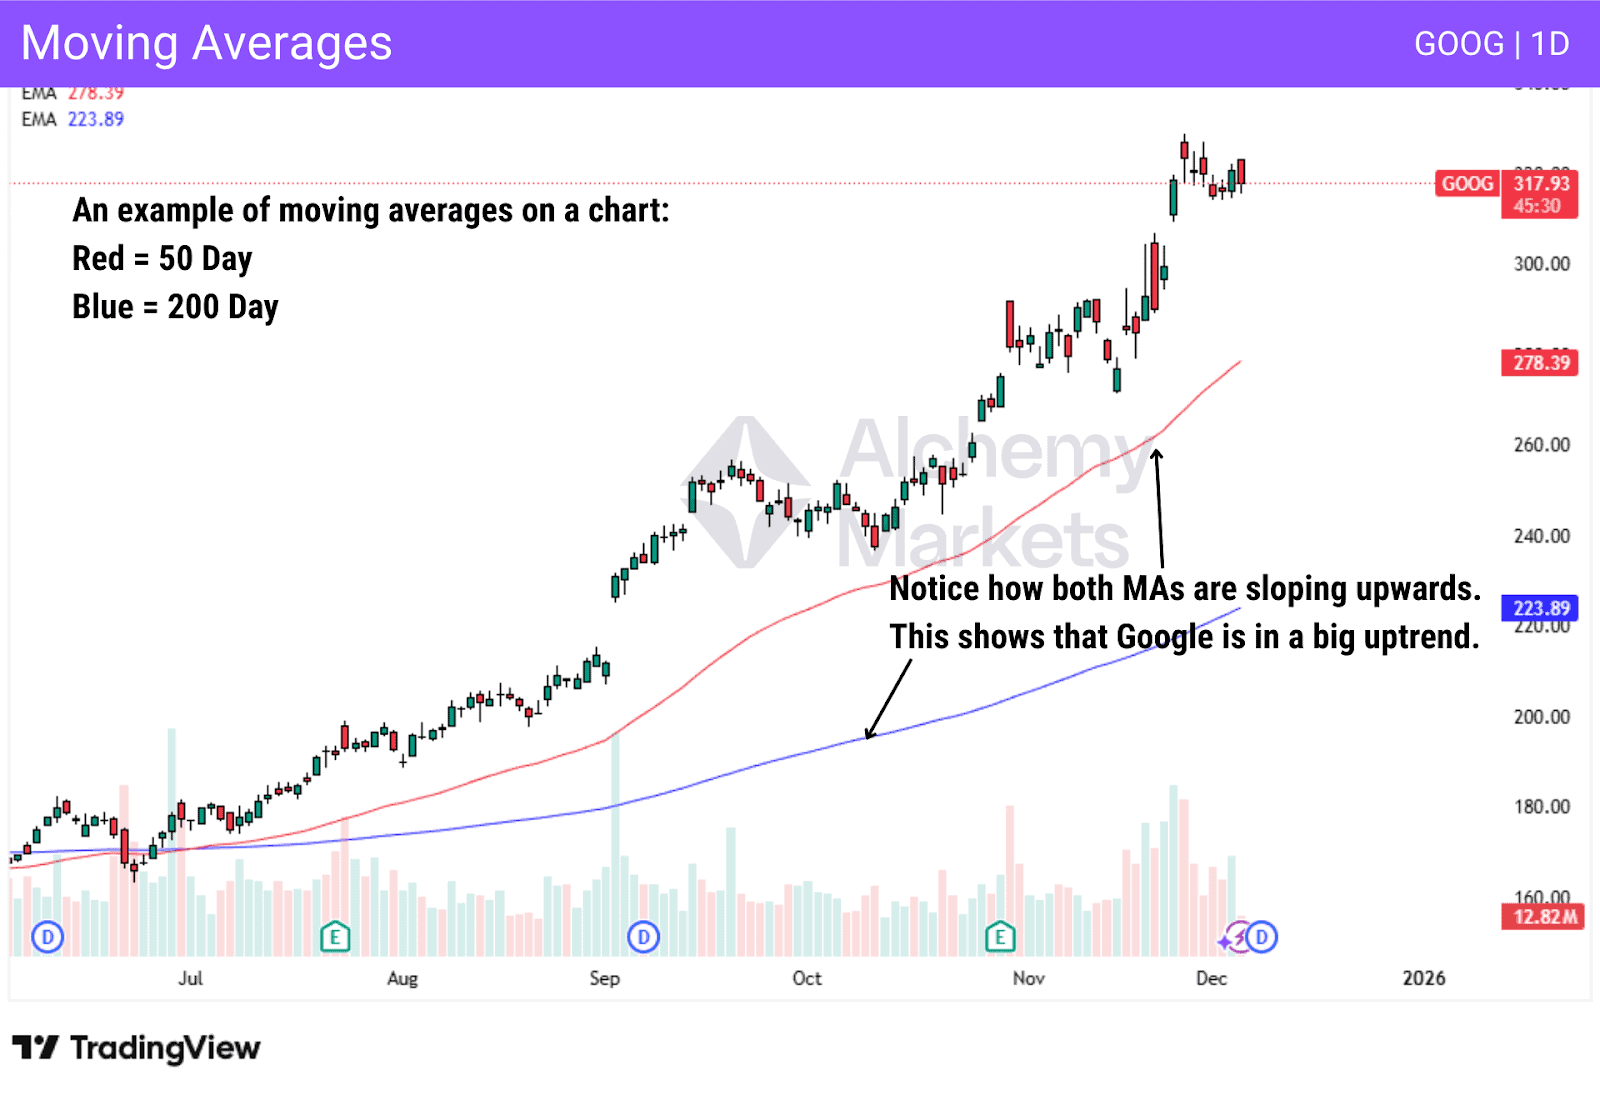
Moving averages (MA) are extremely useful, as it provides a support and resistance area to trade from, but also tells traders which direction an asset is moving in. When it’s sloping up, the market is generally in a bullish uptrend. When it slopes down, the market is in a bearish downtrend.
Moving averages are one of those indicators that are beloved by beginners and veteran traders alike, because it is so simple to use, and flexible enough to be applied into almost any strategy.
They smooth out market noise and make the underlying direction clearer. So, instead of reacting to every small price move, traders use moving averages to stay focused on the bigger picture.
What does a Moving Average Indicate?
A moving average uses simple statistical calculations to track how price changes over time, plotting an average price as a line on the chart. Traders can adjust the lookback period to suit their timeframe, which makes it useful for both short-term and longer-term trend analysis.
When the moving average is sloping upward, price is generally trending higher. When it slopes downward, the market is leaning bearish. If the line flattens out and moves sideways, it usually signals a range-bound or neutral market where direction is less clear.
Some traders also treat moving averages as key levels for trading. For example:
- When price is above, MAs can act as support levels for trading bullish reactions.
- When price is below, MAs act as resistance levels for trading bearish rejections.
Common periods like the 200, 50, or 20 are widely watched, which means price often reacts around them, not because they’re special, but because so many traders are paying attention to the same levels.
How to calculate Moving Average
Moving averages are calculated by taking historical price data and averaging it over a fixed number of periods. Each new candle updates the calculation by adding the latest price and removing the oldest one, which is why the average “moves” along the chart.
The calculation method depends on the type of moving average used, but the core idea is the same: compress price history into a single, smooth value that updates over time.
Some moving averages treat every price equally, while others place more emphasis on recent data. This difference affects how quickly the moving average reacts to changes in price.
The exact mathematical formulas are covered in the next section.
Below are the formulas used to calculate the three moving averages covered in this article: Simple Moving Average (SMA), Exponential Moving Average (EMA), and Volume-Weighted Moving Average (VWMA).
| Simple Moving Average (SMA) The SMA is calculated by taking the arithmetic mean of price over a fixed number of periods. SMA Formula: SMA = (P₁ + P₂ + P₃ + … + Pₙ) ÷ n Where: P = price (usually the closing price) n = number of periods For example, a 20-day SMA adds the last 20 closing prices and divides the total by 20. |
| Exponential Moving Average (EMA) The EMA places more weight on recent prices, allowing it to react faster to new market information. EMA Calculation: Start with the SMA for the chosen period Calculate the multiplier: 2 ÷ (n + 1) Apply an Exponential Smoothing Formula, which makes the line lean more heavily to recent price changes. EMA Formula: EMA = (Current Price − Previous EMA) × Multiplier + Previous EMA This weighting system is why the EMA responds quicker than an SMA of the same length. |
| Volume-Weighted Moving Average (VWMA) The VWMA factors in trading volume, giving more importance to prices traded with higher volume. VWMA Formula: VWMA = Σ(Price × Volume) ÷ Σ(Volume) This makes the VWMA useful for spotting price levels that were actively traded, rather than moves driven by low-volume noise. |
What are Moving Averages used for?
Moving averages (MA) are versatile tools that traders use to identify trends, define dynamic support levels and resistance levels, and trigger trade signals such as moving average crossovers.
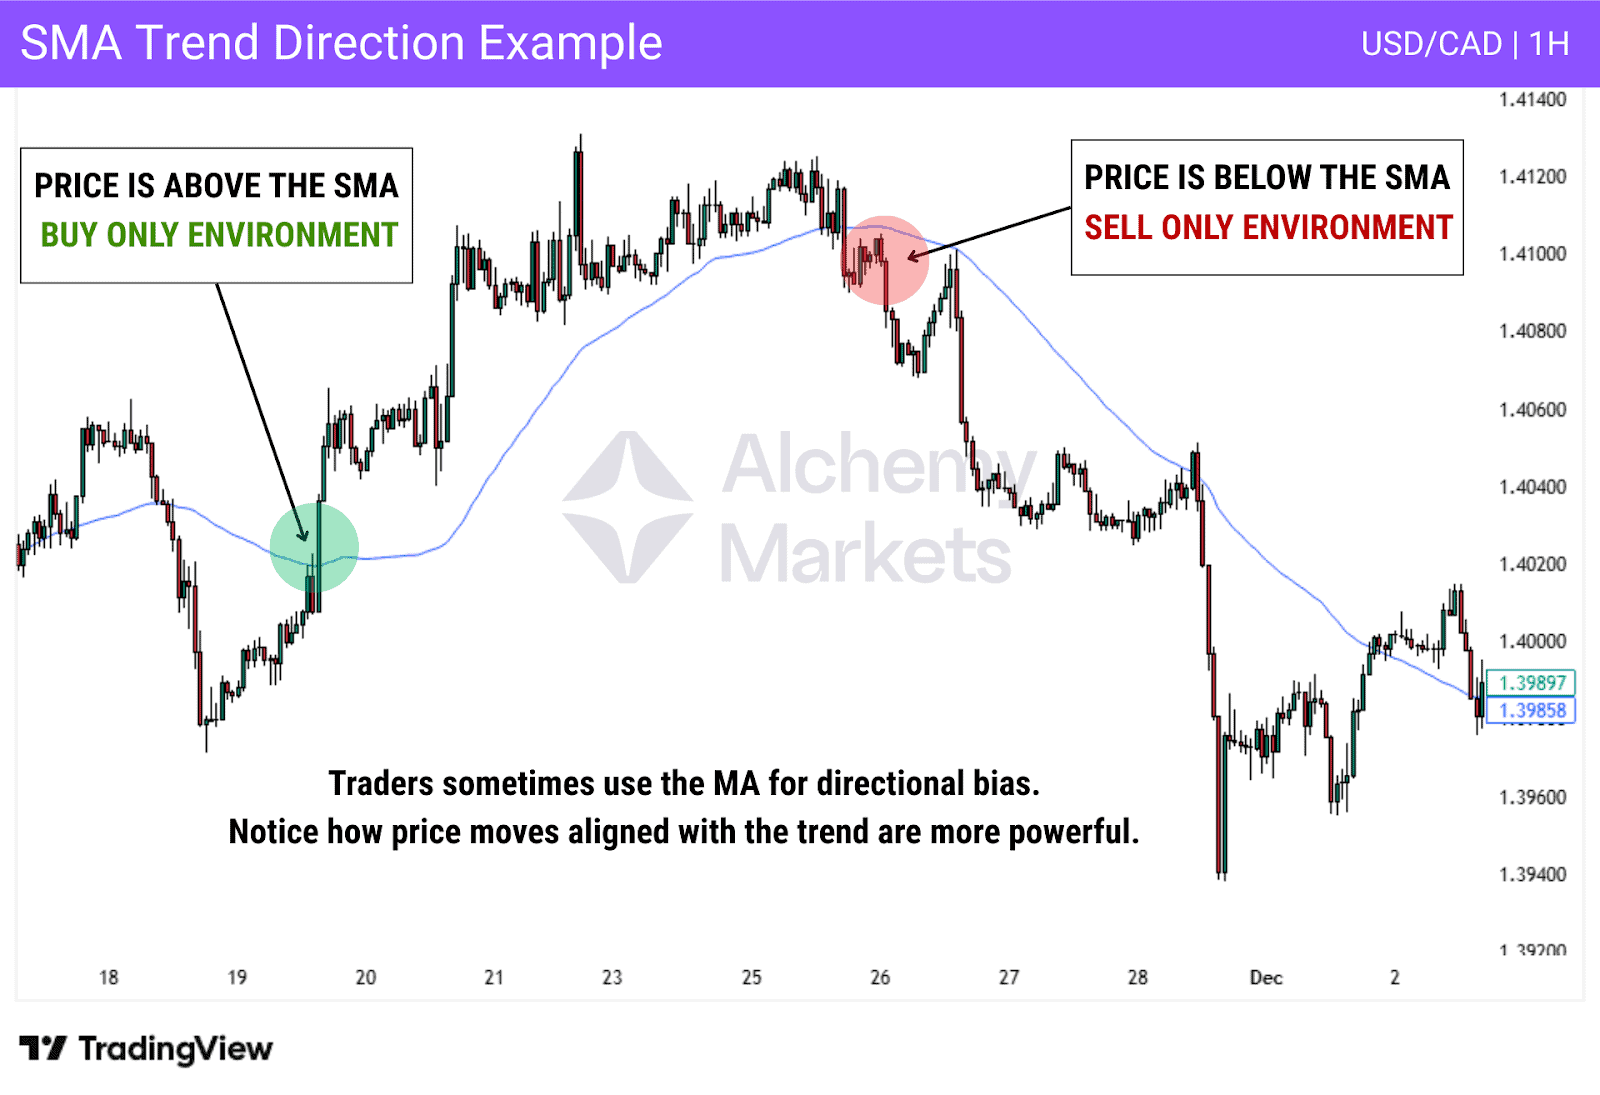
Traders also use moving averages as conditional filters, such as noticing if the price is above or below a moving average:
- If the price is above, we have a bullish directional bias (long trades only).
- If the price is below, we have a bearish directional bias (shorts only).
This helps traders avoid taking low probability trades which don’t align with the trend.
For example, the chart below (USD/CAD) shows how the 20 SMA is often used to define directional bias. When price is positioned on one side of the average, continuation in that direction tends to show stronger follow-through than moves against it.
Traders also use moving averages to identify potential support or resistance levels, as pullbacks toward the “average” of the trend often attract renewed buying or selling interest.
Because moving averages are widely followed, many trading systems respond around these levels, increasing their relevance.
In the Apple chart below, the rising 20-day SMA highlights areas where price has repeatedly found support on pullbacks, while also confirming the market’s current bullish trend direction.

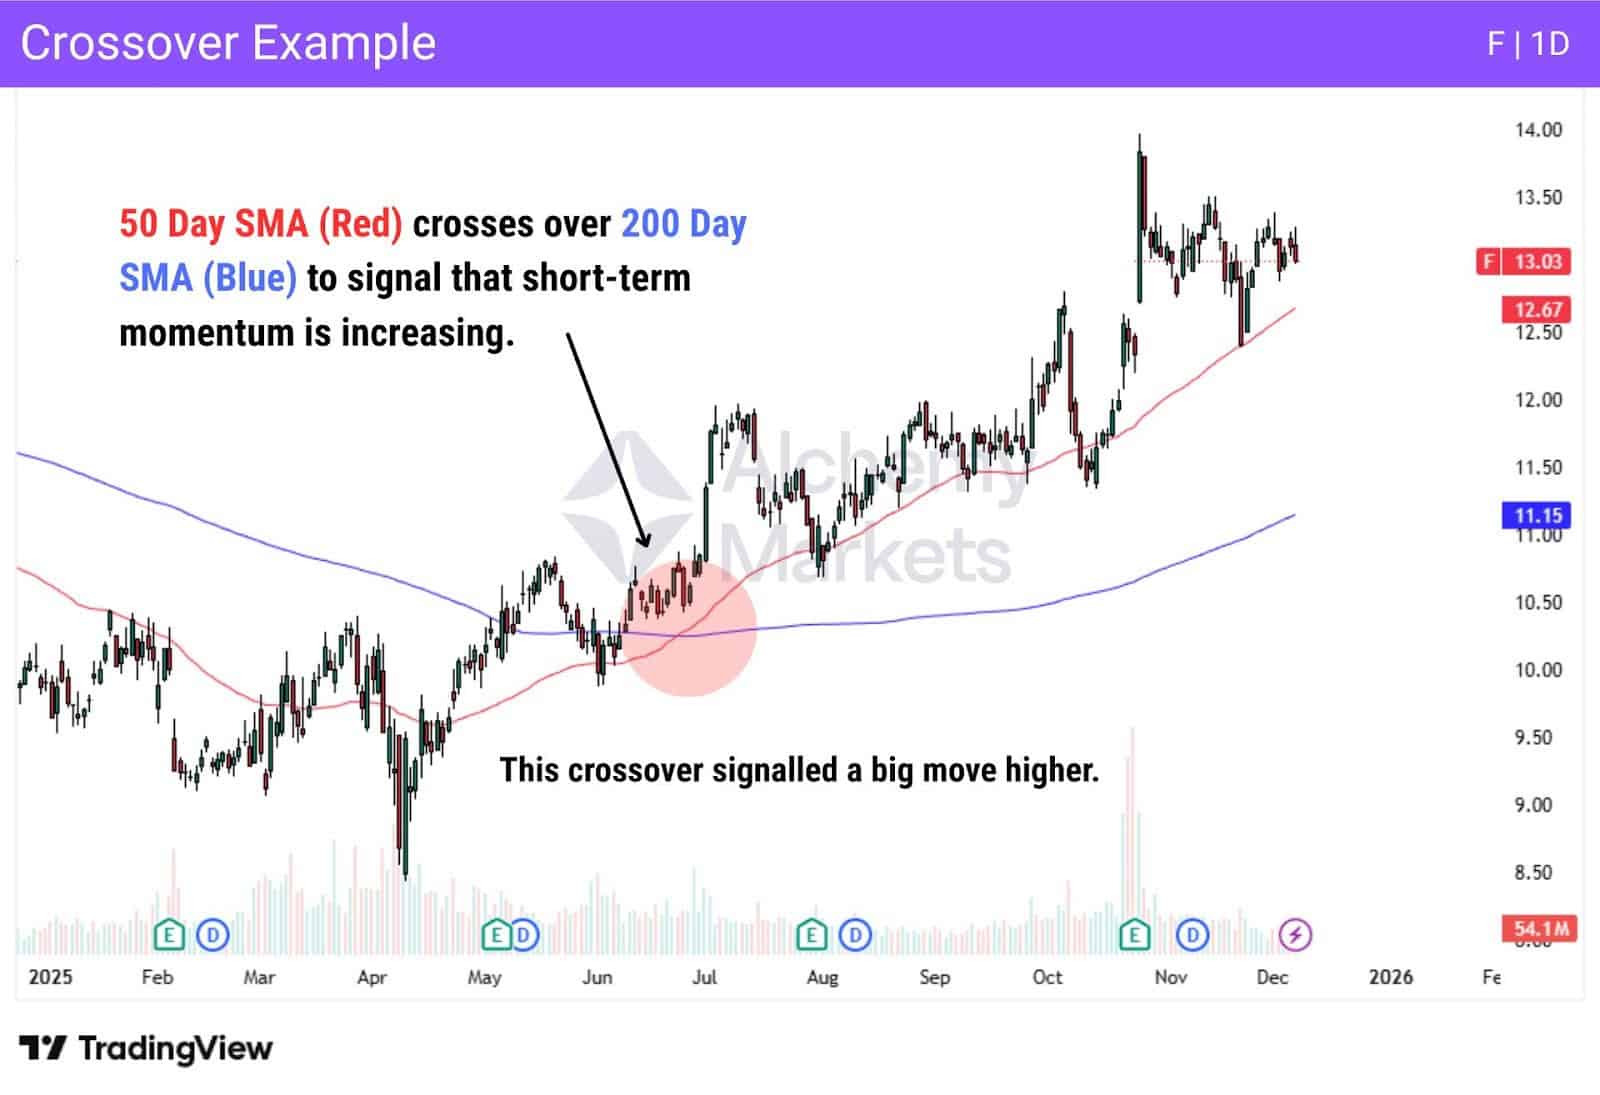
Moving average crossovers are another popular approach, where a shorter-term average cuts through a longer-term one, and indicates a momentum shift.
The two most well-known examples are the golden cross and the death cross, though the same principle applies to any moving average combination:
- Golden cross – When a shorter-term moving average crosses above a longer-term moving average, often viewed as a bullish momentum shift.
- Death cross – When a shorter-term moving average crosses below a longer-term moving average, commonly associated with a bearish momentum shift.
Importance of Moving Average Indicator
The importance of the moving average indicator lies in its widespread use and influence on market analysis. It is one of the most commonly referenced tools in trading, and price behaviour around key moving averages is frequently discussed in technical analysis.
A moving average represents the market’s average price over a defined period and is commonly used to identify trend direction, as well as potential support or resistance.
Example of a Moving Average
An example of a moving average can be seen on this Euro-Yen chart below.
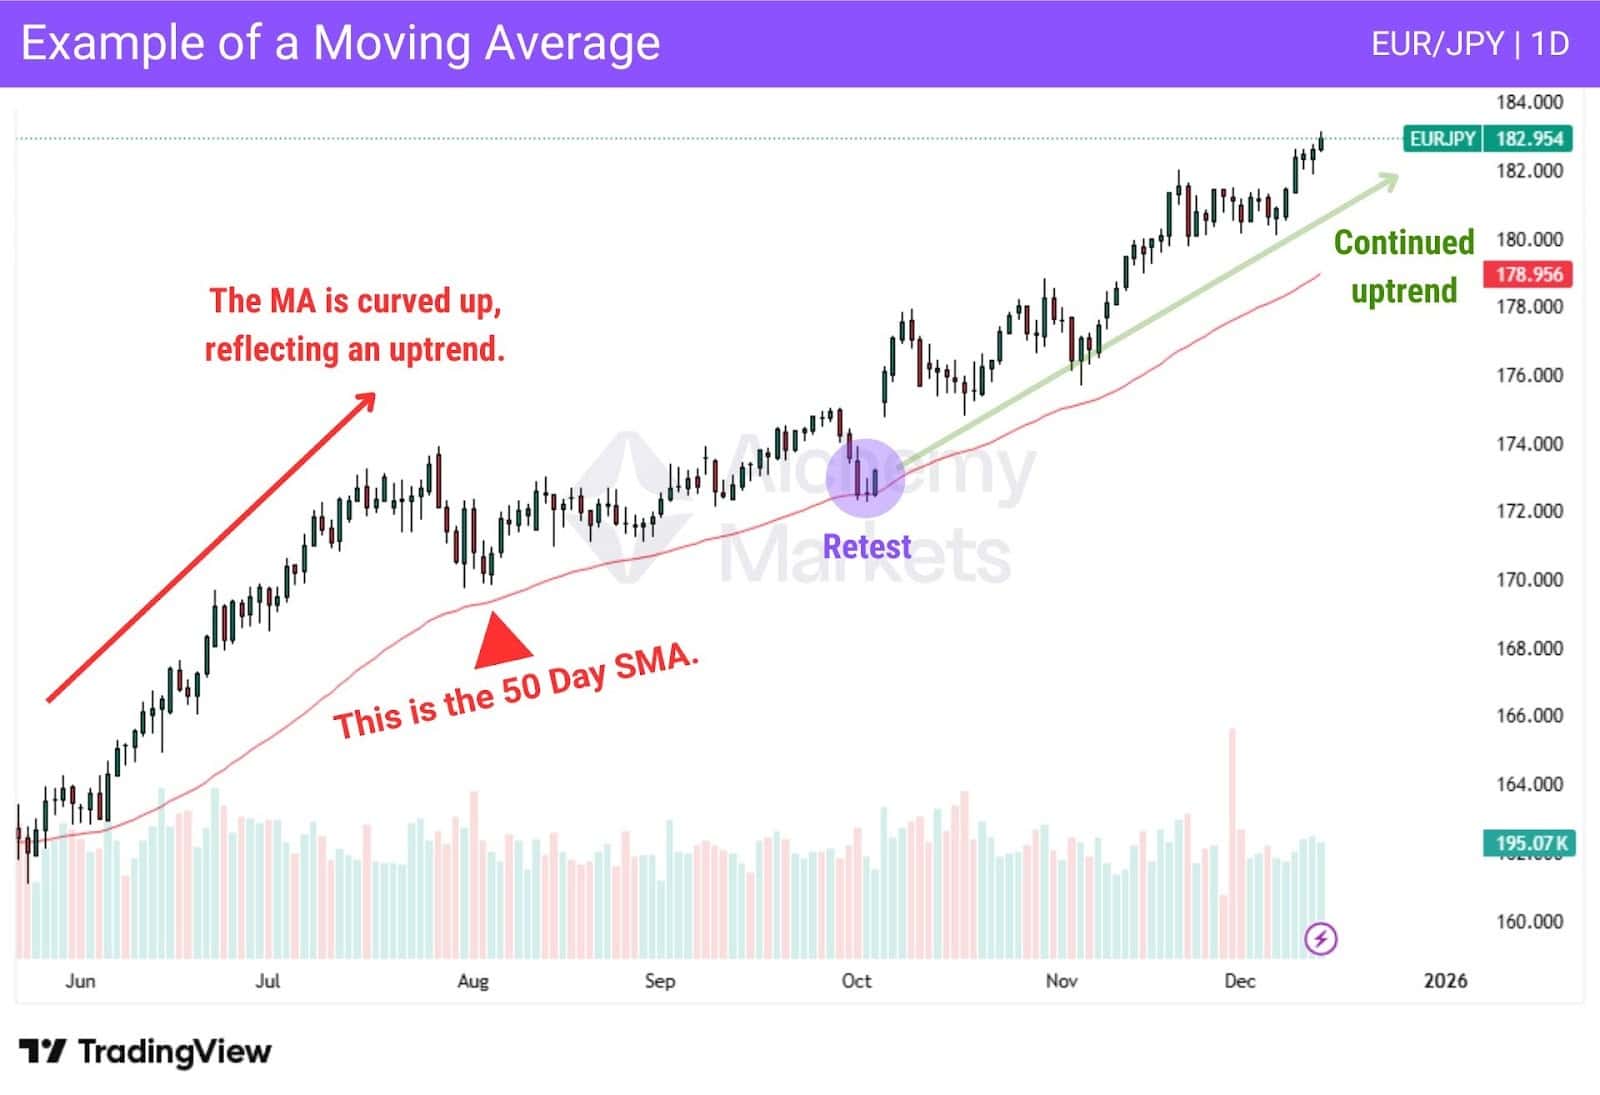
This highlights the multipurpose of a moving average indicator, whereby traders can:
- Find the market’s trend by looking at the slope of the moving average.
- Trade the MA like it is a support or resistance level, when the price retests the line.
- Gauge how healthy the trend is, based on if price breaks the MA in the opposite direction.
Types of Moving Averages
There are several types of moving averages available to traders for technical analysis.
Each moving average is typically used similarly, but there are slight differences in their calculations which make them effective for different situations.
In this guide, we’ll dive into three types of moving averages retail traders love.
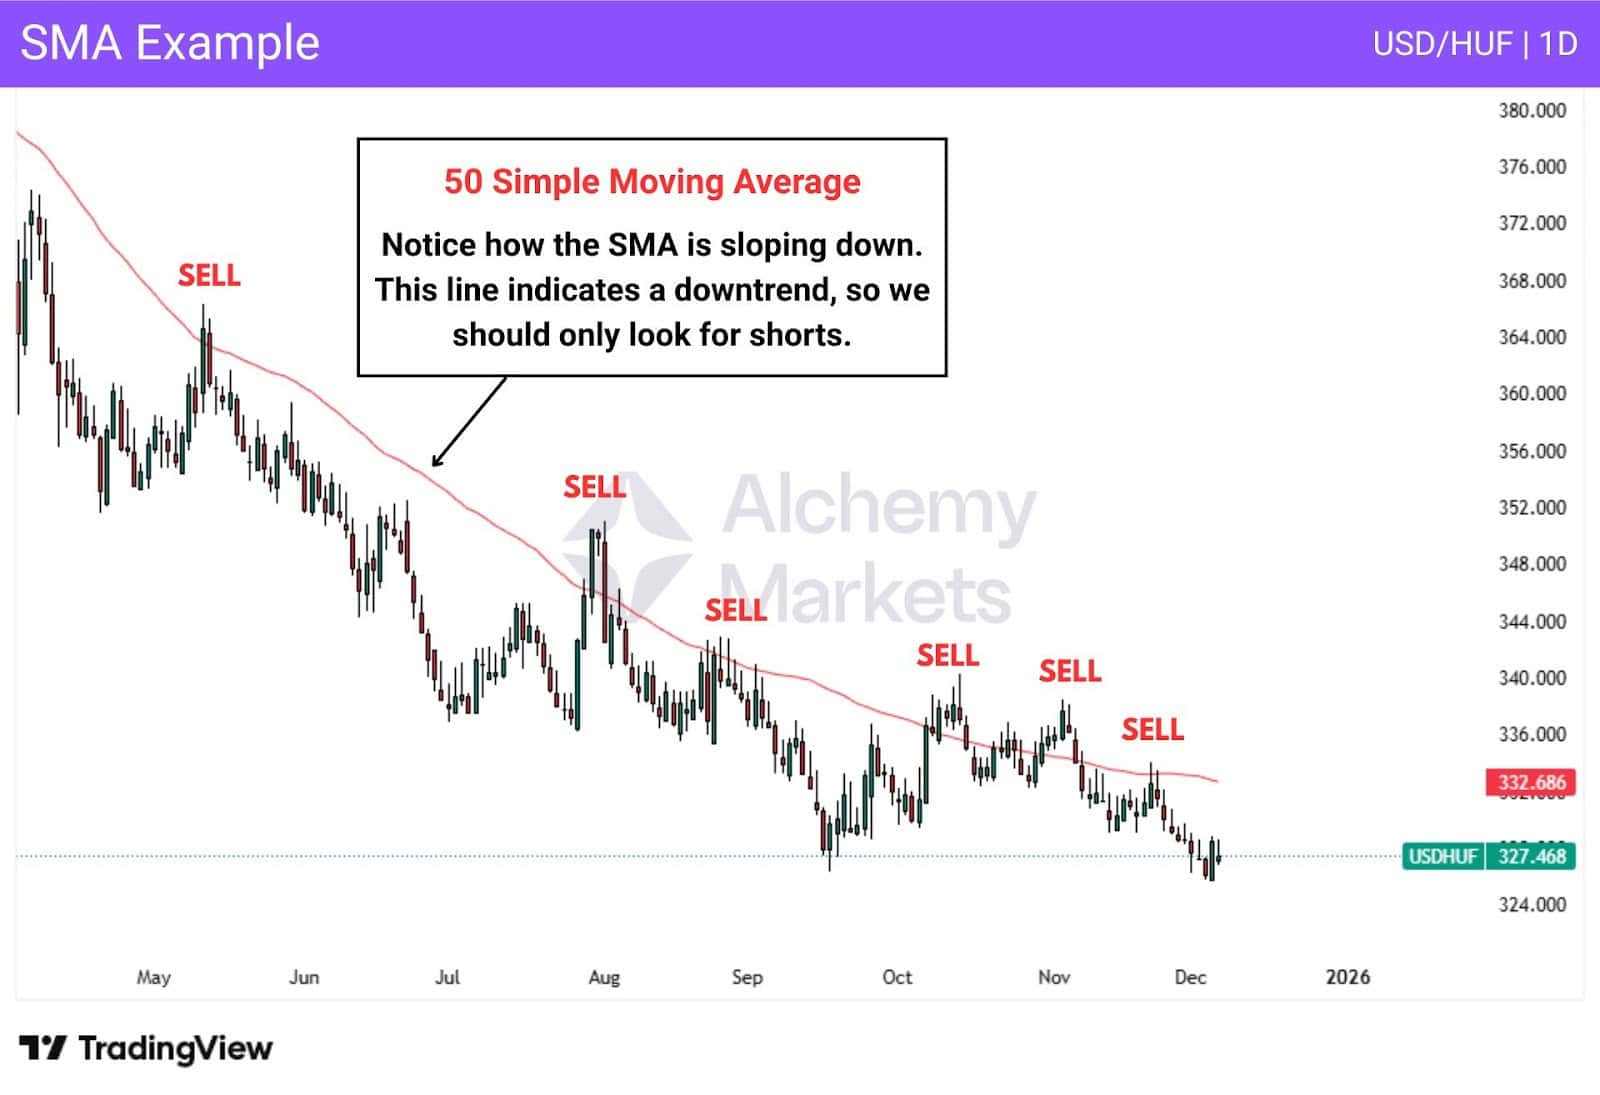
Simple Moving Average (SMA)
The simple moving average (SMA) is the most basic type of moving average. It is calculated by taking the average of price over a fixed period of time. In most cases, this means using the closing price of each candle within that period.
How to Calculate the Simple Moving Average:
- Add together the closing prices of each candle in the selected period.
- Divide that total by the number of candles (this is why a “50 SMA” uses the last 50 candles).
- Plot the result on the chart and connect each value to form a line.
Exponential Moving Average (EMA)
Unlike the SMA, the EMA uses exponential smoothing, which means recent prices are weighted more heavily than older data. This allows it to react faster to recent price changes.
The exponential moving average (EMA) is often used instead of the simple moving average because it reacts more quickly to recent price changes. This makes it popular with shorter-term traders, although it’s commonly used across all timeframes.
How the Exponential Moving Average Is Calculated:
- Start by calculating the SMA for the selected period.
- Calculate the multiplier using the formula: 2 ÷ (selected period + 1)
- Apply Exponential Smoothing formula so recent prices have more influence on the moving average.
Because recent prices are weighted more heavily, the EMA responds faster to price changes than an SMA of the same length.
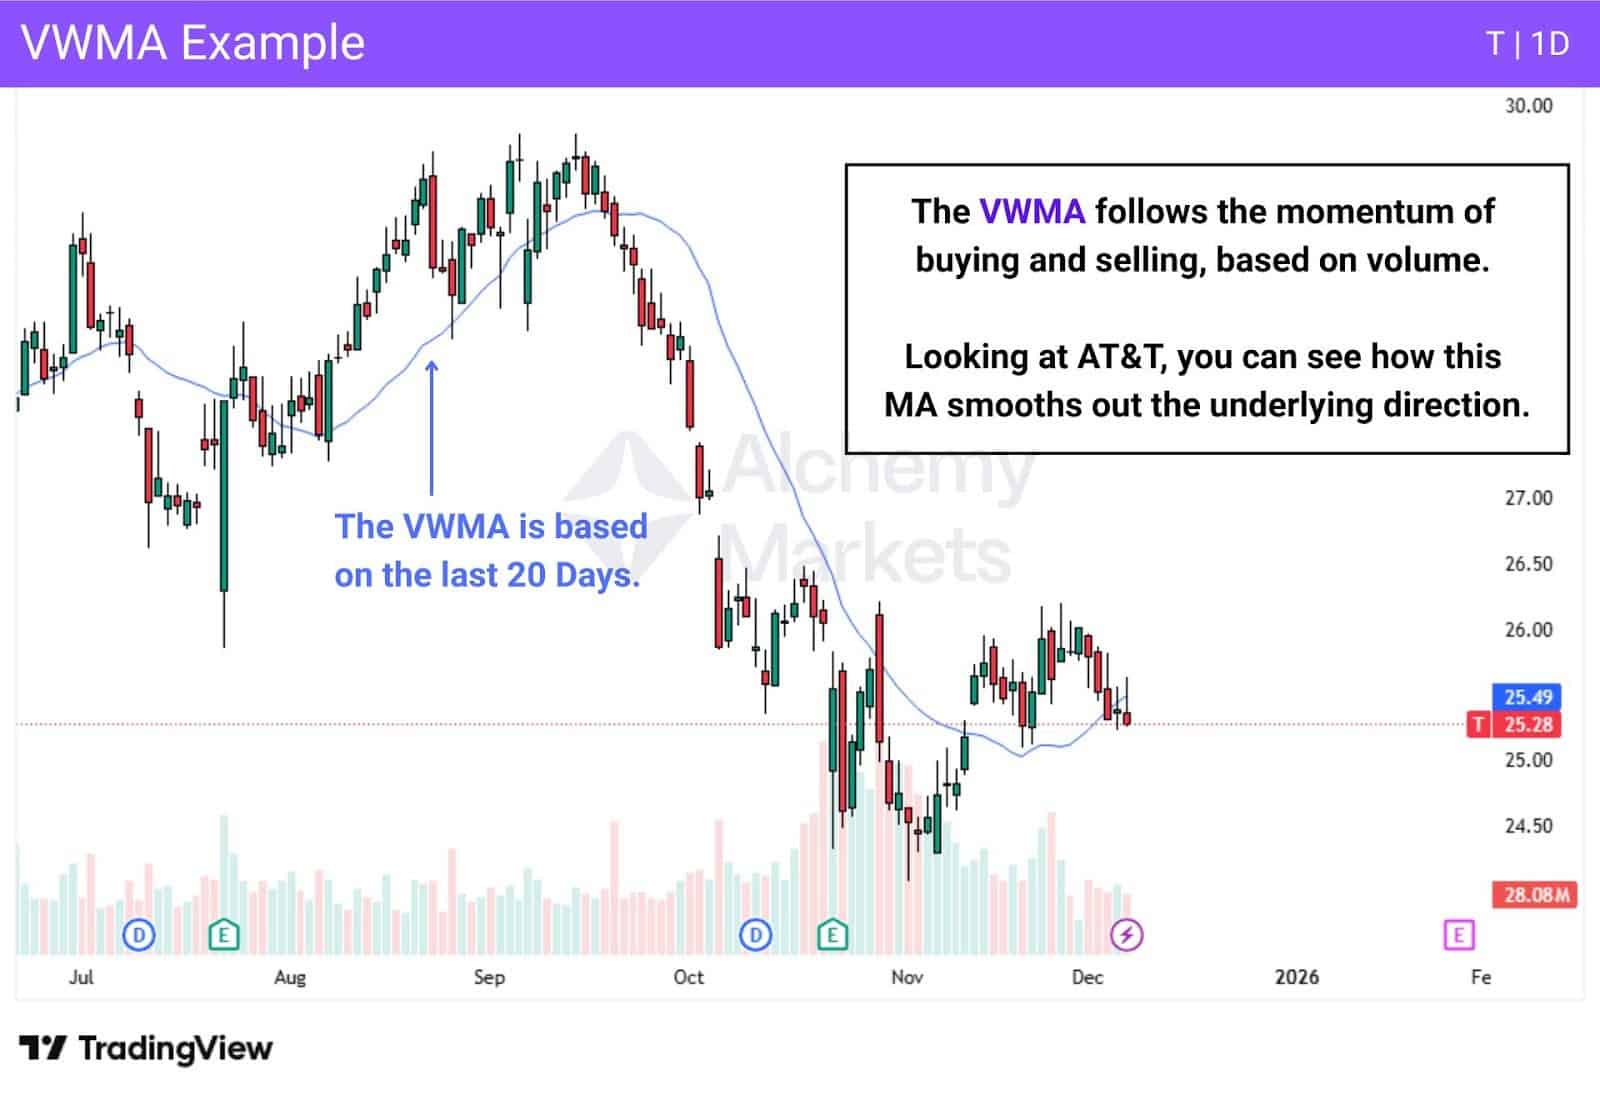
Volume Weighted Moving Average (VWMA)
The volume-weighted moving average (VWMA) shows the average price of an asset over a set period of time, while also factoring in trading volume. Unlike a standard moving average, it gives more importance to price levels where more trading activity has taken place.
Candles with higher volume carry more weight in the calculation. This means a high-volume candle from several periods ago can still influence the VWMA more than recent candles that traded on low volume.
How the Volume-Weighted Moving Average Is Calculated:
- Multiply each candle’s price by its trading volume.
- Add these values together over the selected period.
- Divide the total by the sum of volume for the same period.
Because the VWMA relies on real volume data, it is most useful in markets where actual traded volume is available, such as stocks, indices, and futures. In these markets, the VWMA can help reveal where meaningful trading activity is taking place, rather than price moves driven by thin participation.
Moving Average Convergence Divergence (MACD)
While the MACD is not a moving average itself, it is an indicator built entirely from moving averages. It tracks the relationship between two exponential moving averages to measure momentum.

The standard MACD is calculated by subtracting the 26-period EMA from the 12-period EMA. This shows whether short-term price movement is accelerating or slowing relative to the longer-term trend.
A signal line is then added to help interpret momentum shifts:
- The signal line is a 9-period SMA of the MACD.
- It is plotted on the same panel and is commonly used to spot momentum changes and crossovers.
How to read the MACD:
- MACD above zero: the short-term EMA is above the long-term EMA, signalling positive momentum.
- MACD below zero: the short-term EMA is below the long-term EMA, indicating bearish momentum.
- Changes in direction often appear in the MACD before they are obvious in price.
Trading Strategies with Moving Average
Strategies with moving average trading concepts rarely just rely on the indicator alone. This is because moving averages are designed to be trend filters primarily.
That being said, it’s worth noting that they appear in many different trading systems and methodologies. Price can be interpreted in several ways, and moving averages are often used as a reference point to help make sense of that movement.
Let’s dive into how traders use it in their strategies.
Price Crossovers
Moving averages are used in many ways, but one of the most common applications is price crossovers. This happens when price moves from one side of the moving average to the other, signalling a potential shift in market direction.
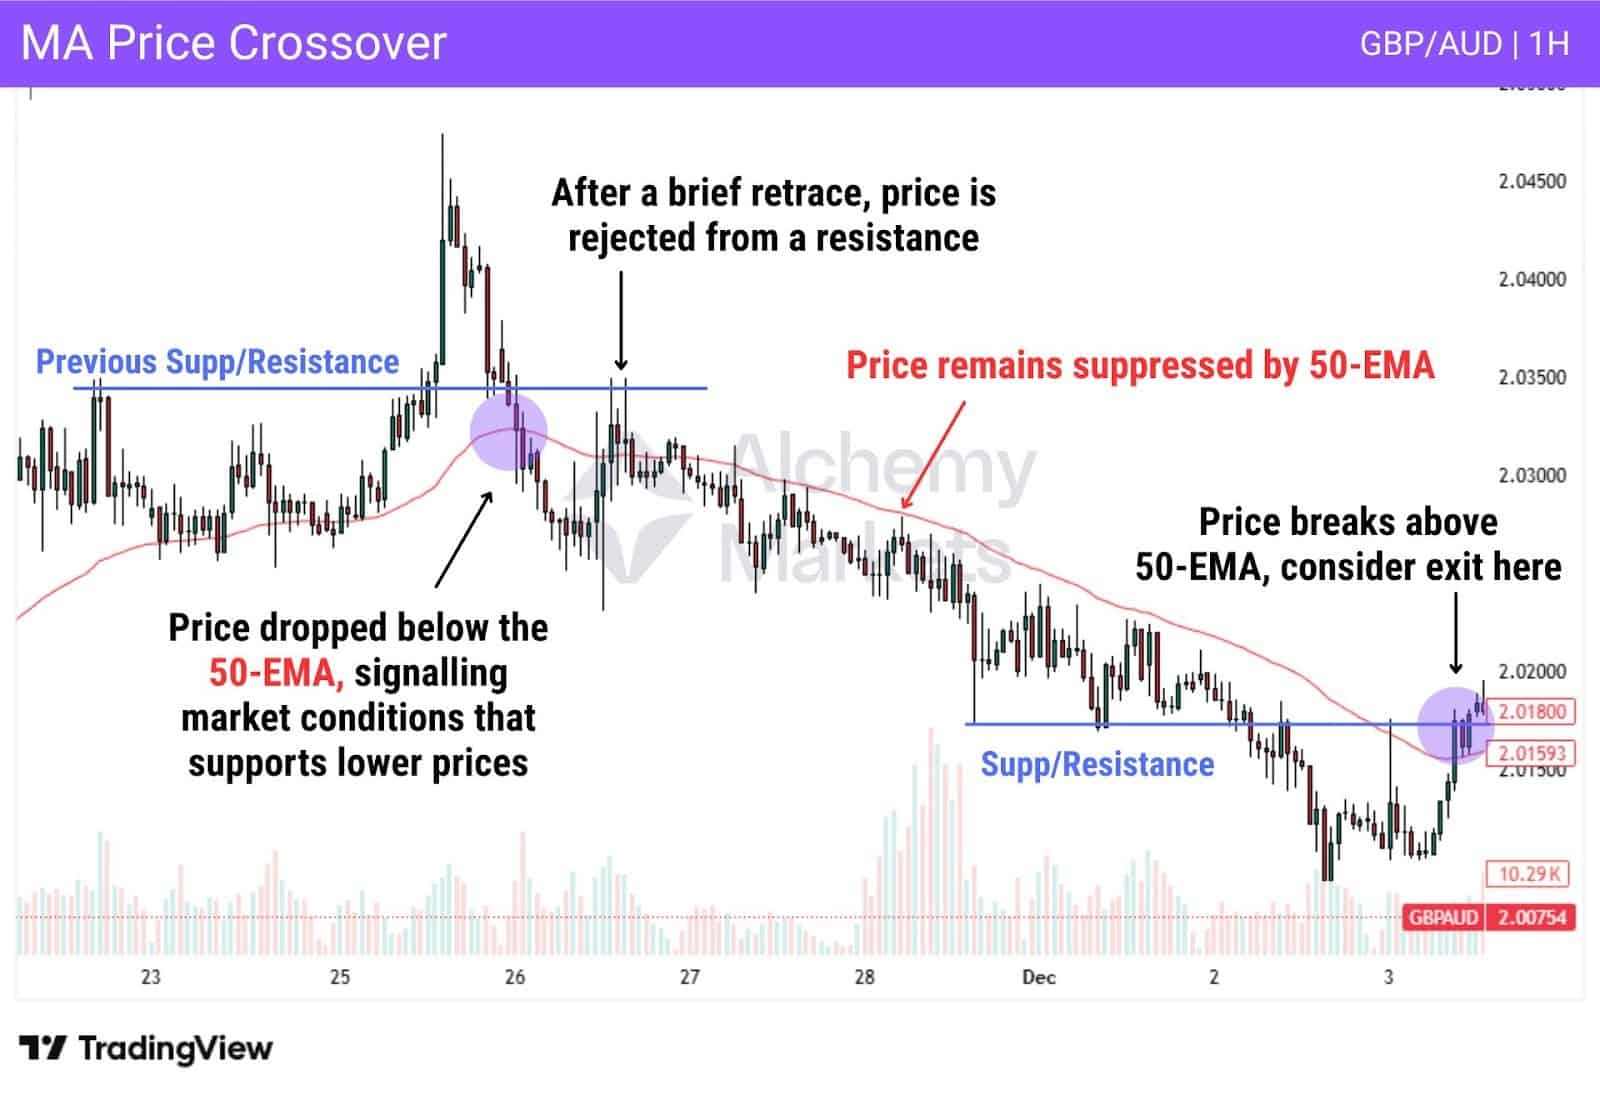
In the example above, once price drops below the 50-EMA, downside momentum builds and price continues lower.
The crossover doesn’t always result in a trend shift as clean as this one, but it helps highlight when market conditions are no longer supportive of higher (or lower) prices.
Price crossovers are widely used as a trade filter, rather than a standalone entry signal. For instance:
- If the price is above a chosen moving average, a trader may only look for long setups.
- If the price is below that same moving average, they may only focus on short setups.
The effectiveness will depend on the length of moving average chosen, timeframe, and asset — so further testing is recommended.
| Note: Popular MAs chosen are 9, 10, 20, 50, 100, and 200. |
Settings for Moving Averages
Moving average settings can vary, but a few lengths show up repeatedly across most trading styles, whether traders use an SMA or EMA.
Commonly used settings include:
- 200-period MA for long-term trend direction
- 50-period MA for medium-term trend analysis
- 9, 10, or 20-period MA for short-term price action
On a daily chart, these settings have a practical basis:
- The 200-day MA roughly represents a trading year,
- while the 50-day MA reflects about a quarter.
Shorter lengths often align with two-week or monthly cycles, and the same values are commonly reused on lower timeframes. Short-term traders simply scale these numbers down to stay responsive to price.
Length of Moving Averages
The length of a moving average refers to how many candles are included in its calculation. For example, a 20-day SMA averages the last 20 daily candles.
There is no single “best” length. Changing the period can materially alter how the moving average behaves, sometimes even flipping its slope from rising to falling. As a general rule:
- Shorter moving averages react faster and suit short-term trading.
- Longer moving averages move more slowly and are better for identifying the broader trend.
Trend Trading with Multiple Averages
One way traders use moving averages is by combining several of them, forming what’s called a moving average “ribbon”. Three averages is common, though some traders use five or more.
The goal is to see whether different time horizons are aligned. In a bullish trend, the shorter-term EMAs should sit above the longer-term ones, showing that momentum is strong across short, medium, and longer-term traders.
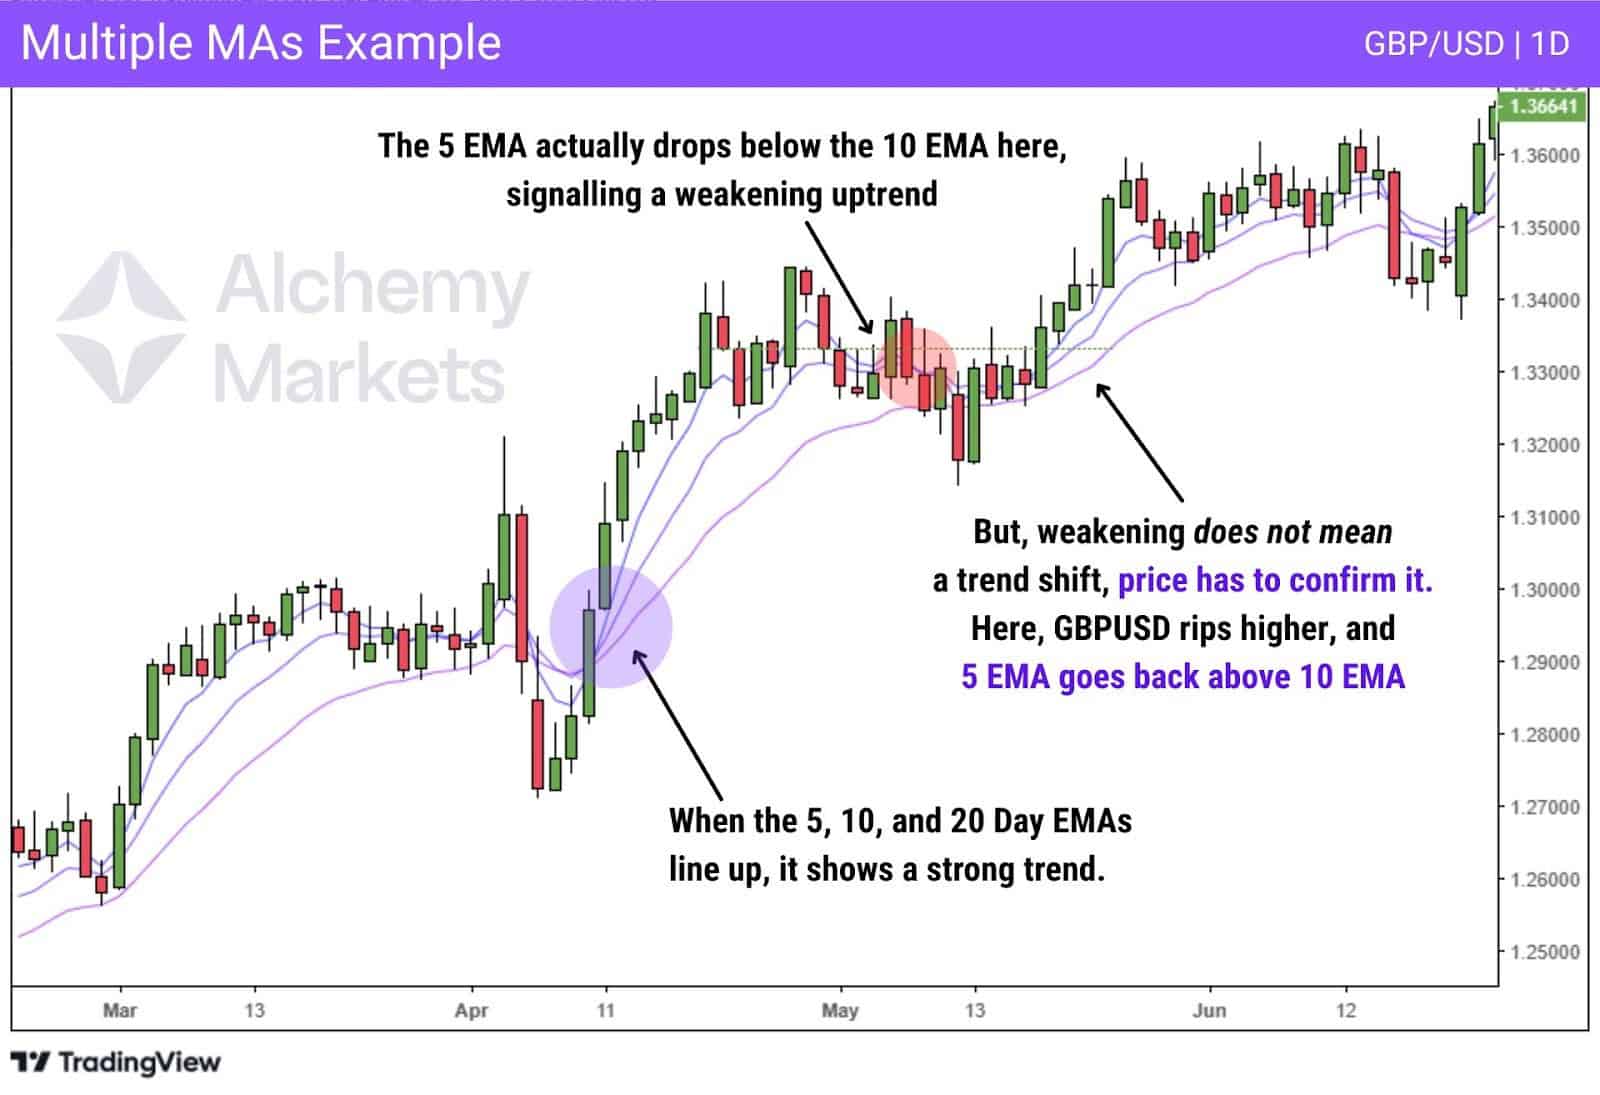
As shown in the example, when the 5, 10, and 20 EMAs line up and move higher together, it reflects a strong, healthy trend. When the shortest EMA begins to cross back below the others, it signals that momentum is slowing and the trend may be weakening.
This doesn’t mean price must immediately reverse, but it does suggest that the trend is losing alignment and deserves closer attention.
Golden/Death Cross
A golden cross is a specific type of moving average crossover where a short-term moving average crosses above a longer-term one. It is most commonly observed when the 50-day MA moves above the 200-day MA, typically on the daily timeframe. Shorter-term traders often apply the same idea using faster combinations, such as the 10 and 20 or the 20 and 50.
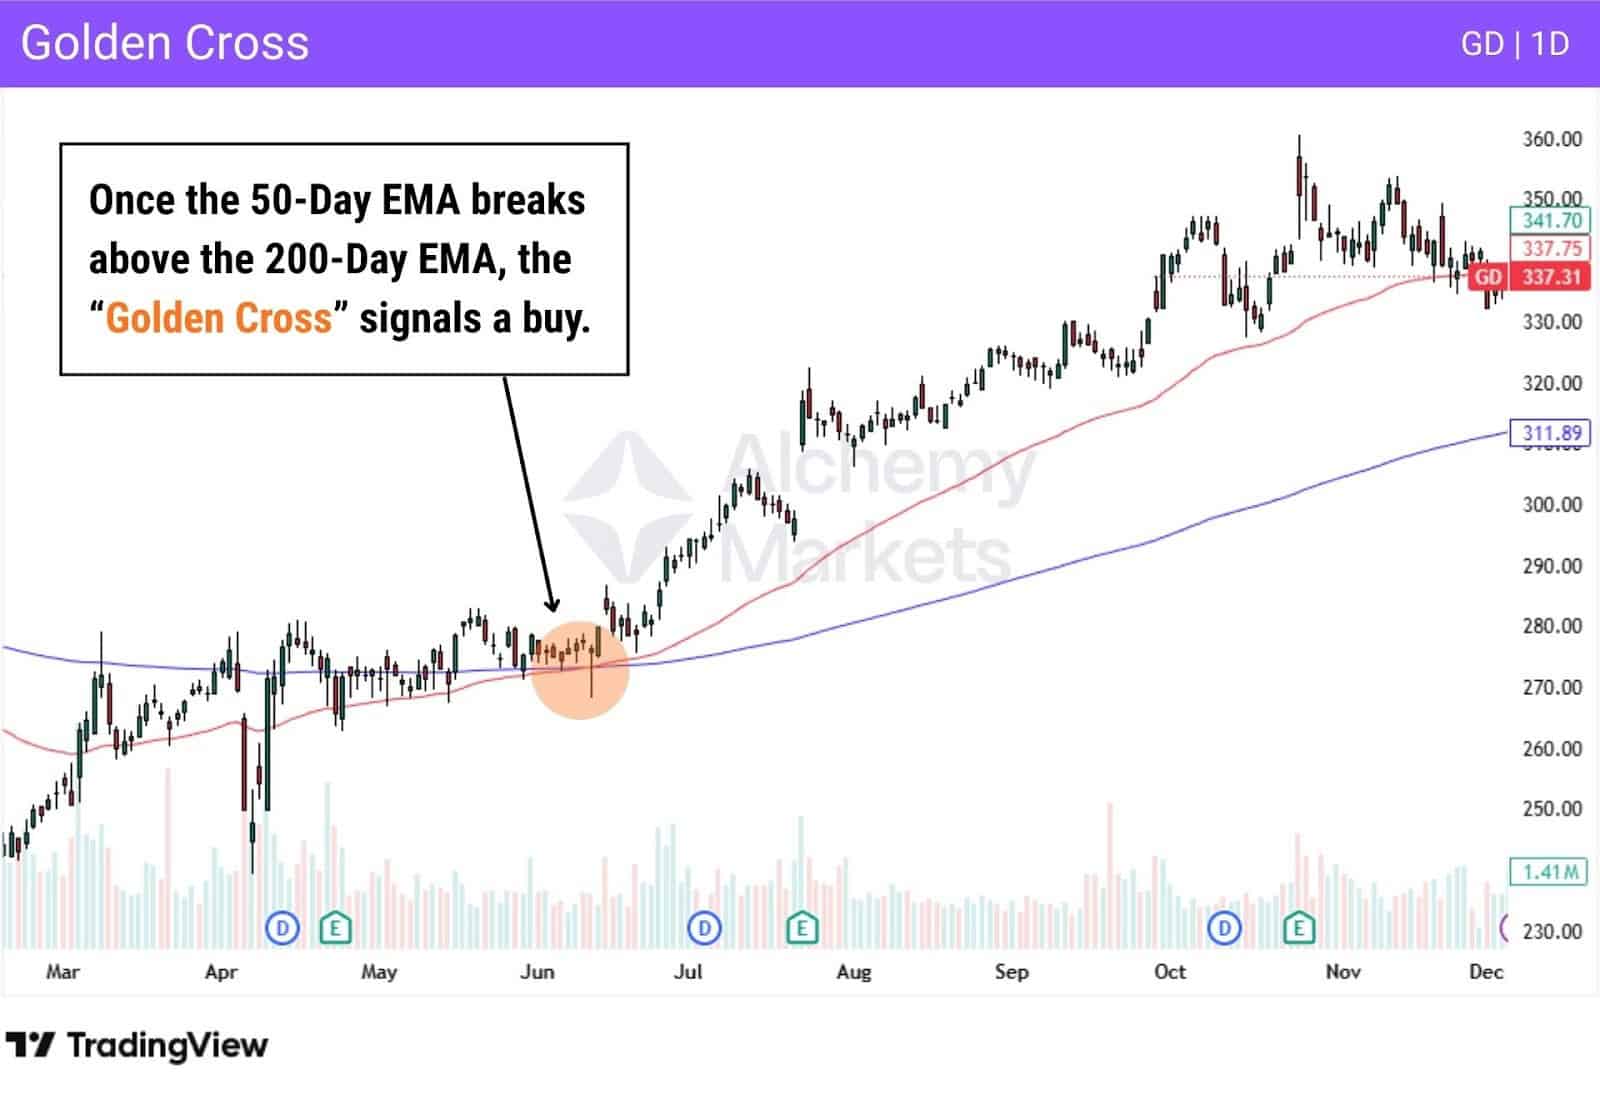
The opposite setup is known as a death cross, where a short-term moving average crosses below a longer-term one. This crossover reflects a shift toward bearish conditions and weakening longer-term momentum.

Rather than immediately shorting the market, many traders use death crosses as a warning signal or a reason to step aside. In some markets, such as cryptocurrencies, shorting can be difficult or risky, so avoiding trades altogether is often the more practical response.
Moving Average Convergence Divergence (MACD)
This chart shows how MACD can be used to confirm momentum around key price levels, rather than as a standalone entry tool.
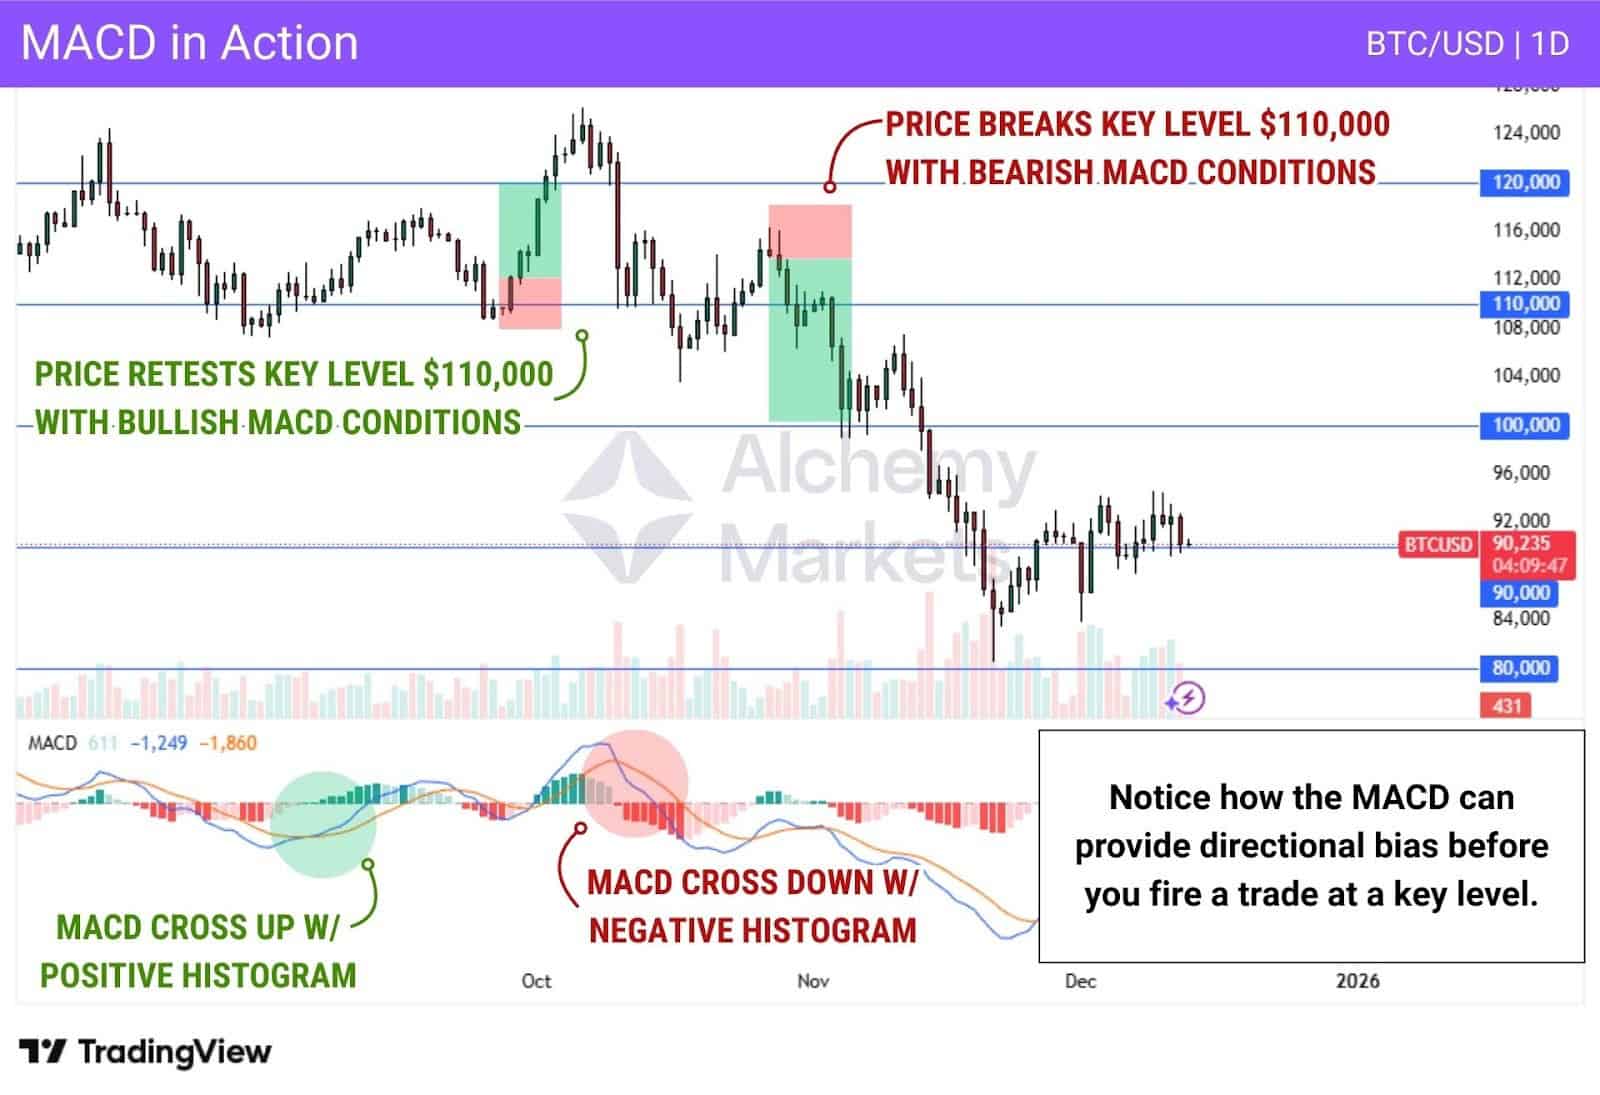
The key takeaway is sequencing:
- Momentum shifts first (MACD crossover + histogram change)
- Price reacts around an important level
- The break or hold of that level determines trade direction
On the bullish side (left), the MACD crosses above its signal line while the histogram turns positive.
This signals improving upside momentum. Price then holds and retests the $110,000 level, showing that buyers are defending the level. In this context, the MACD doesn’t trigger the trade on its own, but it supports the idea that a long setup is valid once price structure holds.
On the bearish side (right), the MACD crosses down and the histogram turns negative, signalling momentum shifting to the downside.
Price then fails to reclaim $110,000 and breaks lower, confirming that selling pressure is in control. The MACD shift helps validate the downside move, especially once price loses the key level.
Mean Reversion using Bollinger Bands
Bollinger Bands® are sometimes used to identify mean reversion conditions, especially when a market lacks a strong trend. The key reference is the 20-period SMA, which represents the average price that markets often gravitate back toward.
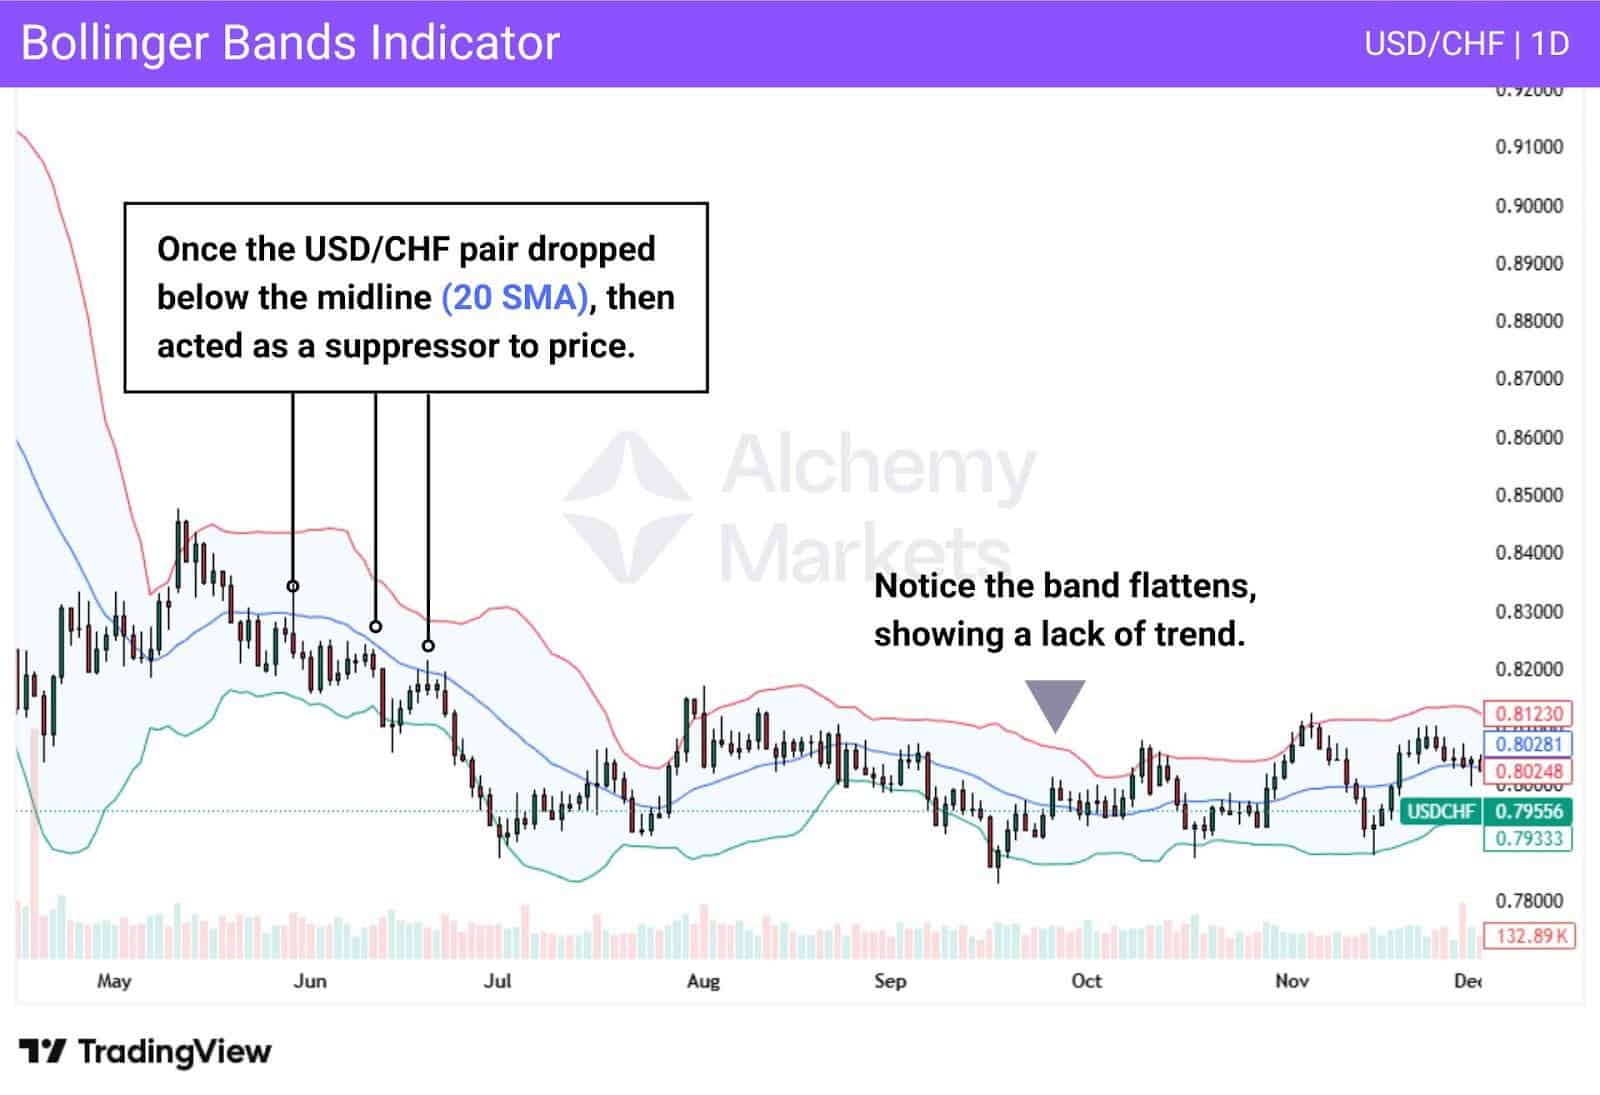
In slower or range-bound environments, price can struggle to sustain moves away from this mean. When that happens, the 20 SMA may act as a short-term support or resistance level, with price repeatedly rotating back toward it rather than trending cleanly in one direction.
Traders typically look for:
- Price extending away from the mean, then stalling
- Flattening bands, which signal reduced trend strength
Rather than treating this as a reversal signal, Bollinger Bands are mainly used to frame expectations. If price fails to reclaim the mean, it suggests continuation is weak. If it snaps back quickly, it reinforces the idea of a mean-reverting market.
Pros of using Moving Average
There are several pros of using moving averages, and all of these are true in exponential moving averages, simple moving averages, a weighted average, or any other variety.
- Helps identify the trend.
- Plots dynamic support and resistance.
- Can produce trade signals.
- Works in different markets and timeframes.
- Can complement other indicators.
- Helps reduce market noise.
Cons of using Moving Average
Although traders can use moving averages to determine such important things as trend direction, support and resistance, and moving averages smooth out noise, they are not perfect. There are cons to using this technical indicator.
- Moving averages are a lagging indicator.
- Tend to lack effectiveness in sideways or choppy markets.
- False signals are possible.
- Whipsaws are a danger.
- Lacks predictability.
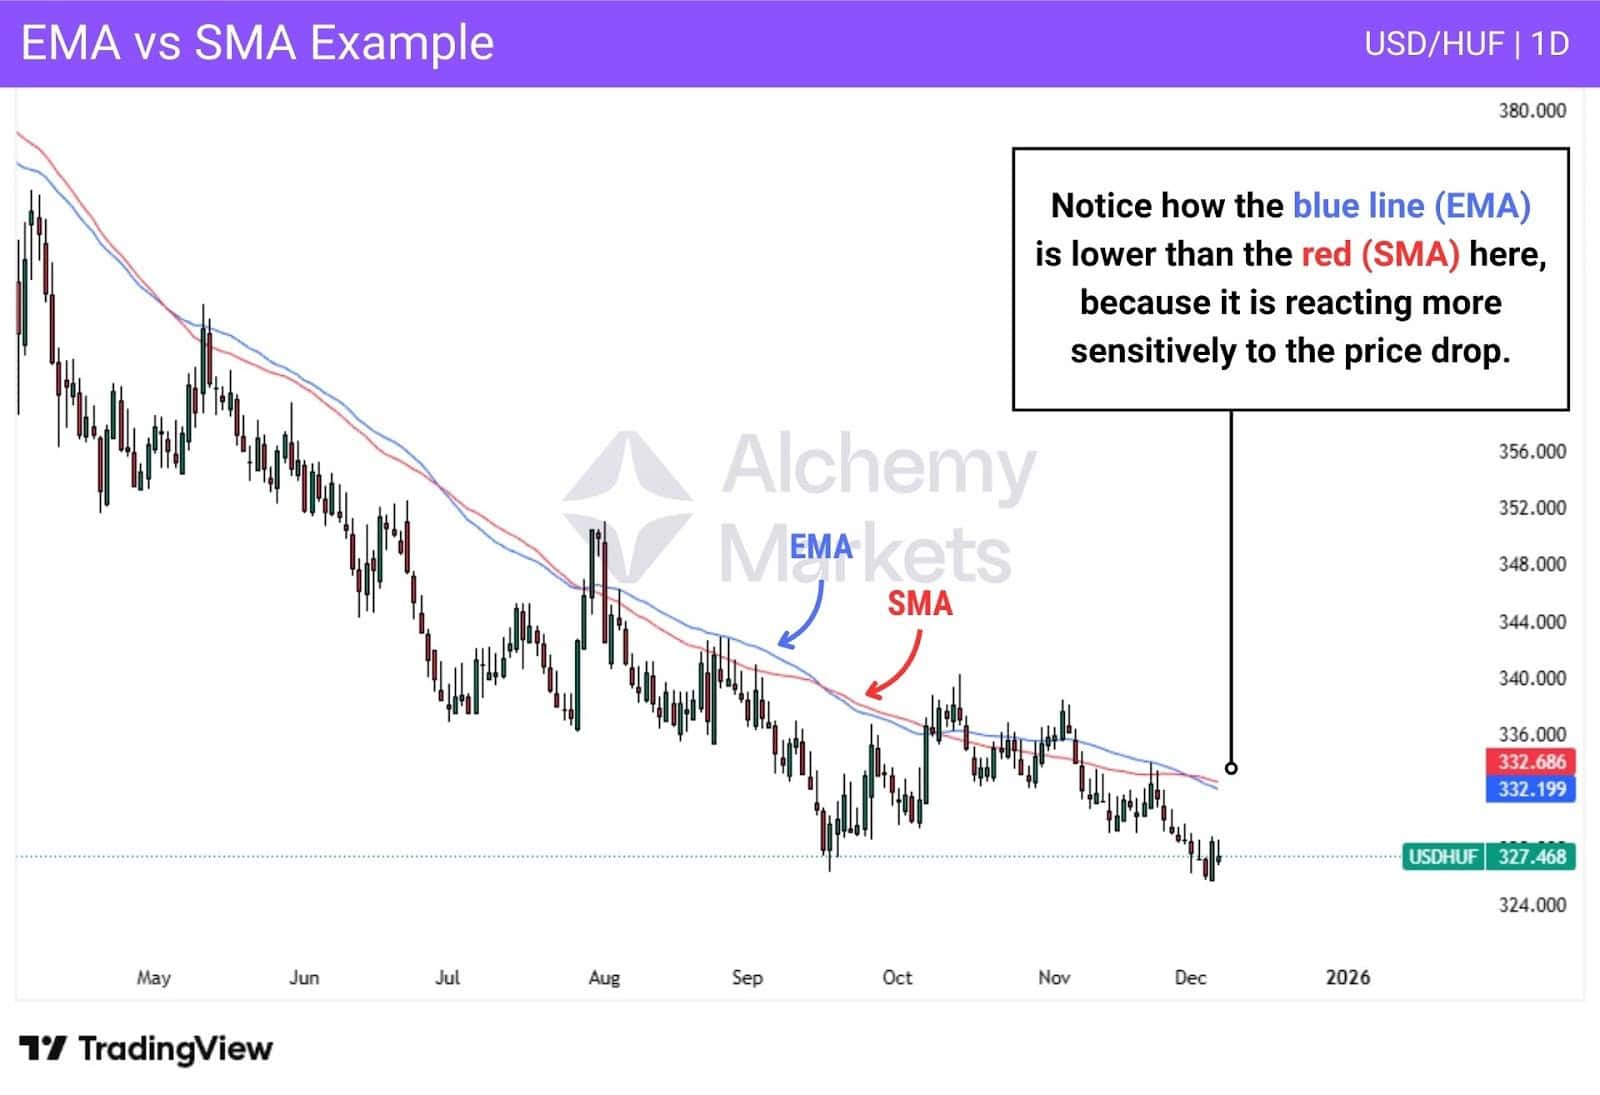
Simple Moving Average (SMA) vs Exponential Moving Average (EMA)
Both types of moving averages will follow price movement and use it in their calculations; there is a slight difference between simple moving averages and exponential moving averages. While there will be only slight differences for most traders, the main takeaway is that the simple moving average is a calculation that takes the basic arithmetic mean of the given set of prices over a specific number of candles.
The exponential moving average is the same, but ait dds a filter to make it more sensitive to movement. This is done by adding more weight to the more recent candles and values to alter how long it takes to move. As a general rule, there is only a slight difference, unless you are trading short-term charts, as EMAs seem to be more catered to that kind of trading.
Simple Moving Average (SMA) vs Volume Weighted Moving Average (VWMA)
The simple moving average is again calculated by taking the arithmetic mean of a given set of values, over a specific number of candles. However, the volume weighted moving average is different, because it takes the volume of each candle into account. In other words, if there is more volume traded at one candle over another, the one with the more volume is given a larger part of the input to get the VWMA value.
Moving Averages and Trend Reversals
While traders will often use price action to determine a trend or trend reversal, some traders prefer to have price action backed up by moving averages to confirm potential entry points or exit points.
For example, a bullish crossover, when a short-term moving average crosses above a long-term moving average, can signal a new uptrend. This is the most obvious signal for short sellers to get out and new buyers to enter the market. There is also where the short-term moving average crosses below a long-term moving average, which is very bearish. This signals that traders may wish to exit bullish positions and possibly short a market.
There are also times when price action “gets too far” from a standard moving average. This suggests that the market may be overbought or oversold, and while the trend may not change from a longer-term perspective, a pullback might be imminent.
FAQ:
What are the Best Moving Average Settings?
While there is no “set in stone” best moving average per se, there are some common periods that traders will use. For short-term trades, it’s common to see the 5, 10, and 20. Moving averages, while longer-term trades may focus more on the 50, 100, and 200. Moving averages.
Is Moving Average a Leading or Lagging Indicator?
While moving averages are lagging indicators, many traders still use them as part of broader moving average forecasting, where averages help frame likely scenarios such as trend continuation, pullbacks, or mean reversion rather than predicting exact turning points.
What other ways can Moving Averages be Used?
Moving averages can be used in multiple ways, including:
- Trend identification
- Support and resistance
- Mean reversion
- Price crossovers
- MA crossovers
What is the Difference between Trend Following and Mean Reversion?
Moving averages are often used for trend identification. By recognising whether the market is in an upward trend or a downward trend, this allows people to follow the overall trend. However, there are times when price gets so far away from the “average price” that it might be overbought or oversold, and there is a natural inclination for price to return to the moving average in what is known as “mean reversion.” Sometimes, when markets get a specific amount of distance from the moving average, usually a percentage, traders consider those moves as reversal signals.
What are the Common Mistakes to Avoid when Using The Moving Average Indicator?
There are several common mistakes that traders make when trading moving averages. The biggest issue is overreliance on them. The reality is that the moving average isn’t the be-all-end-all of indicators or the “holy grail” when it comes to analysis.
A few issues that can appear:
- Support and resistance aren’t absolute. The moving average is simply an area where these things MAY OCCUR.
- Moving averages are lagging. They only suggest what has happened, and cannot be thought of as predictive for reversals. They tend to confirm trends more than anything else.
- Some traders make the mistake of having too many moving averages on a chart. Keeping it simple is the best practice. As a general rule, more than three moving averages will make things more confusing than necessary.


