Written by:

- Chart of the Day
- January 30, 2026
- 2 min read
Rare Signal Flashing: Gold Prints Largest Monthly Candle Since 1980’s
Gold right now is printing a rare signal on the higher timeframe, and many traders are going to miss it.
Take a look at this chart – spanning back to 1999. Every time gold has printed a significant candle range, it has marked a pivotal point where price reverses, either dramatically or in a slow drip fashion.
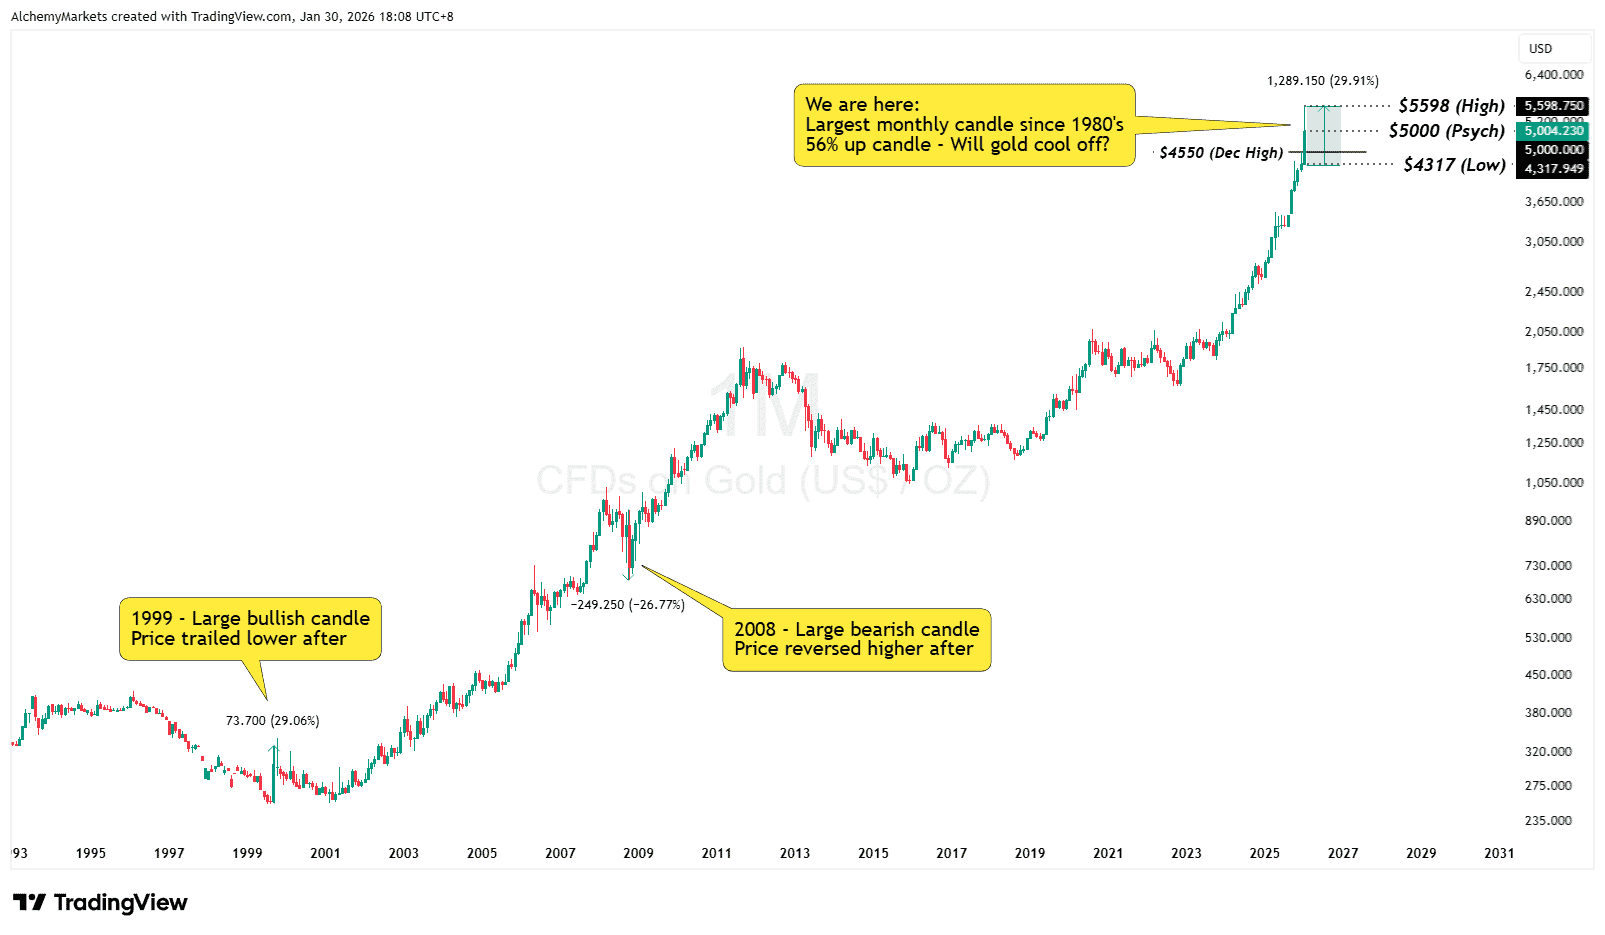
Today, gold has printed a huge 29.91% sized candle (counting wicks), which is the largest candle print since 1980, where an astonishing 56% up candle was printed.
And even that marked a pivotal point for Gold.
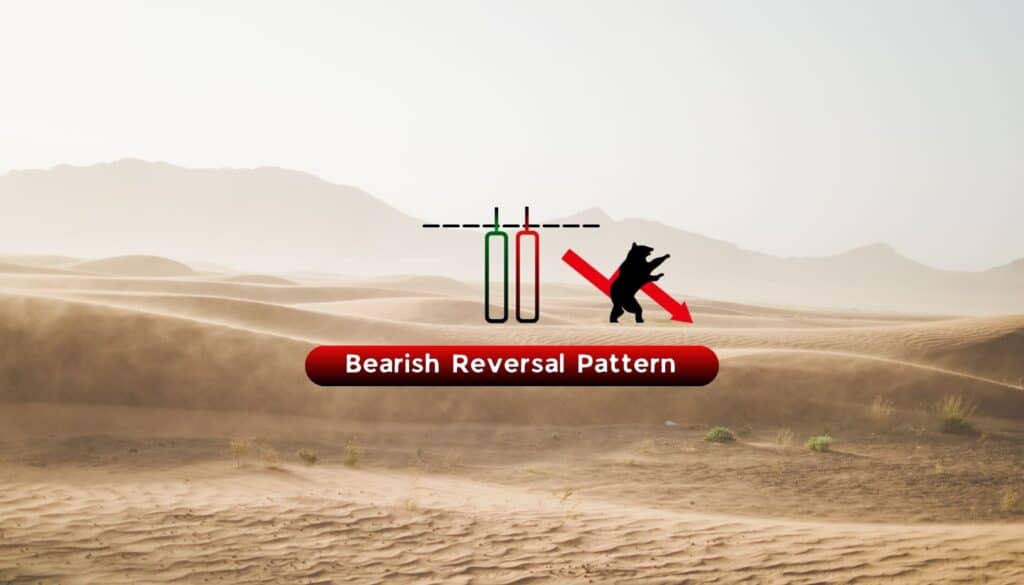
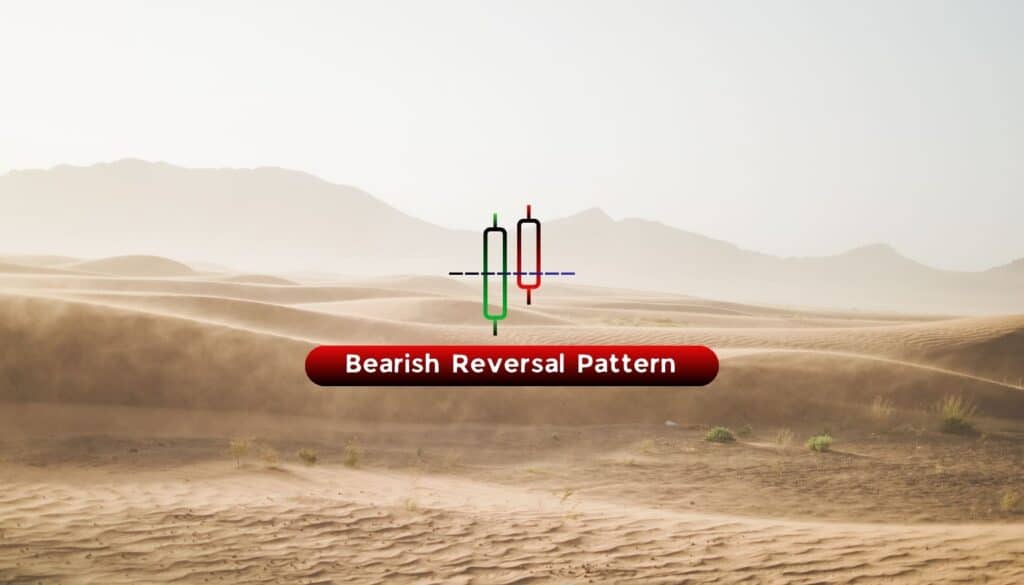
Weekly Timeframe Shooting Star Risk
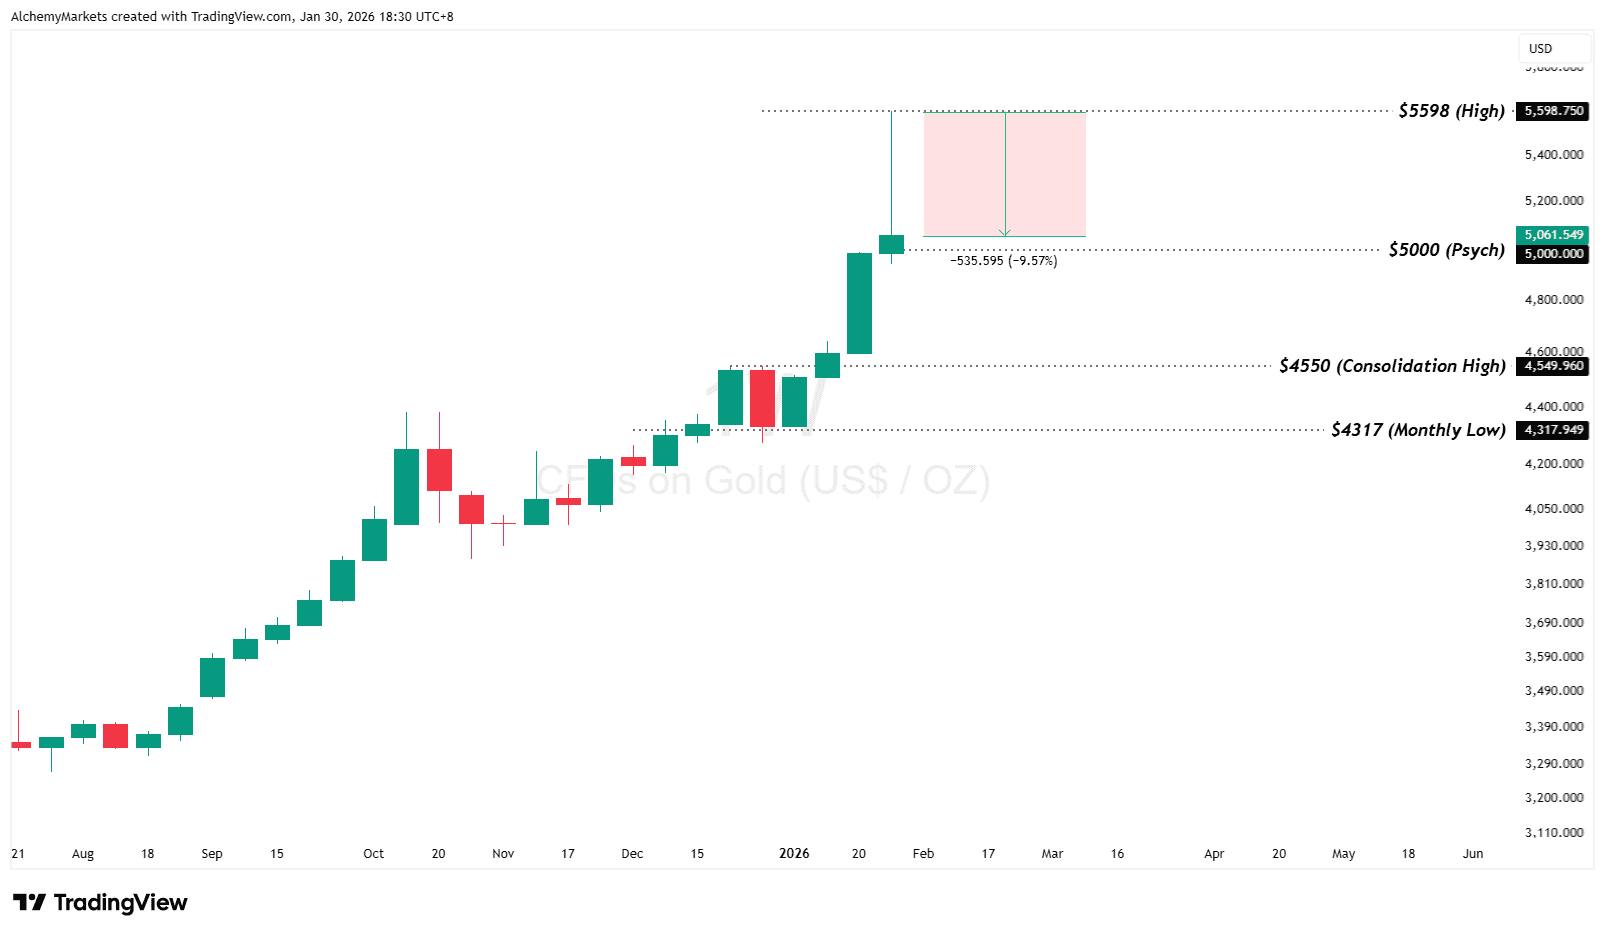
Gold is now threatening a weekly close with a 9 to 10% drop from its highs at $5,598; creating what’s known as a Shooting Star pattern.
This is a bearish reversal candlestick pattern. And following gold’s monthly candle signal, it only adds weight to the idea of a reversal.
As such, several key levels stand out, should Gold reverse:
- $5,000 would act as a key psychological resistance, if it is decisively lost.
- $4,550 acts as a potential support
- $4,317 is the ultimate support (monthly low), which determines if Gold can continue higher in the short term
But, pay mind that this is merely a signal based on past behaviours of Gold; and the past does not get replicated fully, but it often rhymes.