


Written by:

Reviewed by:


Bearish
Bullish
- January 26, 2026
- 26 min read
Break of Structure (BOS) Trading Guide
Have you ever wondered what really defines market structure?
Most traders view swing highs and lows as simple support and resistance, treating any move above or below them as a normal breakout. But this basic view misses the deeper message behind these moves.
This is where Smart Money Concept traders come in. They analyse how price behaves around these swings and what each reaction reveals about intent, using concepts like Break of Structure (BOS) and Change of Character (CHoCH) to read the market with greater precision.
In this guide, you’ll learn how to identify a valid BOS, explore a couple of strategies built around it, and trade confidently across markets using precise entries and smart confluence tools.
What Is a Break of Structure?
A Break of Structure (BOS) is a core component of Smart Money Concepts, and more broadly a key idea in price action trading.
It confirms continuation of the prevailing trend when price breaks a previous swing point. In simple terms, a BOS happens when price closes beyond the last swing high or low.
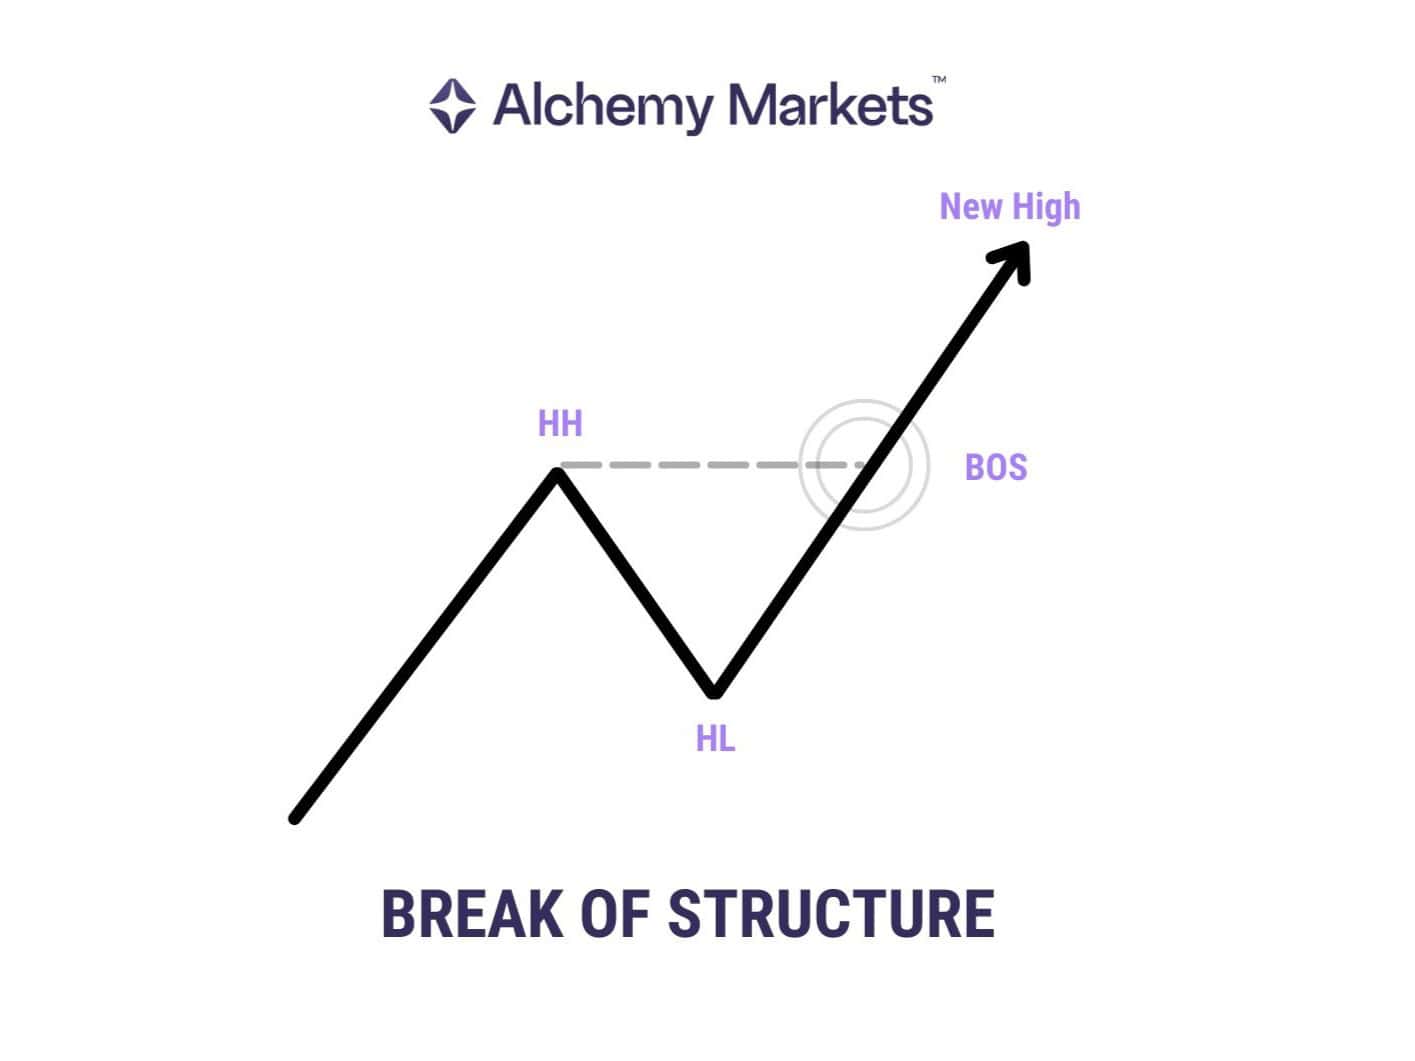
When price closes beyond a swing point and maintains momentum, it confirms that the current trend is continuing.
- In an uptrend, breaking a previous high signals bullish continuation.
- In a downtrend, closing below a recent low confirms further bearish pressure.
This helps traders understand how market prices are moving in any market, but is especially helpful in the Forex market, due to their high liquidity and thus more reliable BOS signals.
Understanding these structural concepts can help traders find more opportunities in forex trading and non-traditional markets. Let’s explore how you can apply BOS to your approach today.
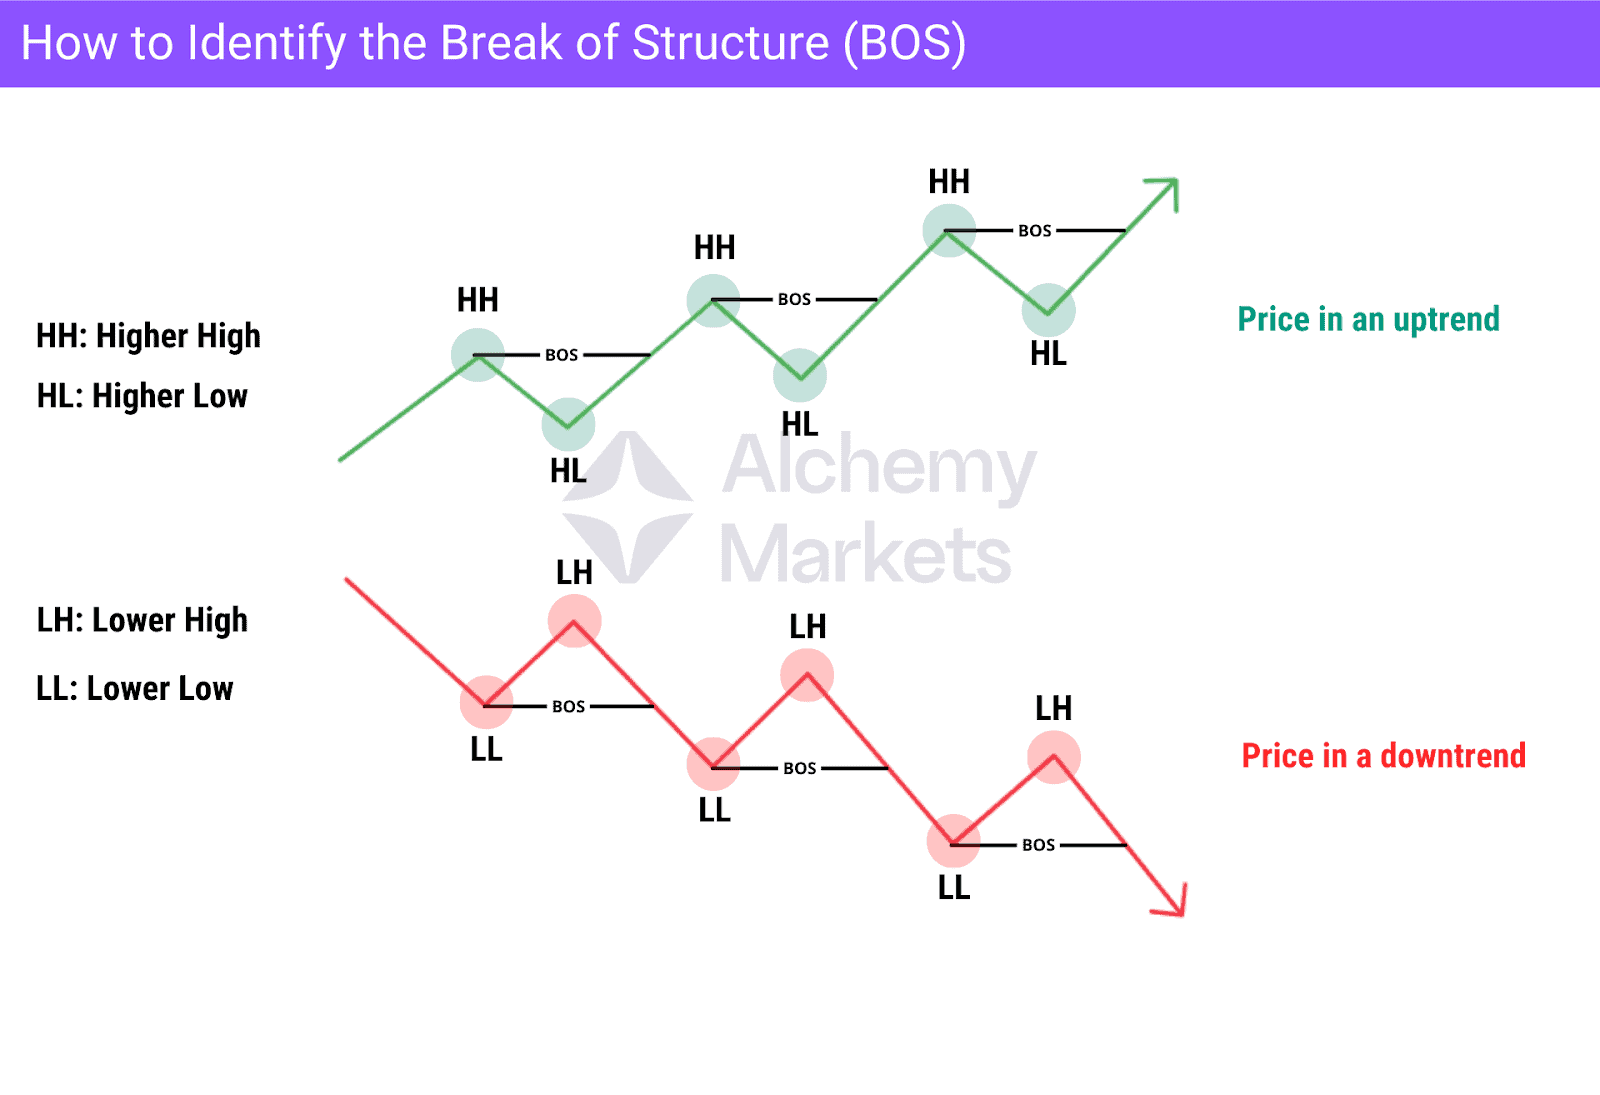
How to Identify the Break of Structure
To identify a Break of Structure, you must first understand swing points. A swing high is a short-term peak before price moves down, and a swing low is a short-term bottom before price moves up.
A combination of these swing points forms the market structure and defines the overall trend.
- In an uptrend, price forms higher highs (HH) and higher lows (HL).
- In a downtrend, it forms lower highs (LH) and lower lows (LL).
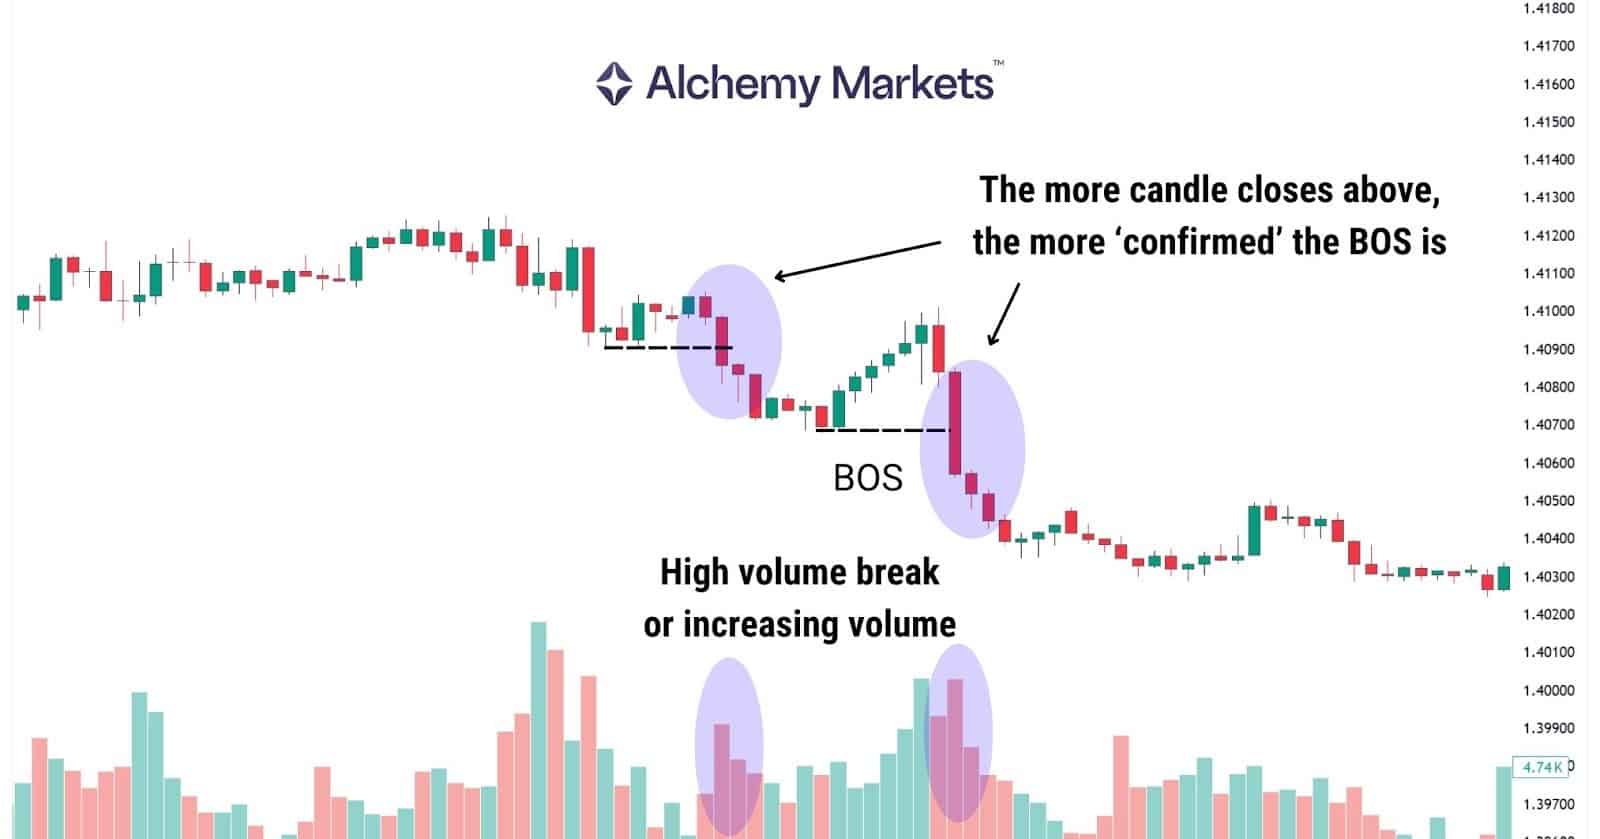
A BOS is confirmed when price breaks and closes beyond the most recent swing point in the direction of the existing trend. A wick close can still count as a BOS, but it is considered weaker than a full candle close beyond the level. For stronger confirmation, you may also look at volume. If volume spikes during the break, it is a strong sign that real participation supports the move.
Identifying Bullish BOS
A bullish BOS appears in an uptrend, where price consistently forms higher highs (HH) and higher lows (HL). This structure shows that buyers are controlling the market. A bullish BOS is confirmed when price breaks the most recent higher high and closes above it, showing that buyers are strong enough to continue the trend.
In a healthy bullish structure, impulsive moves upward are usually made of larger bullish candles, while the retracement phases are made of smaller bearish candles. This behaviour indicates strong demand and weaker selling pressure.
Bullish BOS highlights • Break above the latest higher high • A strong bullish candle close confirms continuation • Larger bullish candles in impulsive moves and smaller bearish candles in corrective moves |
Identifying Bearish BOS
A bearish BOS appears in a downtrend, where price forms lower highs (LH) and lower lows (LL). This shows that sellers are maintaining control. A bearish BOS is confirmed when price breaks the most recent lower low and closes below it with a clean candle, proving that sellers have enough strength to drive the trend further.
In a healthy bearish structure, impulsive moves downward are typically made of larger bearish candles, while retracements form smaller bullish candles. This signals strong selling pressure and weaker buying momentum.
Bearish BOS highlights • Break below the latest lower low • A strong bearish candle close confirms continuation • Larger bearish candles in impulsive moves and smaller bullish candles in corrective moves |
How Does Break of Structure Trading Work?
You can use a BOS in several different ways and for different purposes depending on your trading style.
Breakout Trades
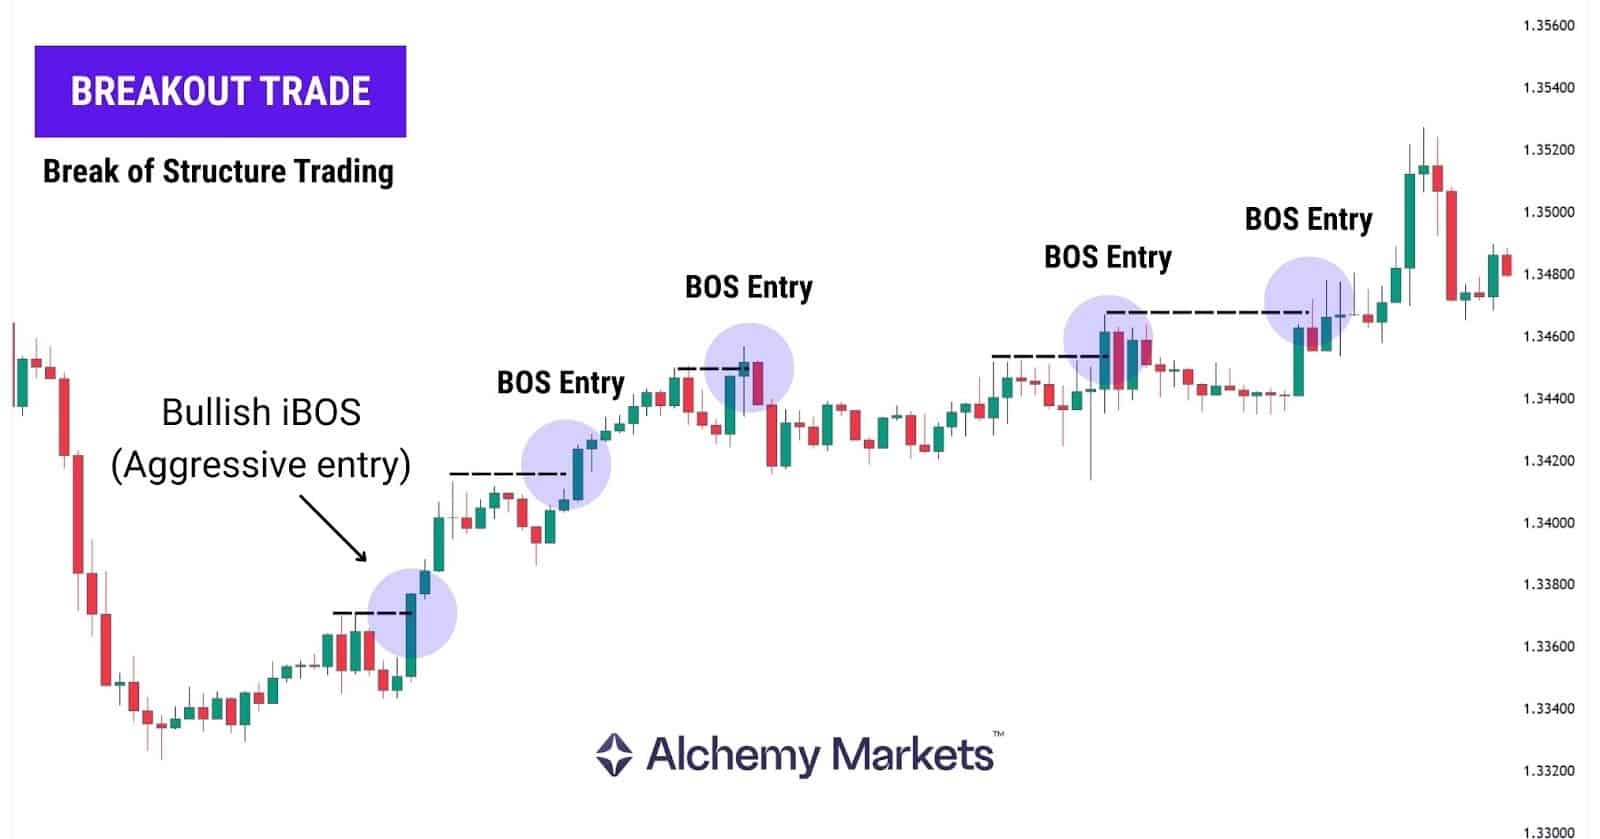
Breakout traders use it as an entry trigger, entering when price breaks a swing high (HH) or swing low (LL). Some enter immediately on the breakout, while others prefer waiting for price to retest the broken level before getting in.
Trend-Following Trades
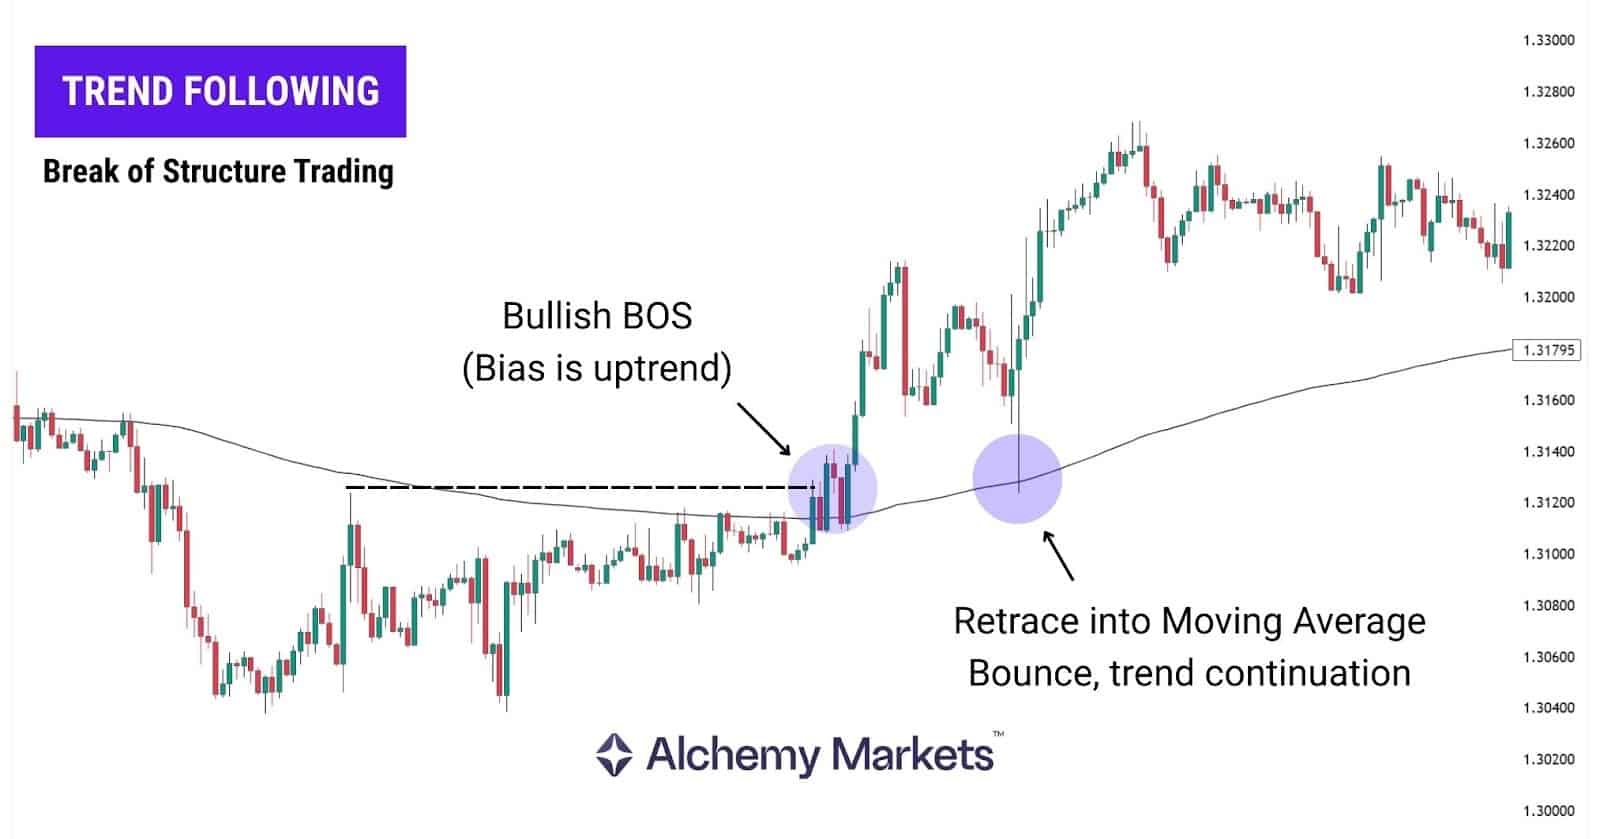
Other traders use BOS to follow the trend more effectively, especially trend-following traders.
They wait for each new BOS to form, enter on the pullback, and remain in the trade as long as price continues breaking structure in the same direction.
BOS as a Confirmation
Some traders don’t use BOS as an entry signal. Instead, they use it to confirm the current market trend or add confirmation to an entry idea, especially when combined with CHoCH and other analysis, helping them align whatever strategy they use with the dominant trend direction.
BOS with Fibonacci Levels
BOS can be combined with Fibonacci retracements to identify pullback areas. Traders draw the retracement between the swing low and swing high (or the opposite in a downtrend) and wait for price to return to key levels like 50%, 61.8%, or 78.6%. They enter with candlestick confirmation and target the next swing high or swing low based on the trend.
The Three Stages in BOS
A valid Break of Structure always unfolds through three objective stages. These stages help traders read market behaviour clearly, identify the trend, and avoid confusing noise with genuine market moves.
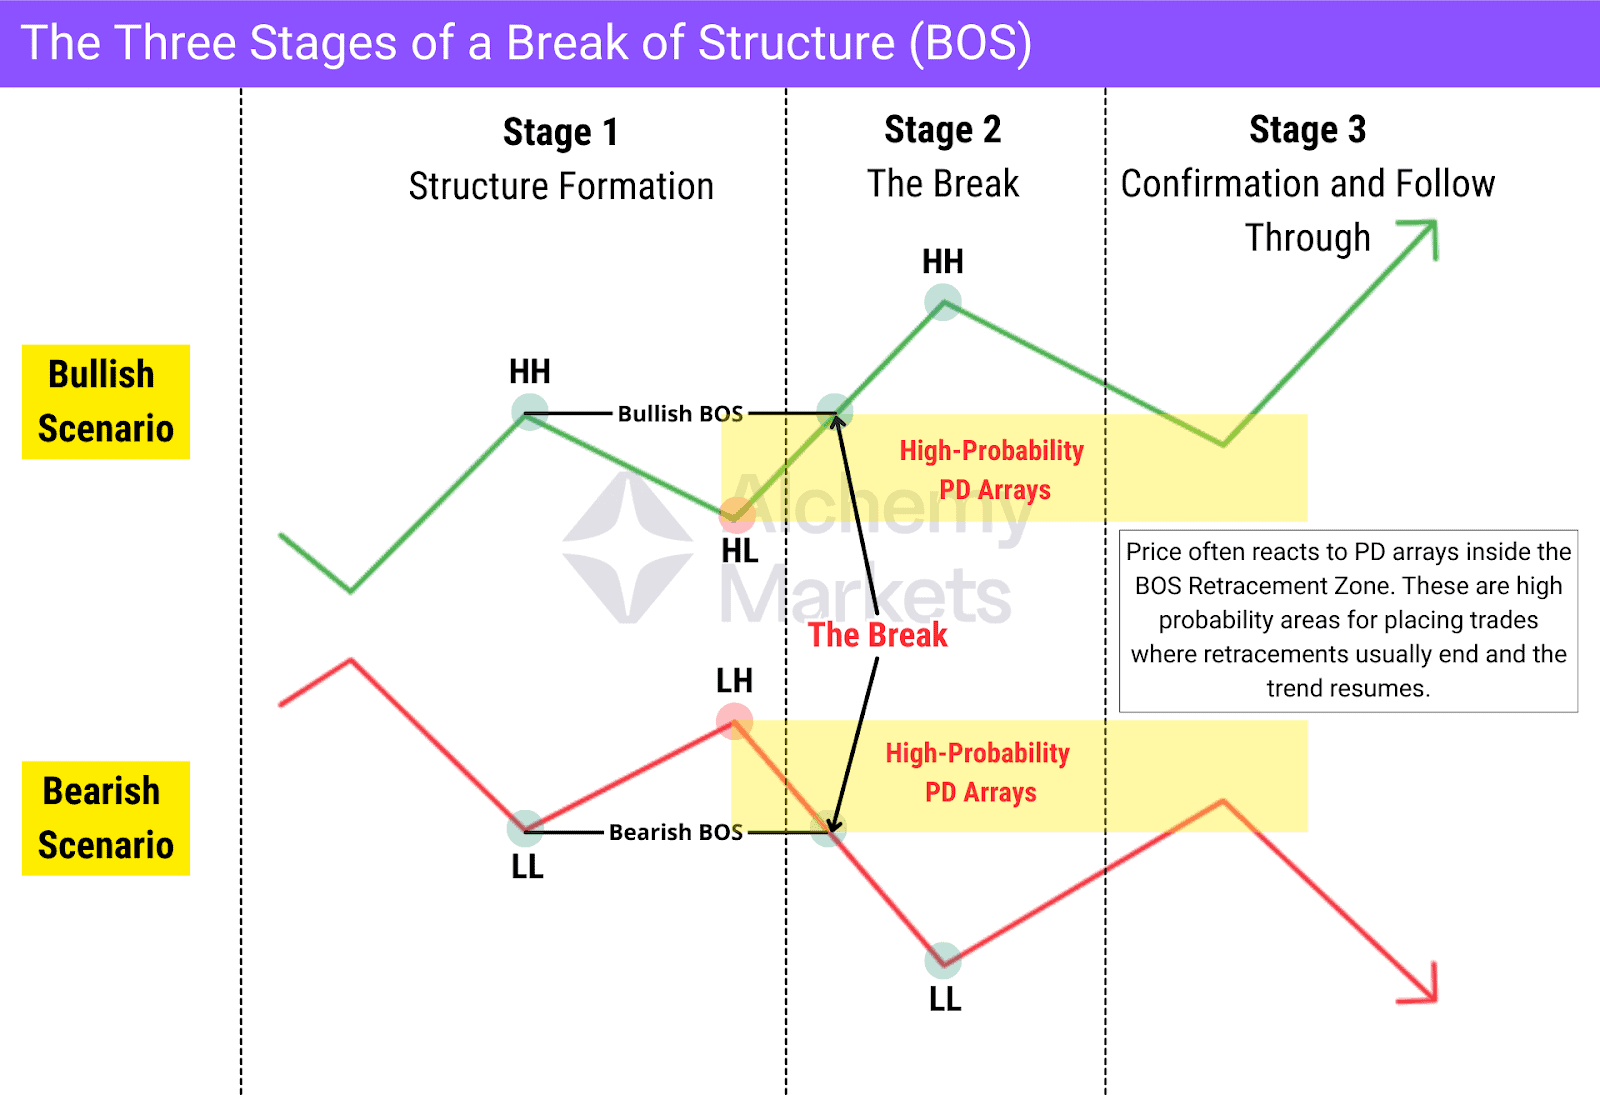
Stage 1 – Structure Formation
In a bullish trend, price forms a clear sequence of swing points. It first creates a higher high, then pulls back to form a higher low. This higher low is not confirmed as a strong swing point until price breaks above the previous higher high.
For a bearish scenario, the logic is the opposite. Price forms a lower low, retraces to form a lower high, and this lower high is not confirmed as a strong swing point until price breaks below the previous lower low.
Stage 2 – The Break
Once the pullback ends, price moves back in the direction of the trend. In a bullish scenario, a Break of Structure is confirmed when price breaks the previous higher high with a full candle close above it. A wick is not enough. Strong volume adds extra confirmation. This validates the higher low as a strong swing point, signals bullish continuation, and creates a new higher high.
In a bearish scenario, the same logic applies in reverse. Price closes below the previous lower low, ideally with strong volume, confirming the lower high as a strong swing point and signalling bearish continuation.
A clean BOS typically shows:
• Strong candle close
• Clear displacement
• Increased volume
Essentially, a BOS must be a decisive impulsive move with a proper higher high. Without displacement, it’s likely just a liquidity sweep or a weak breakout.
This behaviour reflects active order flow supporting the trend.
Stage 3 – Confirmation and Follow-Through
Once the BOS occurs, traders look for confirmation through precise retracement behaviour. The most common forms include:
- Retest of the broken level
- Retracement into 50% of the first displacement for better precision
- Pullbacks into PD arrays such as fair value gaps, order blocks, or breaker blocks
- Confirmation entries using candlestick patterns or supporting indicators
At this point, the validated swing low becomes a protective structure point within the bullish market trend. As long as this level holds, the market behaviour typically supports potential trend continuation.
However, if this strong point breaks later, it may signal significant market shifts such as a CHoCH, indicating a potential shift into bearish structure.
Note: PD arrays are points of interest where price is more likely to react. They include areas such as order blocks, breaker blocks, Fair Value Gaps, and inversion fair value gaps. PD arrays that form inside the BOS Retracement Zone, which is the area around the break point, are significantly more reliable. Traders often wait for price to retrace into these areas before placing trades, as they commonly act as strong reaction points during a retest after a BOS. |
Volume: The Silent Validator
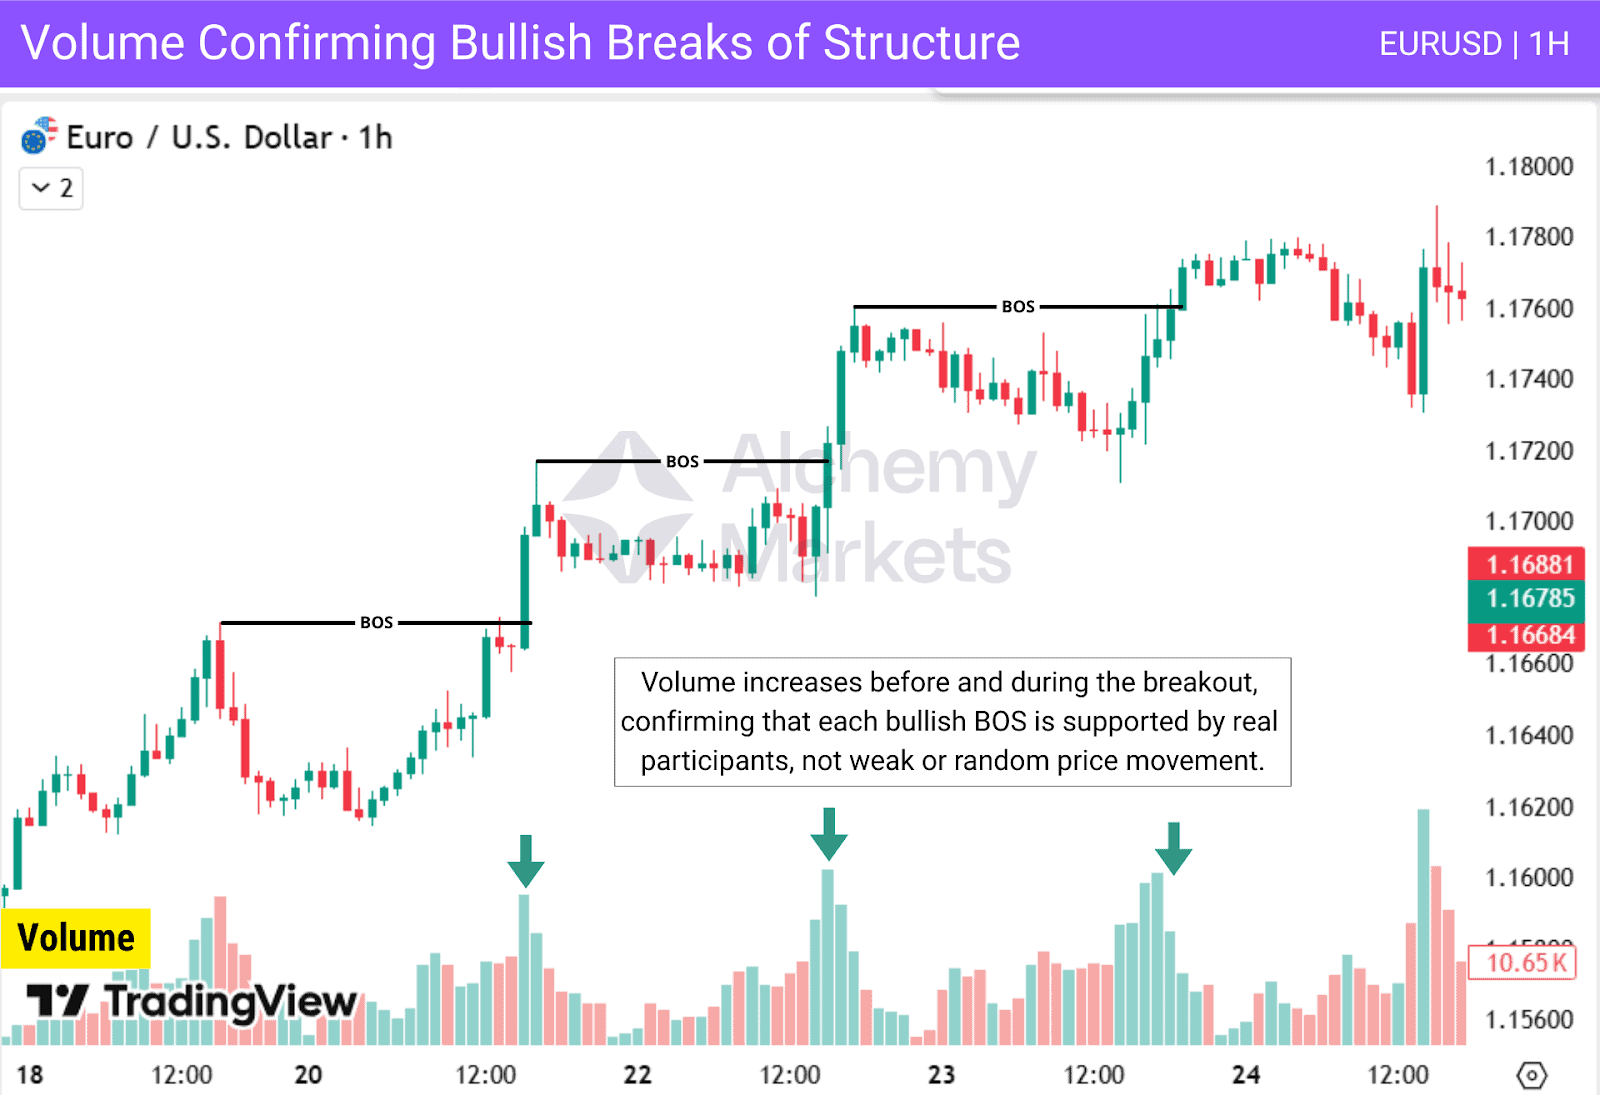
Volume is the often-overlooked element that gives context to every Break of Structure. A break without volume is like a promise without proof, it may look convincing, but it lacks real backing. When volume expands during a break, it signals strong participation from institutions and validates the move.
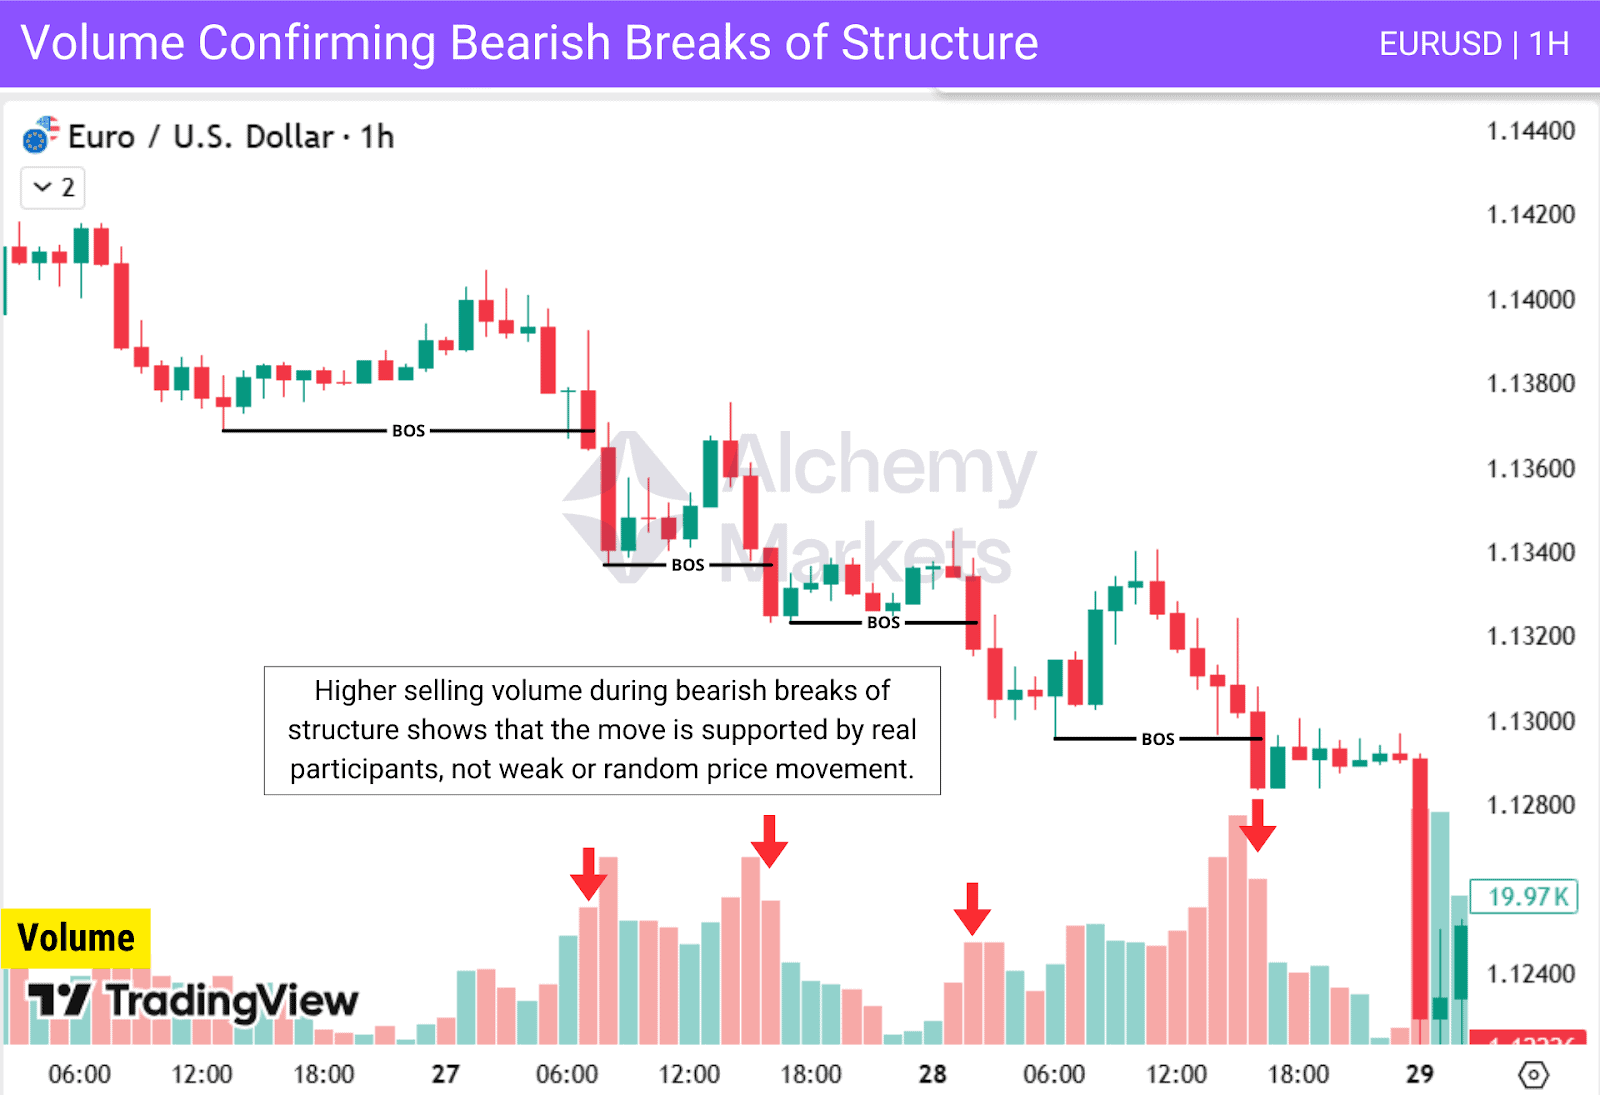
In a bullish BOS, increasing volume on the breakout shows genuine demand. In a bearish BOS, high selling volume confirms that large players are driving the move, not retail noise. Low volume breaks tend to fade quickly, trapping traders who react too soon.
Bullish BOS Example
A chart showing how strong buying volume confirms bullish BOS:
Bearish BOS Example
A chart showing how strong selling volume confirms bearish BOS:
Volume also helps traders distinguish continuation from exhaustion. If volume spikes at the initial break but fades immediately after, it could signal a short-lived move or even a liquidity grab. Consistent volume through the retest and follow-through, however, suggests that the trend has real strength behind it.
Ways to use volume with BOS:
- Confirm momentum during structure breaks.
- Identify fakeouts when volume fails to increase.
- Support trade entries by matching volume surges with strong candle closes.
What Does a Break of Structure Tell You
A Break of Structure shows which side currently controls the market, whether buyers or sellers. A BOS can confirm two scenarios:
Continuation of the current trend:
When price repeatedly breaks structure in the same direction, it signals that the dominant side is still in control. This movement reflects strong participation behind it and suggests that price is likely to continue with the dominant trend.
Validation of a new trend reversal after a CHoCH:
A CHoCH is the first indication that the trend may be shifting, but it only warns of a possible reversal. The trend is considered truly changed once a BOS forms directly after the CHoCH in the opposite direction, confirming that control has transferred from buyers to sellers or from sellers to buyers.
This clarity allows traders to align their trades with the dominant trend, avoid false signals, and make decisions based on structure and logic rather than emotion.
The Theory Behind the Break of Structure (BOS)
The theory behind BOS comes from Wyckoff’s market cycle, where price moves from accumulation into expansion. After accumulation, institutions complete their positioning and price often breaks the most recent swing point inside the range. This initial break is fuelled by liquidity around swing highs and lows and marks the beginning of a new directional phase.
Over time, this idea became a core pillar of the modern Smart Money Concept. In SMC, BOS is used to define market structure, identify trend direction, and confirm continuation phases.
What Is the Importance of Break of Structure?
Break of Structure is crucial because it offers an objective way to read trend direction. Consistent breaks of highs in an uptrend or lows in a downtrend confirm continuation and help traders stay aligned with the dominant flow. Instead of guessing, traders can clearly identify whether the trend is healthy or starting to weaken based on how BOS behaves.
BOS also sharpens execution. Once a structural level breaks with conviction, traders can focus on entries that respect the trend, such as retracements, retests or reactions around the broken level. This reduces noise, filters low-quality setups and encourages disciplined, structure-based trading.
Why BOS matters
- Defines the prevailing trend through clear structural shifts
- Aligns entries with the side actively driving the market
- Supports consistent, confident decision-making across all markets and timeframes
Used correctly, BOS becomes the backbone of a structure-based trading strategy – a repeatable way to time entries and exits instead of guessing where the market will turn.
Break of Structure Example
Let’s take a practical example to see BOS in action:
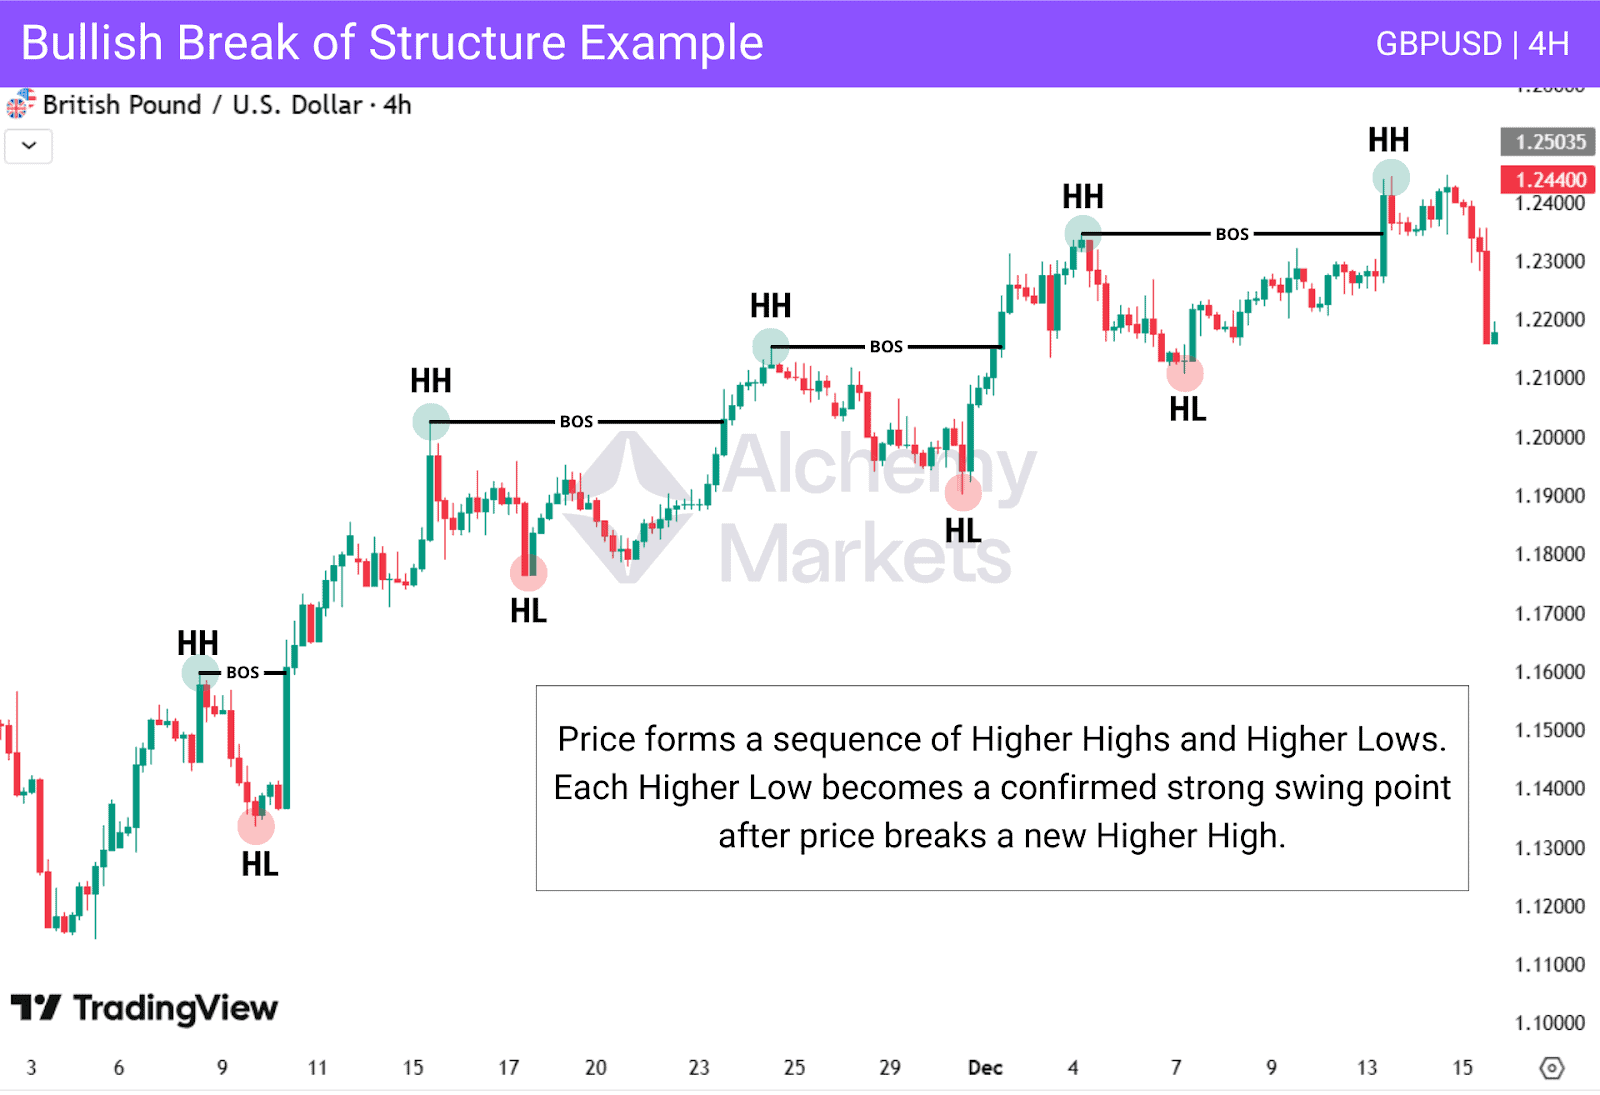
The chart illustrates a classic bullish sequence where price continues breaking previous highs, confirming that buyers remain in control. Each break of structure reinforces the uptrend and shows that demand is strong enough to push prices higher. As this happens, price forms a series of Higher Lows, which act as the key structural points supporting the trend.
These Higher Lows are important because they represent the areas where buyers consistently step in. As long as these levels remain intact, the bullish structure stays healthy. However, if price ever breaks below a confirmed Higher Low, it signals a potential Change of Character (CHoCH). That break would indicate that sellers are gaining strength and the trend may be shifting into a bearish phase.
This makes Higher Lows essential reference points for identifying both trend continuation and early signs of reversal.
Types of Break of Structure
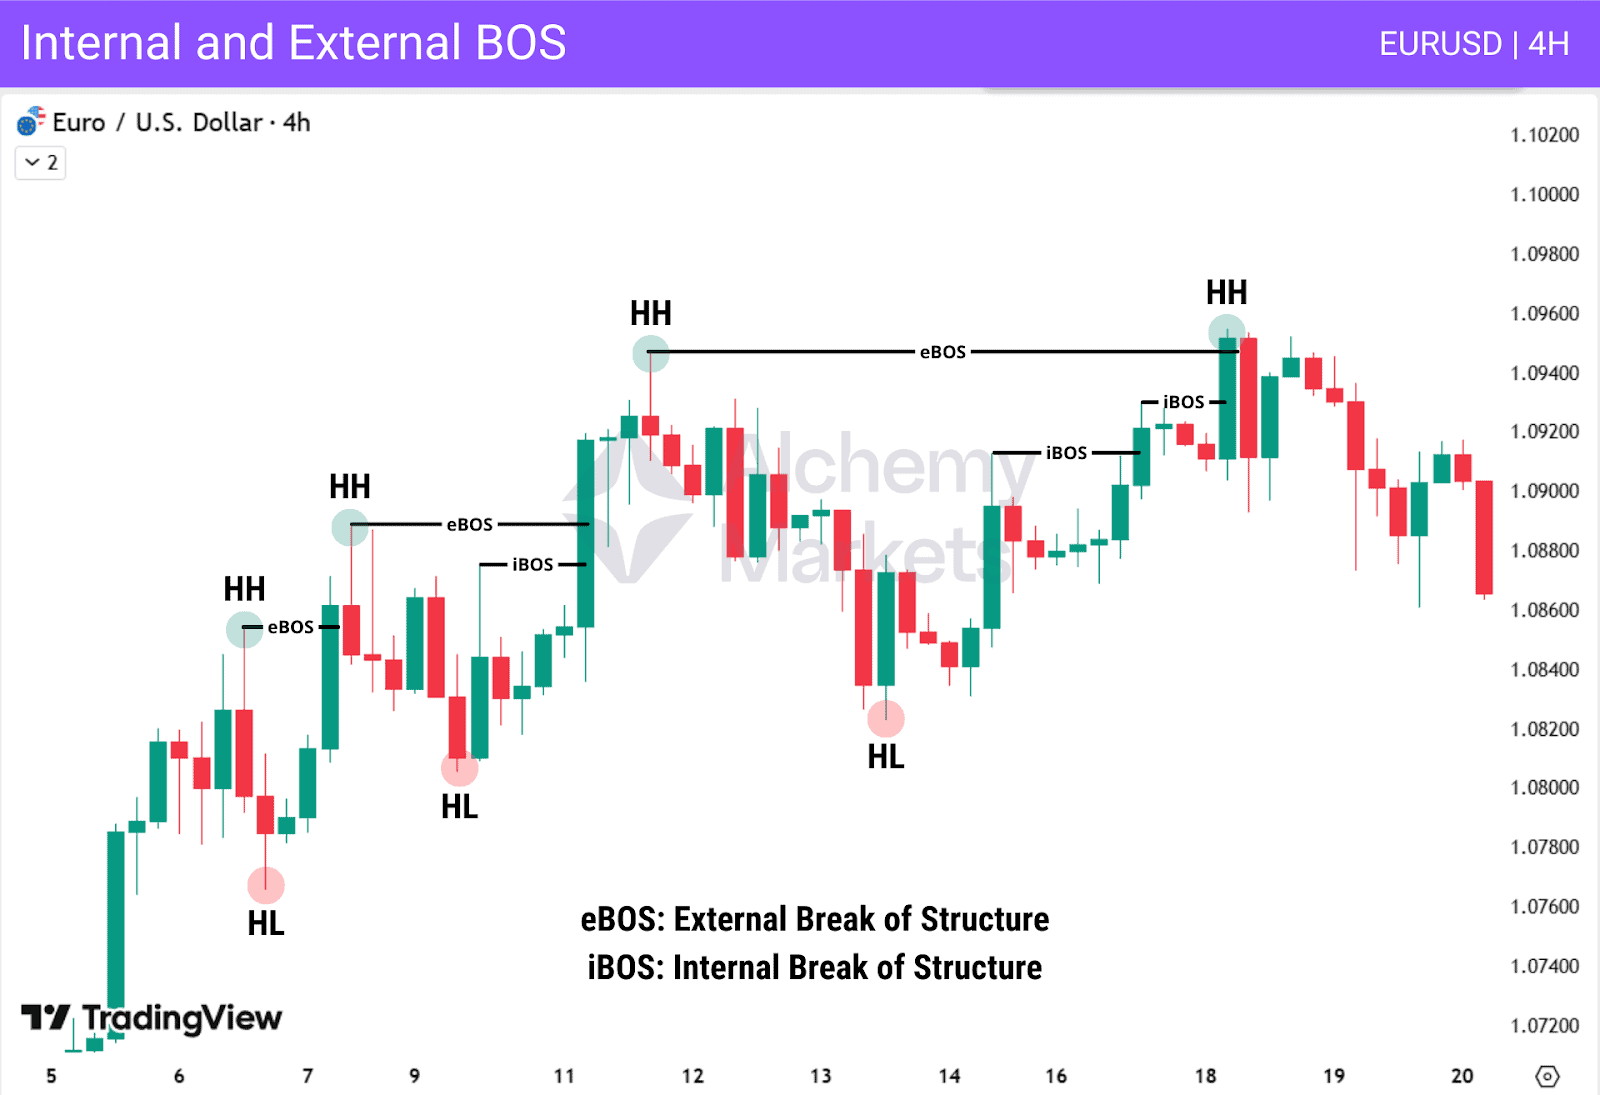
External BOS: Breaks major swing highs or lows and defines the true market direction. Traders use external BOS to confirm the overall trend and validate key swing points.
Internal BOS: Occurs inside the larger external structure and reflects smaller fluctuations. Internal BOS is mainly used to confirm entries and spot early signals of price movements.
Break of Structure Trading Strategies
Due to its simple nature, the Break of Structure (BOS) concept can be applied on almost any strategy or with any indicator.
In this section you’ll see several BOS trading strategies that combine Break of Structure with tools like CHoCH, Fibonacci, RSI, MACD and session timing. Each BOS trading setup gives you clear entry and exit points within a consistent market structure trading framework
The most practical component of a BOS is its use as a trend filter or as a trend confirmation tool (see CHoCH strategy).
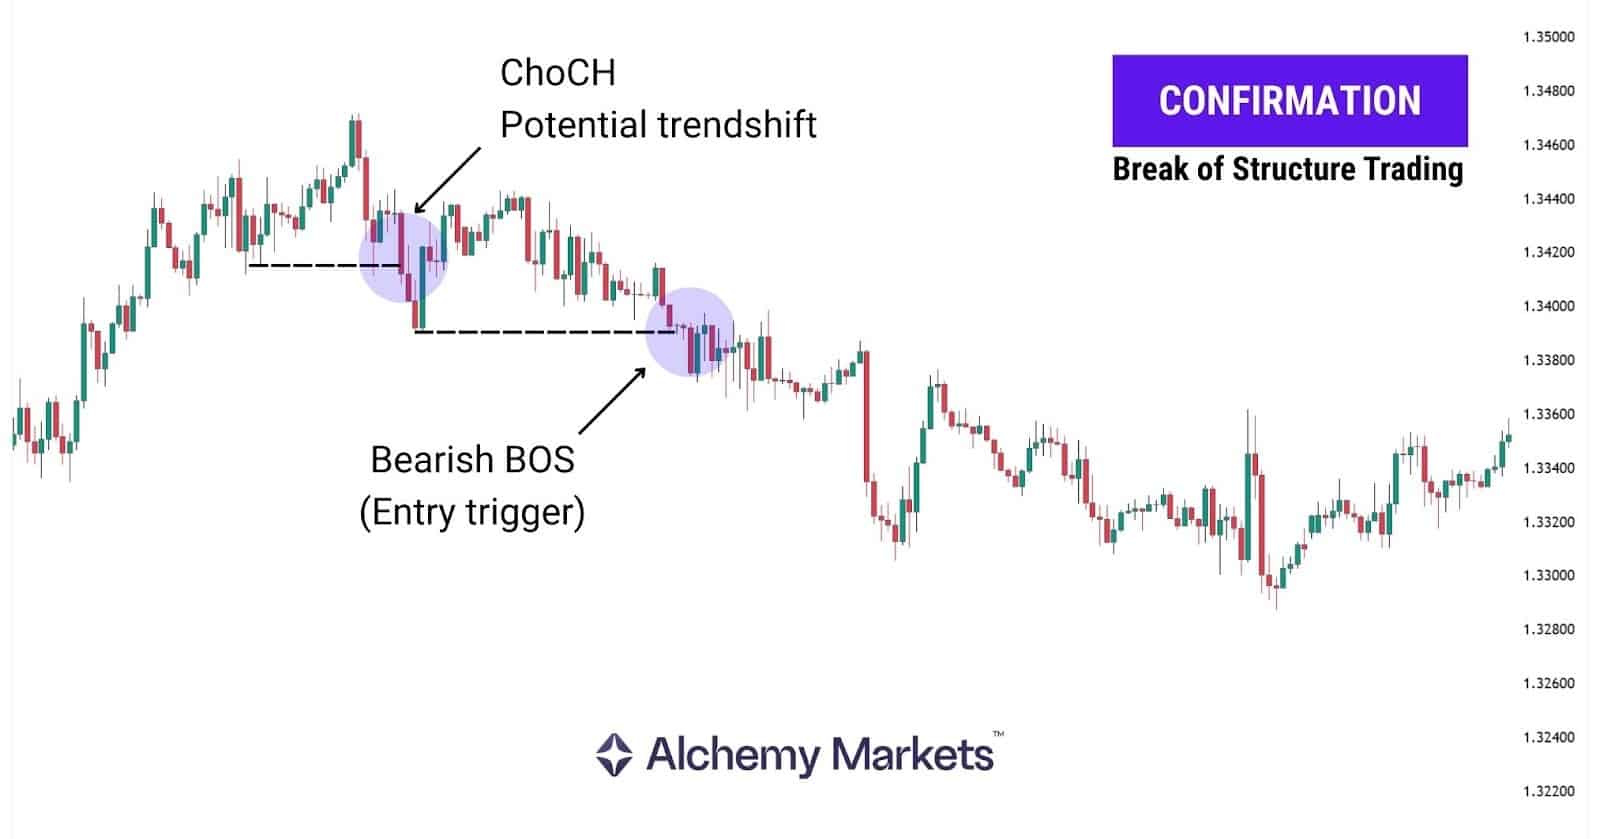
Break of Structure with Change of Character (CHoCH)
BOS aligned with CHoCH is a powerful combination because it filters out weak reversals and highlights high-probability ones. The approach begins by identifying the current trend, whether price is forming consecutive BOS in an uptrend or a downtrend.
The direction does not matter; what matters is recognising the existing structure.
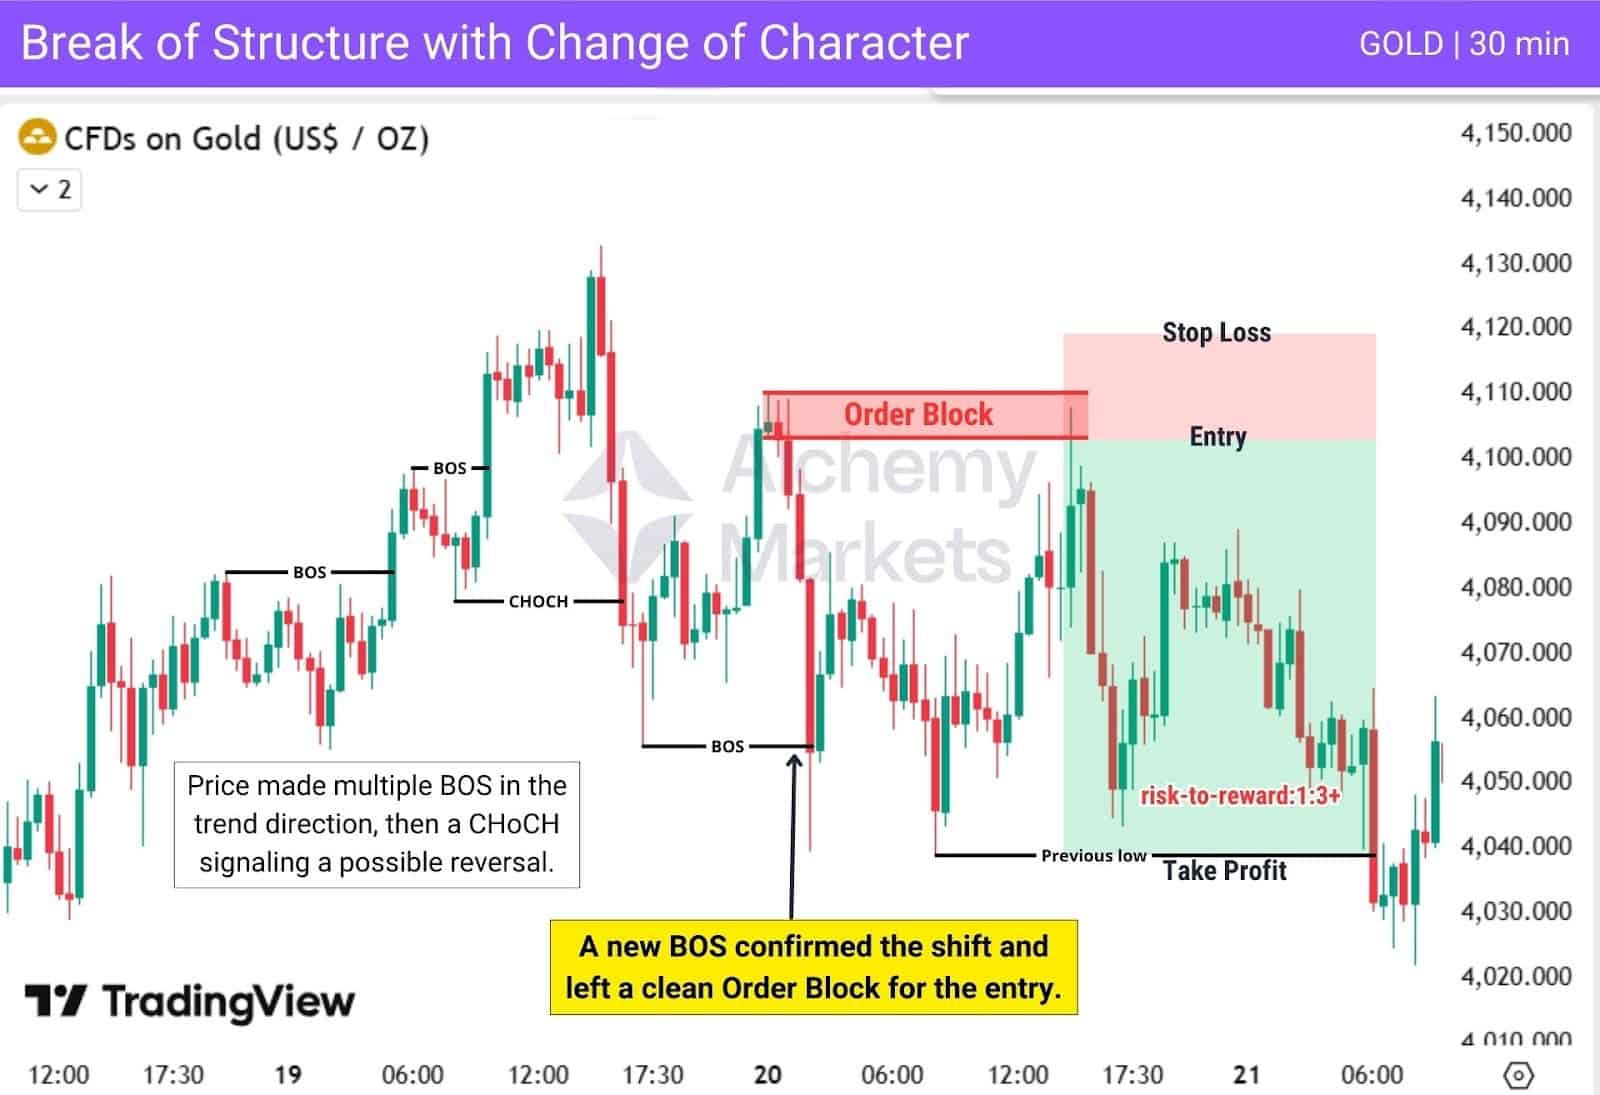
Price was in an uptrend, forming multiple BOS in the same direction. The first sign of a potential reversal appears when price breaks the most recent higher low, creating a CHoCH. This signals that price may be ready to reverse.
The reversal is then confirmed when price forms a new BOS in the opposite direction. This confirmation BOS creates a clean Order Block. Price later returns to this Order Block, offering a high-probability entry.
| Entry: On the retest of the Order Block formed during the confirmation BOS. |
| Stop Loss: Placed above the Order Block, using it as the invalidation area. |
| Take Profit: At the recent swing low. |
Break of Structure with Change of Character Plus (CHoCH+)
CHoCH+ is a stronger version of a regular CHoCH. Instead of shifting direction after one break of structure, CHoCH+ requires price to fail to form a new higher high (HH) or lower low (LL) before breaking structure in the opposite direction. This failure shows a clear weakening in the current trend, making the reversal more reliable.
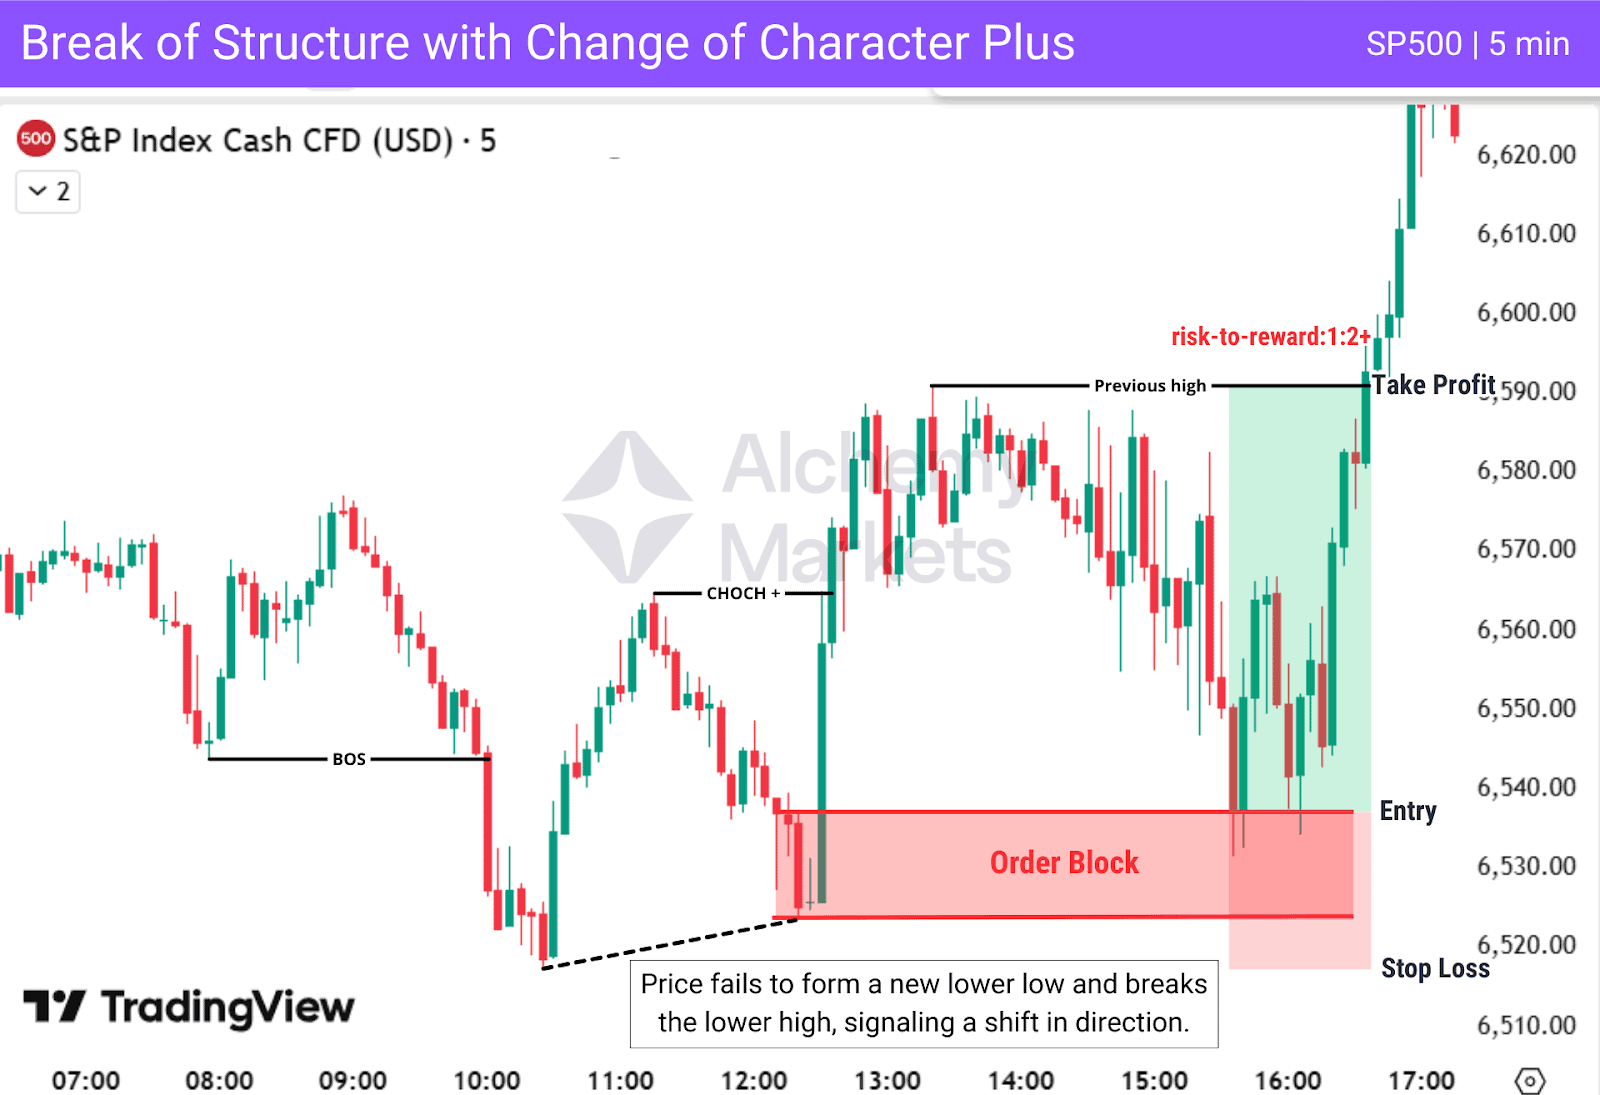
In this chart example, price is in a downtrend. It attempts to create a new lower low but fails, showing that sellers are losing momentum. Immediately after, price breaks the previous lower high, forming the CHoCH+. This confirms the bullish shift and leaves behind a clean Order Block for the entry.
| Entry: On the retest of the bullish Order Block created during the CHOCH+. |
| Stop Loss: Below the Order Block, using it as the invalidation level. |
| Take Profit: At the recent swing high. |
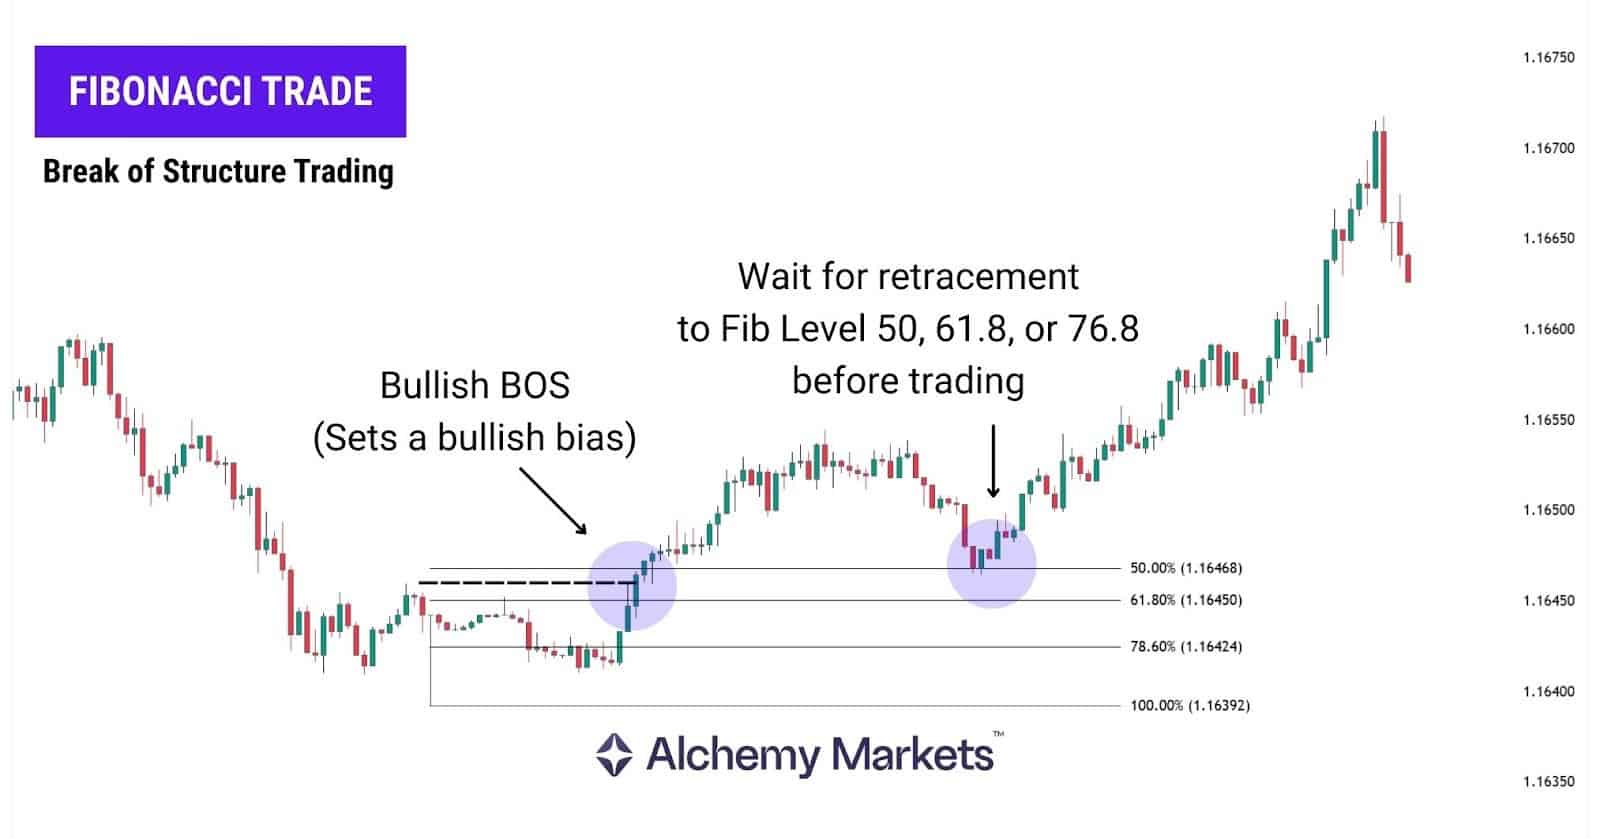
Break of Structure with Fibonacci Retracement
After a confirmed BOS, Fibonacci retracement helps identify high-probability setups aligned with the dominant trend inside the new impulse leg. It provides levels showing where price may retrace before continuing in the overall direction.
In bullish setups, Fibonacci is drawn from the swing low to the swing high. In bearish setups, from the swing high to the swing low.
The most commonly watched levels are 38.2, 50, 61.8, and 78.6 percentages. Forex traders often use Fib levels to catch continuation moves, especially if a strong candlestick occurs.
In SMC trading, which is where BOS originates from, traders like to watch the Deep Retracement Zone between 0.618 to 0.786 for a retracement pivot. This zone is especially effective when it overlaps with Order Blocks, Fair Value Gaps, or PD arrays.
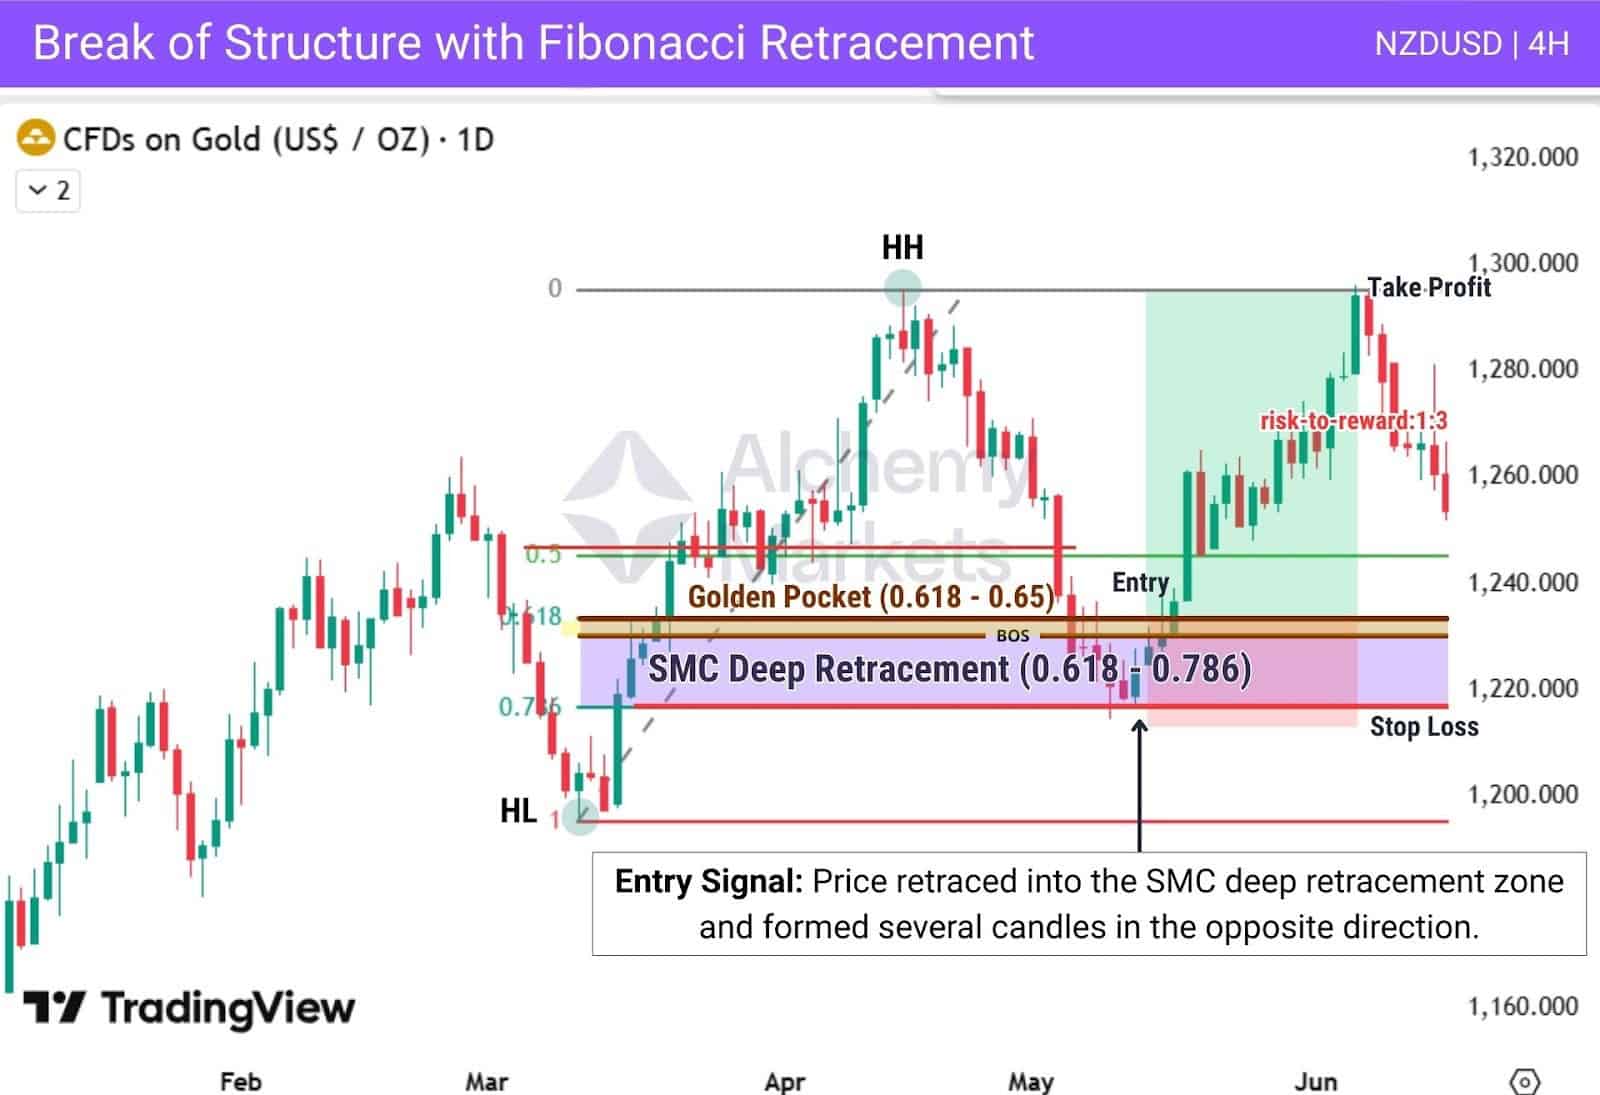
In this chart example, price forms a BOS to the upside, confirming a bullish trend.
After drawing the Fibonacci retracement from the swing low (HL) to the swing high (HH), price retraces into the SMC deep retracement zone. It’s only when the price reverses beyond 0.618, that we consider the pivot reaction to be strong enough for a trade.
| Entry: When price retraces into the 0.618–0.786 zone and reverses from it by forming opposite-direction candles.Aggressive entry is to wait for a strong candlestick at 0.786.The safest entry is to wait for price to reclaim the 0.618 level. |
| Stop Loss: Just below the 0.786 level. |
| Take Profit: Target the recent higher high, or use Fibonacci extensions for additional targets. |
| Note: Outside of Smart Money Concepts, traders commonly watch the Golden Pocket zone which sits at the 0.618 – 0.65 levels. |
Break of Structure with RSI
The Relative Strength Index indicator, or the RSI, helps confirm momentum and can be used in multiple ways ways within a Break of Structure setup:
RSI as Confirmation: After a BOS and a retracement into a PD array, RSI can be used as confirmation.
In a bullish setup, RSI rising above 50 supports upward momentum; in a bearish setup, RSI falling below 50 confirms bearish momentum.
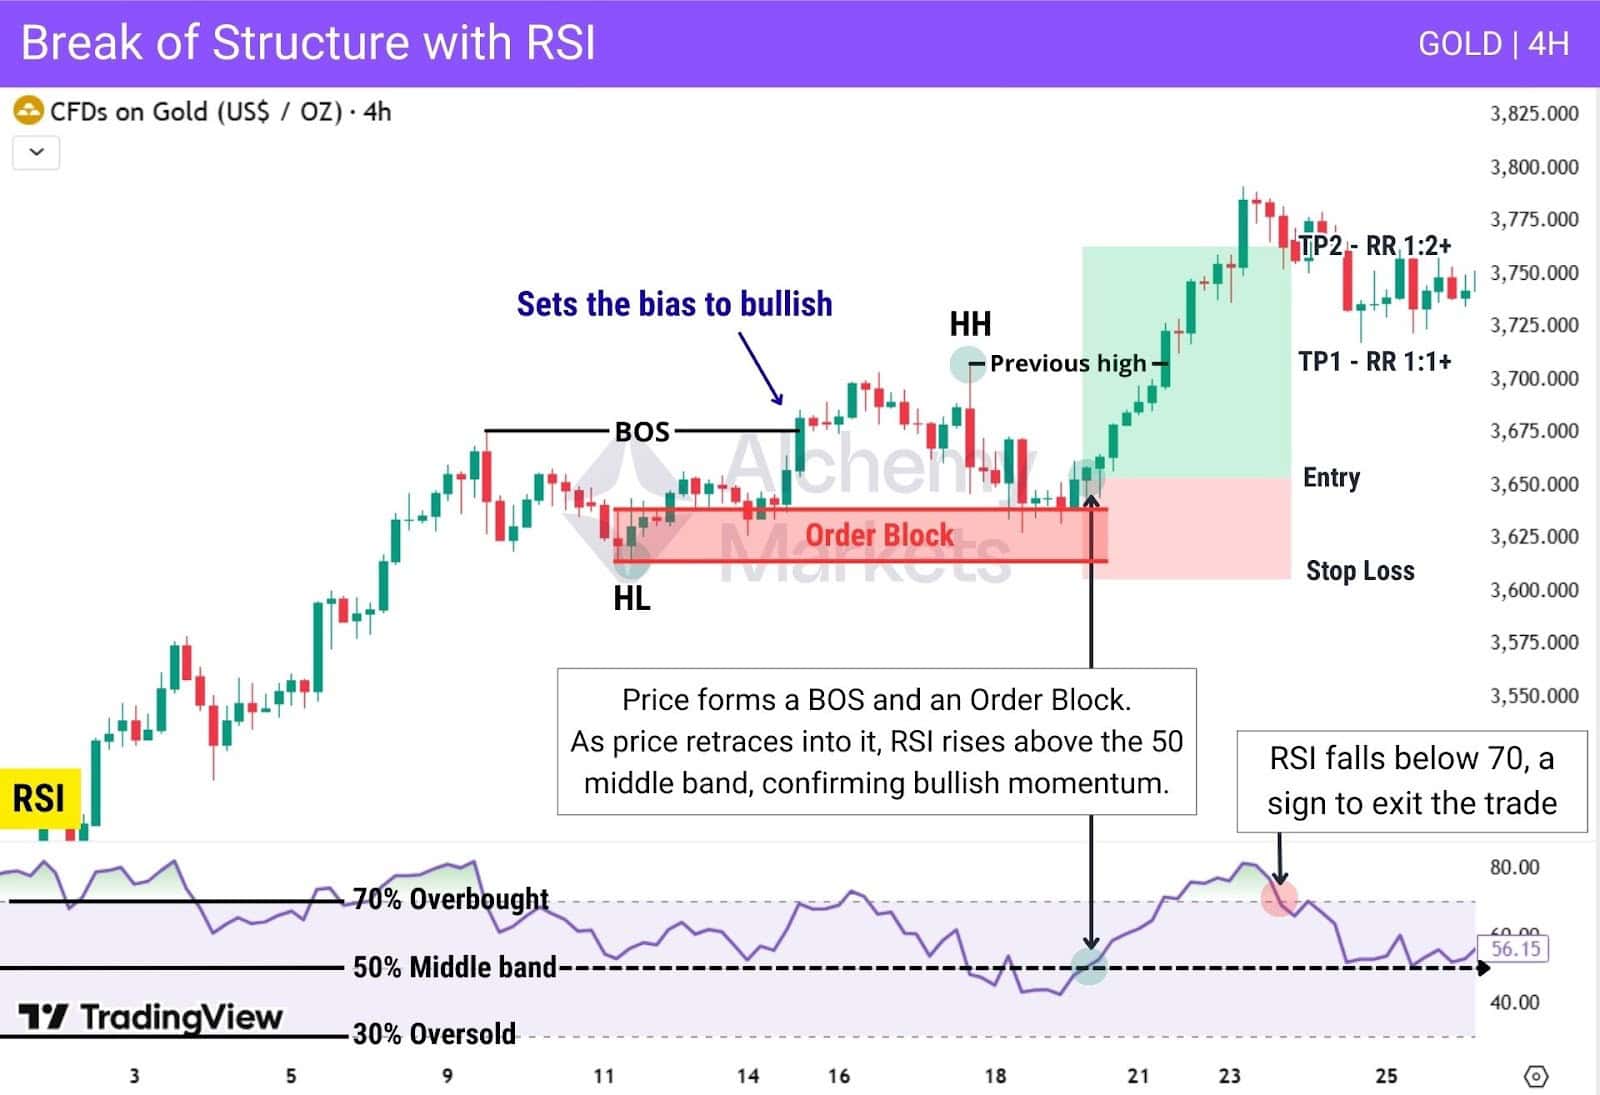
After pivoting from a higher low, price forms a higher high, which confirms a bullish BOS in the process. This sets our trading bias as bullish, looking for long positions only.
As the market pulls back, it reacts cleanly to the Order Block created at that prior swing low, bouncing off and creating another new high.
Meanwhile, the RSI rises above the 50 middle band, confirming renewed bullish momentum, which gives us an entry trigger.
| Entry: Enter after price retraces into an Order Block or another PD array, reacts to it, and RSI rises above the 50 middle band, confirming bullish momentum and that the pullback has ended. |
| Stop Loss: Below the Order Block (invalidation point). |
| Take Profit: Target the previous high created by the BOS, or exit when RSI rejects from the 70 overbought level, signalling weakening momentum. |
Break of Structure with MACD
Combining BOS with MACD helps confirm trend direction and provides precise continuation entries.
MACD divergence highlights when a pullback is losing strength, warning that the retracement is close to ending. MACD crossovers confirm when momentum has shifted back in line with the BOS direction, giving the entry trigger.
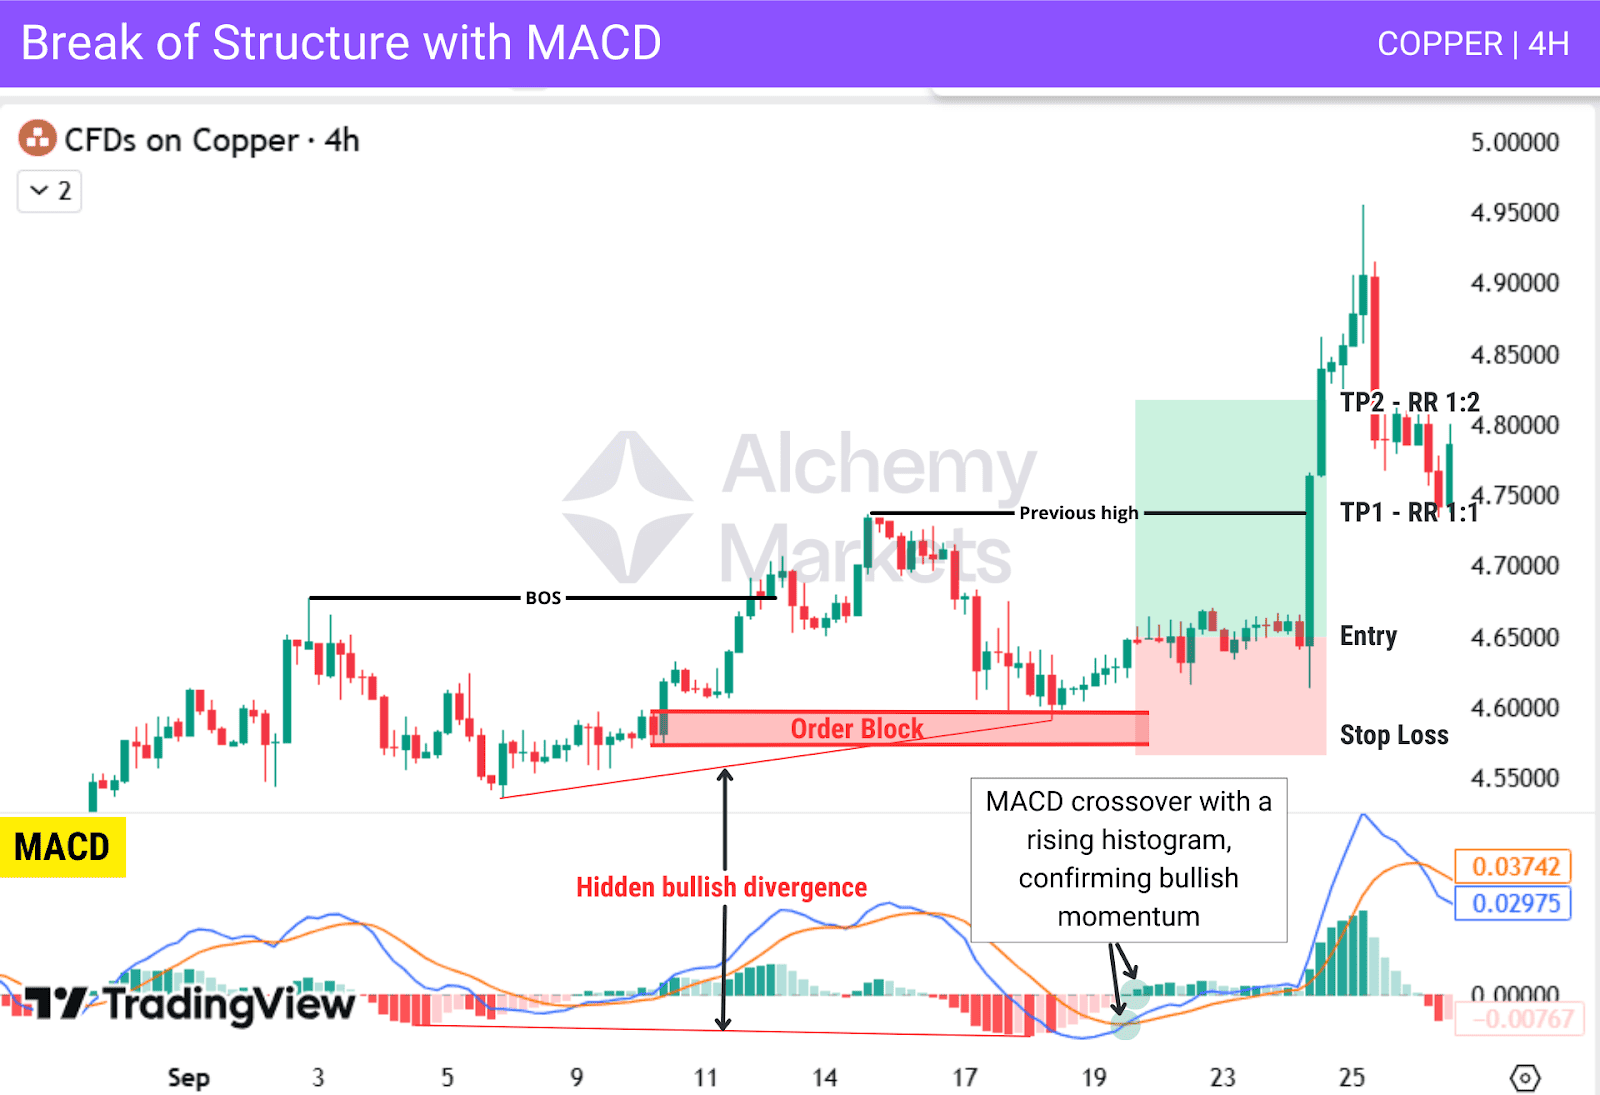
In this example, price forms a bullish BOS and creates an Order Block. Price retraces into the Order Block while MACD shows hidden bullish divergence, signalling continuation. After the reaction from the Order Block, a MACD bullish crossover with a rising histogram confirms strong bullish momentum.
| Entry: After price rejects from the Order Block (or another PD array) and MACD forms a bullish crossover with a rising histogram. |
| Stop Loss: Below the Order Block. |
| Take Profit: Target the previous swing high for the first TP, then aim for at least a 1:2 risk-to-reward for the next target, or exit when MACD momentum begins to weaken. |
Break of Structure with Moving Averages
The 50 Exponential Moving Average (EMA) acts as a simple trend filter, and combining it with a Break of Structure helps find continuation setups aligned with the dominant trend. After a BOS, a retracement into the EMA followed by rejection often signals that the pullback is ending and price is ready to continue with the trend.
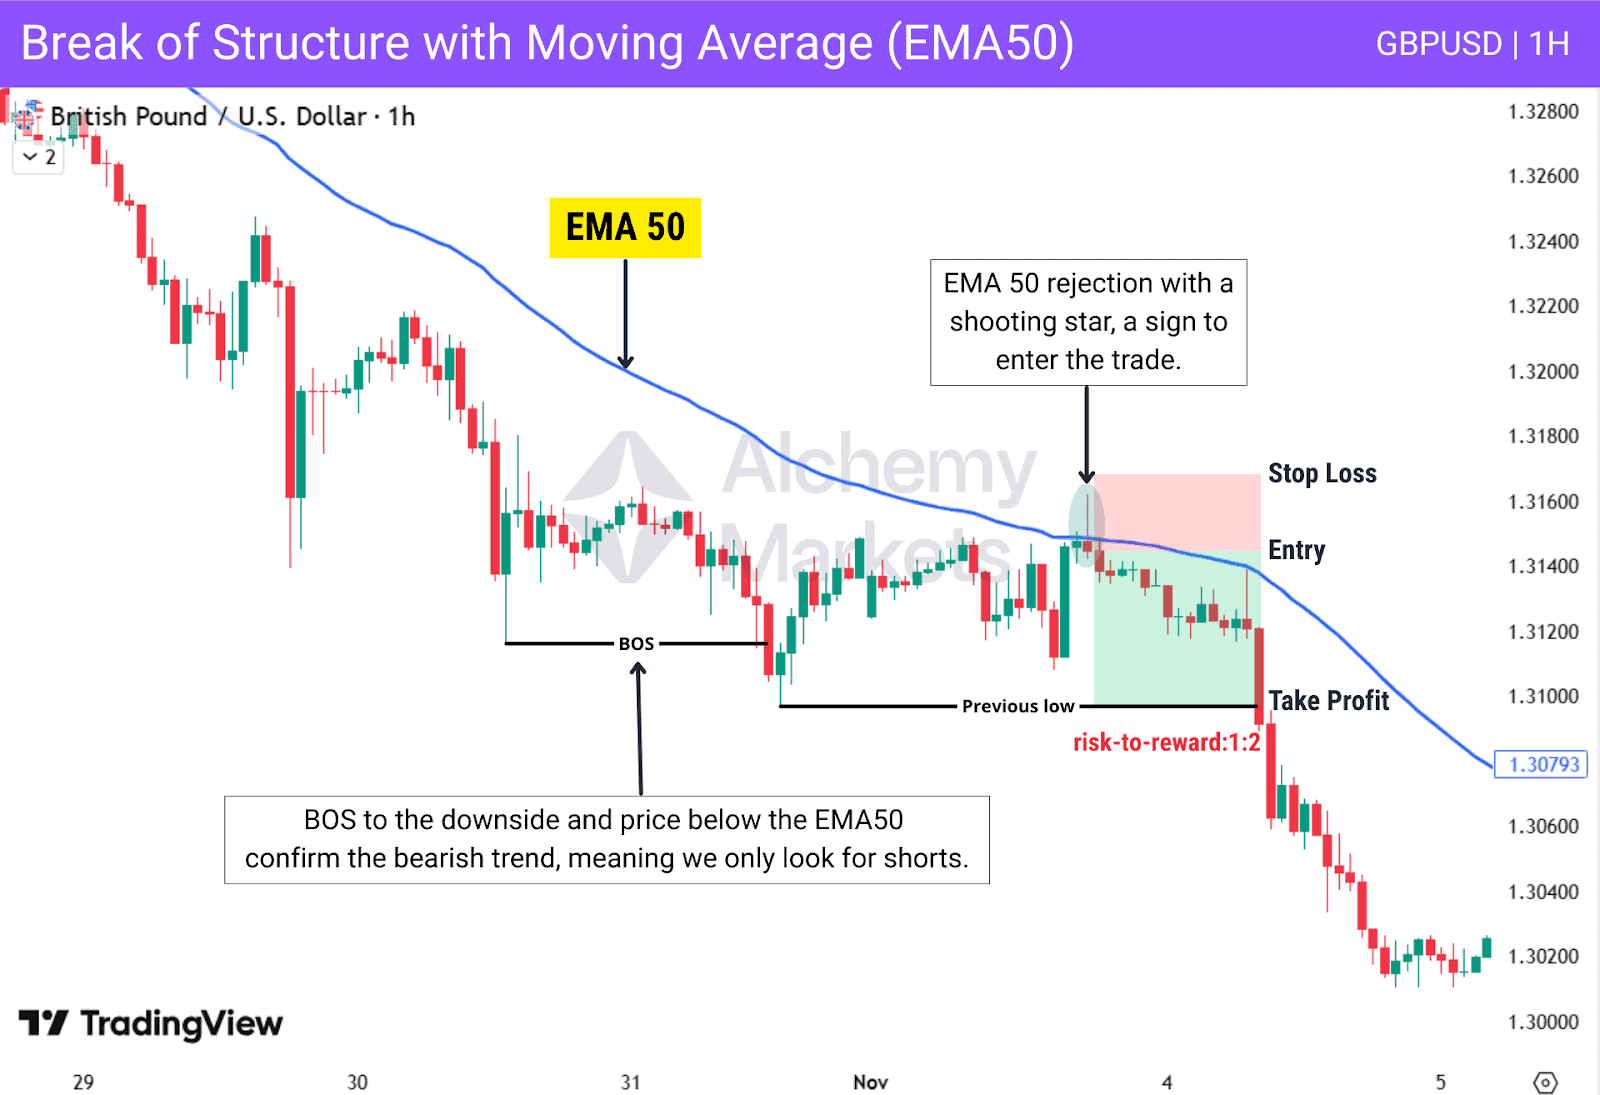
This chart shows a combination of Break of Structure and the 50 EMA. Price breaks structure, retraces into the EMA, and forms a clear shooting star. This signals that the pullback is weakening and the trend is ready to continue.
| Entry: After price returns to the 50 EMA and forms a rejection candle. |
| Stop Loss: Beyond the rejection candle. |
| Take Profit: First target the recent swing high or swing low. |
Break of Structure with Bollinger Bands
Bollinger Bands® act as dynamic support and resistance, with the upper and lower bands often guiding where price may react during a retracement.
When combined with a Break of Structure, they help identify high-quality continuation signals aligned with the dominant structure.
After a BOS defines direction, price typically retraces toward the lower band in a bullish structure, or toward the upper band in a bearish structure. A clear rejection from these areas often signals that the pullback is ending and the trend is ready to continue.
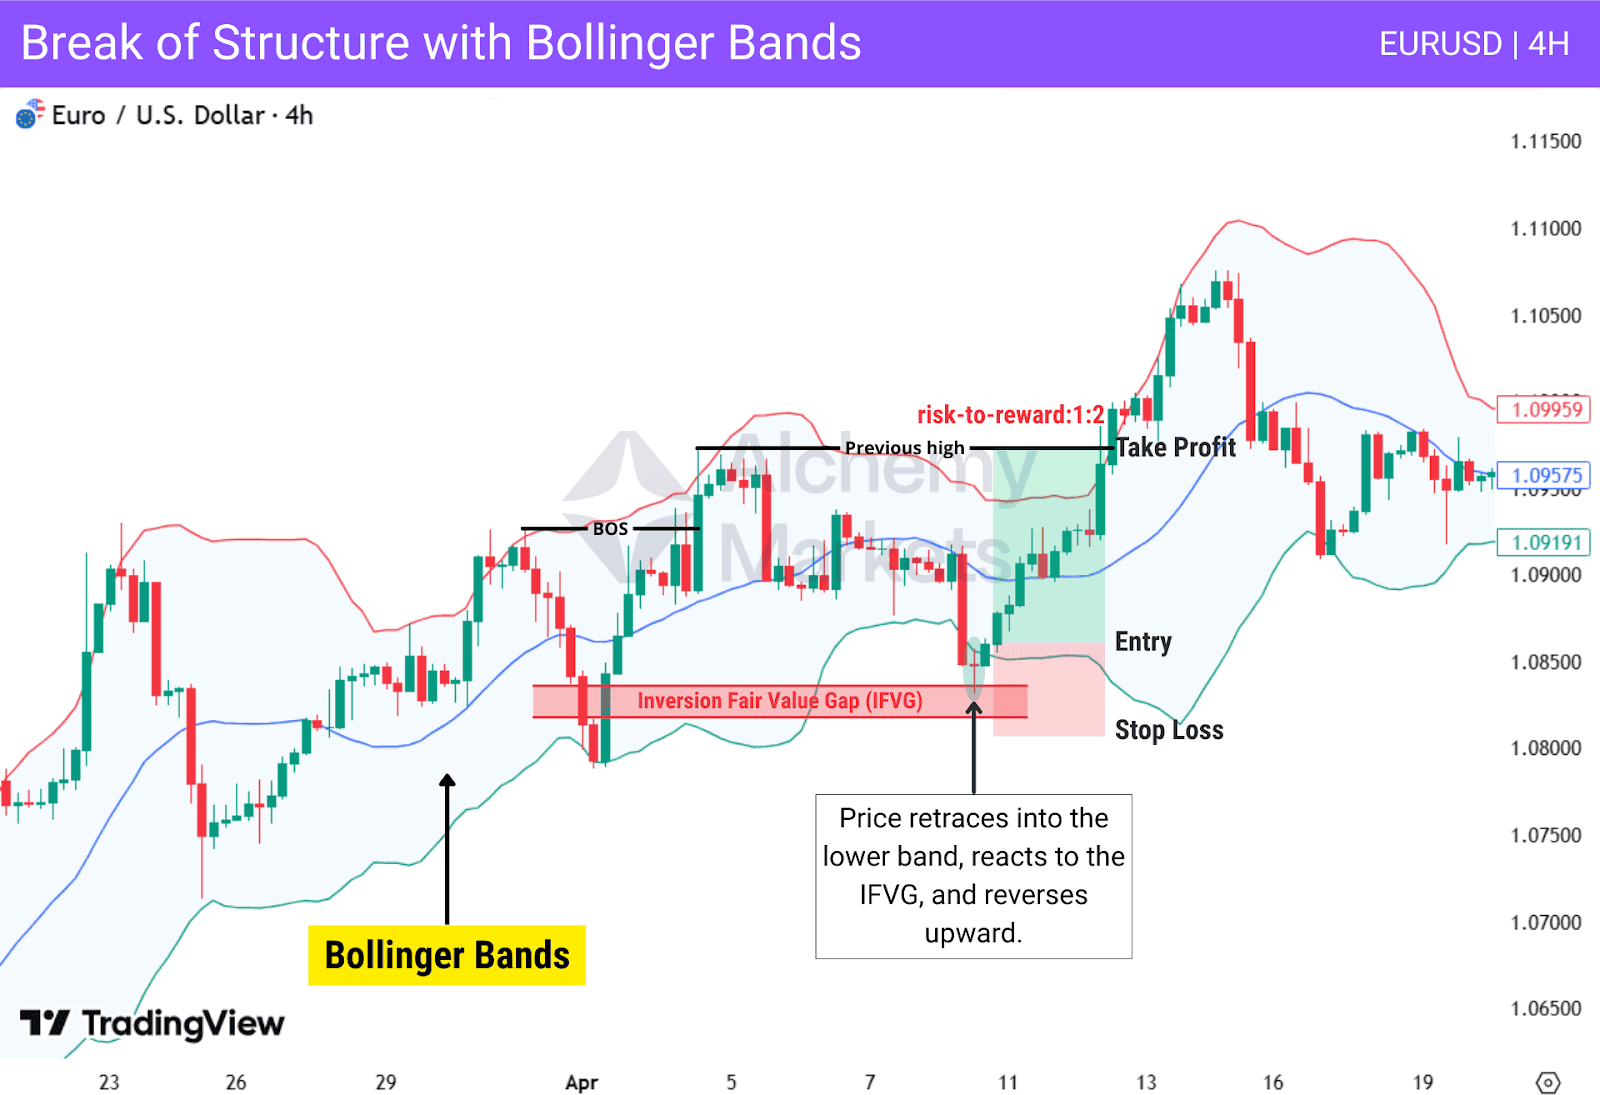
This chart shows price breaking structure, then retracing into the lower band aligned with an inversion fair value gap. Price forms a clear rejection candle, showing that the pullback is ending and the bullish structure is ready to continue.
| Entry: After price retraces into the lower band and forms a rejection candle in the BOS direction. It may also react at a pd array, adding extra confirmation. |
| Stop Loss: Beyond the rejection candle. |
| Take Profit: At the recent swing high formed by the BOS. |
Break of Structure with Williams %R
Williams %R works well with Break of Structure because it helps time retracements and shows when momentum is shifting back toward the original trend. It provides overbought and oversold information similar to RSI, but using a different calculation based on price position within the recent range. It becomes even more effective when combined with PD arrays.
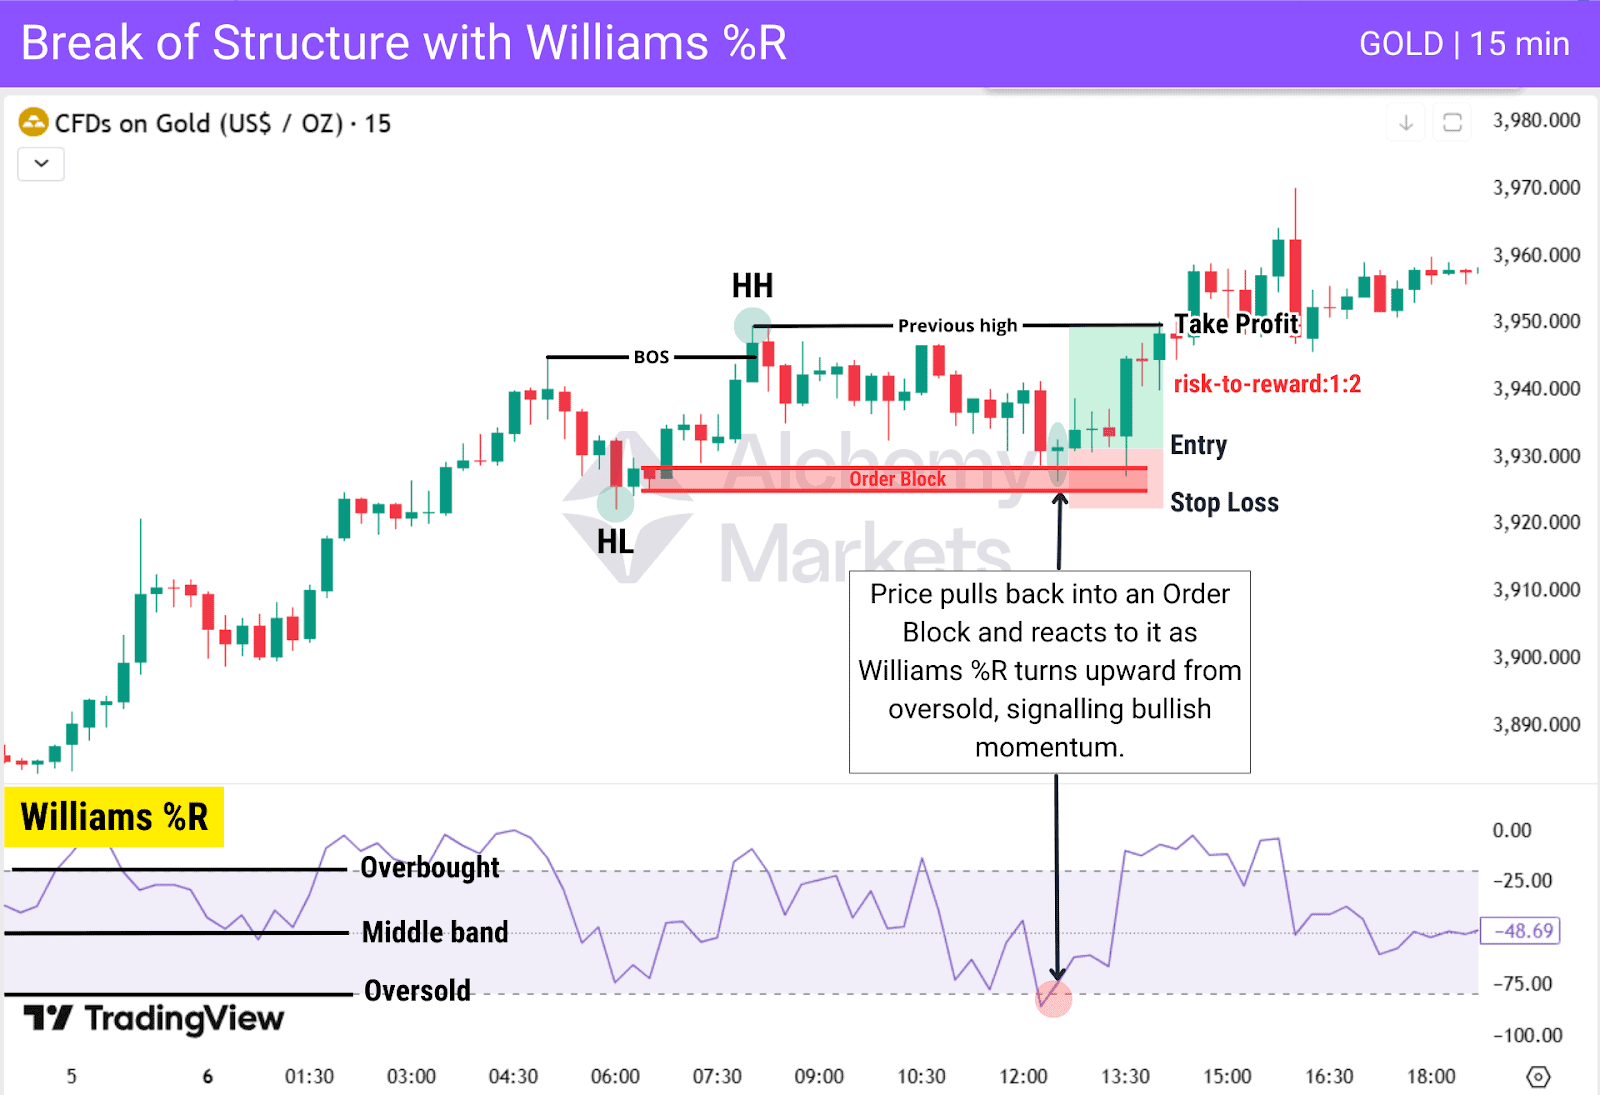
This chart shows price forming a bullish BOS, then pulling back into an Order Block while Williams %R dips into oversold. When Williams %R turns upward from oversold as price reacts inside the Order Block, it signals that bullish momentum is building and price is likely to continue in the direction of the original trend.
| Entry: After Williams %R rises from oversold while price forms a reaction candle inside the Order Block. |
| Stop Loss: Below the Order Block, or for extra safety, below the higher-low structure point. |
| Take Profit: Target the recent swing high created by the BOS, or consider exiting when Williams %R reaches overbought and begins turning downward. |
The London Breakout Method
The London Breakout Method begins by marking the Asian session high and low. After London opens, traders look for price to react to a PD array while staying aligned with the trend. Once a clean rejection forms, the trade is taken with the goal of targeting the opposite side of the Asian range.
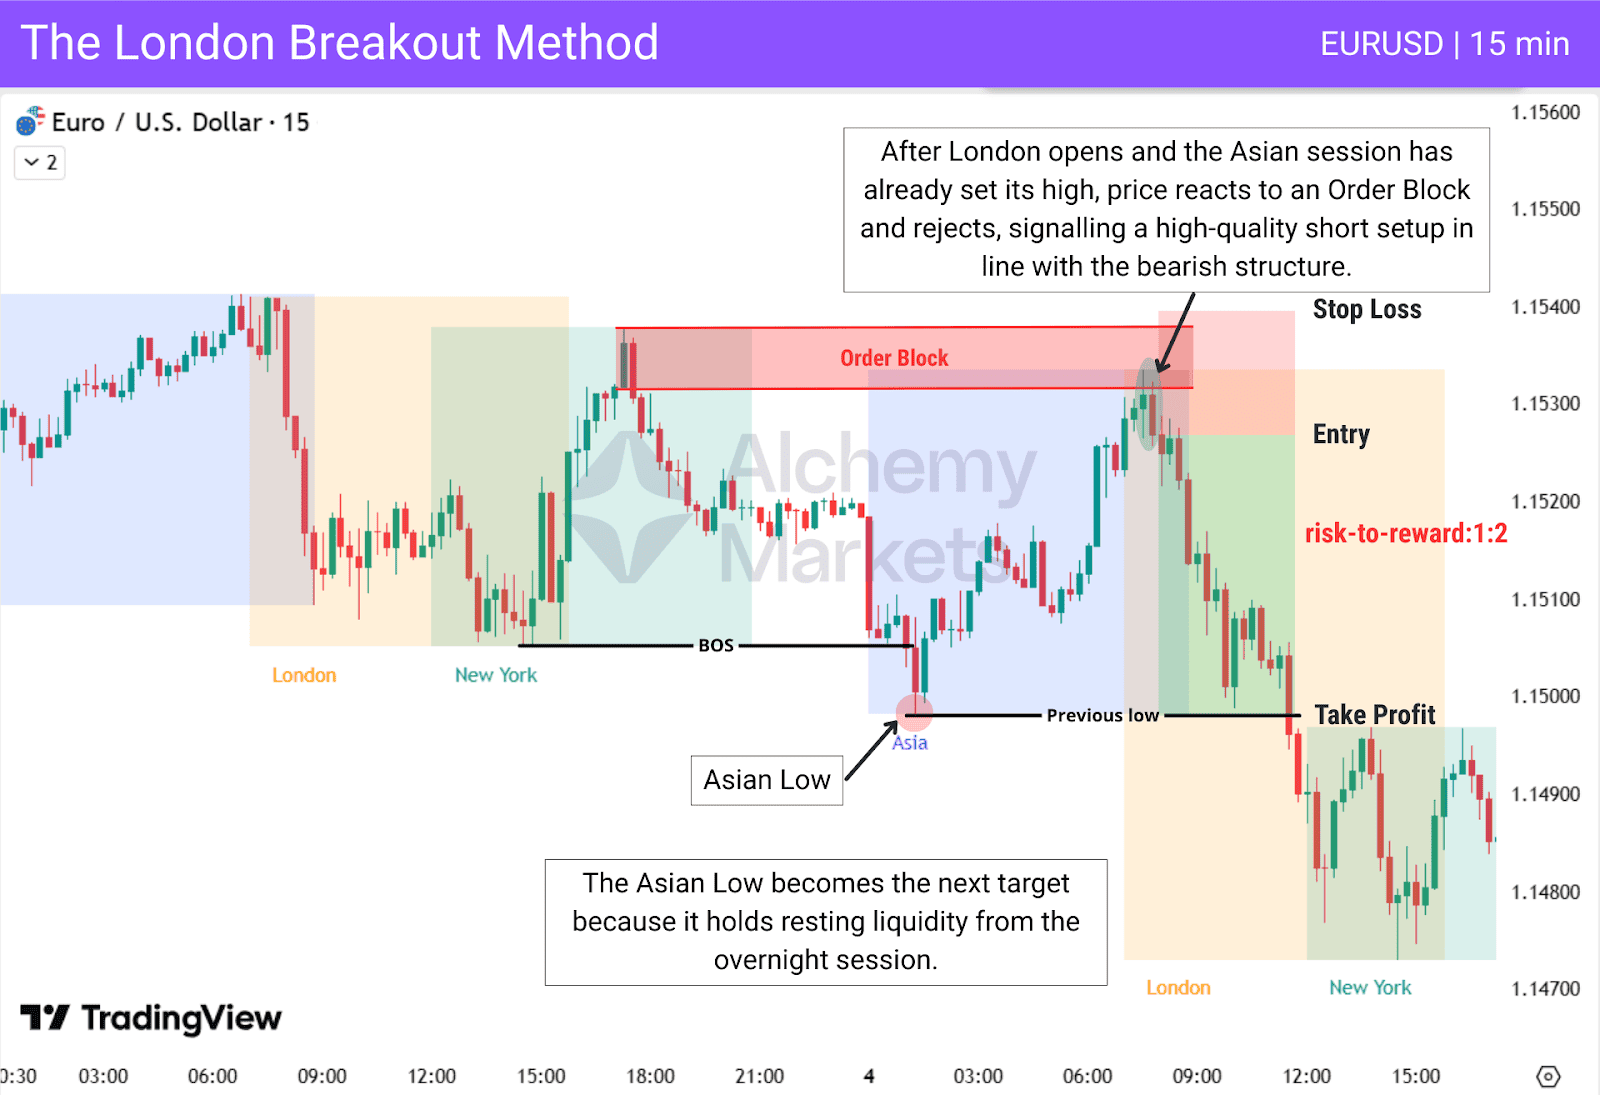
In this example, price fails to break above the Asian High after London opens, then reacts to an Order Block and rejects in alignment with the bearish structure. With the Asian Low acting as a liquidity pool, it becomes the natural target for the continuation move.
| Entry: After price reacts to an Order Block and forms a rejection candle in the direction of the latest BOS. |
| Stop Loss: Above the Order Block. |
| Take Profit: Target the opposite side of the Asian range (Asian Low). |
The New York Reversal Play
The New York Reversal uses liquidity built earlier in the day, mainly from London.
New York first pushes through a swing high or swing low formed during the London session, trapping breakout traders and collecting their stops.
For a valid liquidity sweep, price must sweep that London swing and then reverse with strong displacement (large impulsive candles), forming a CHoCH or internal CHoCH and leaving a clear PD array that supports continuation aligned with the original trend.
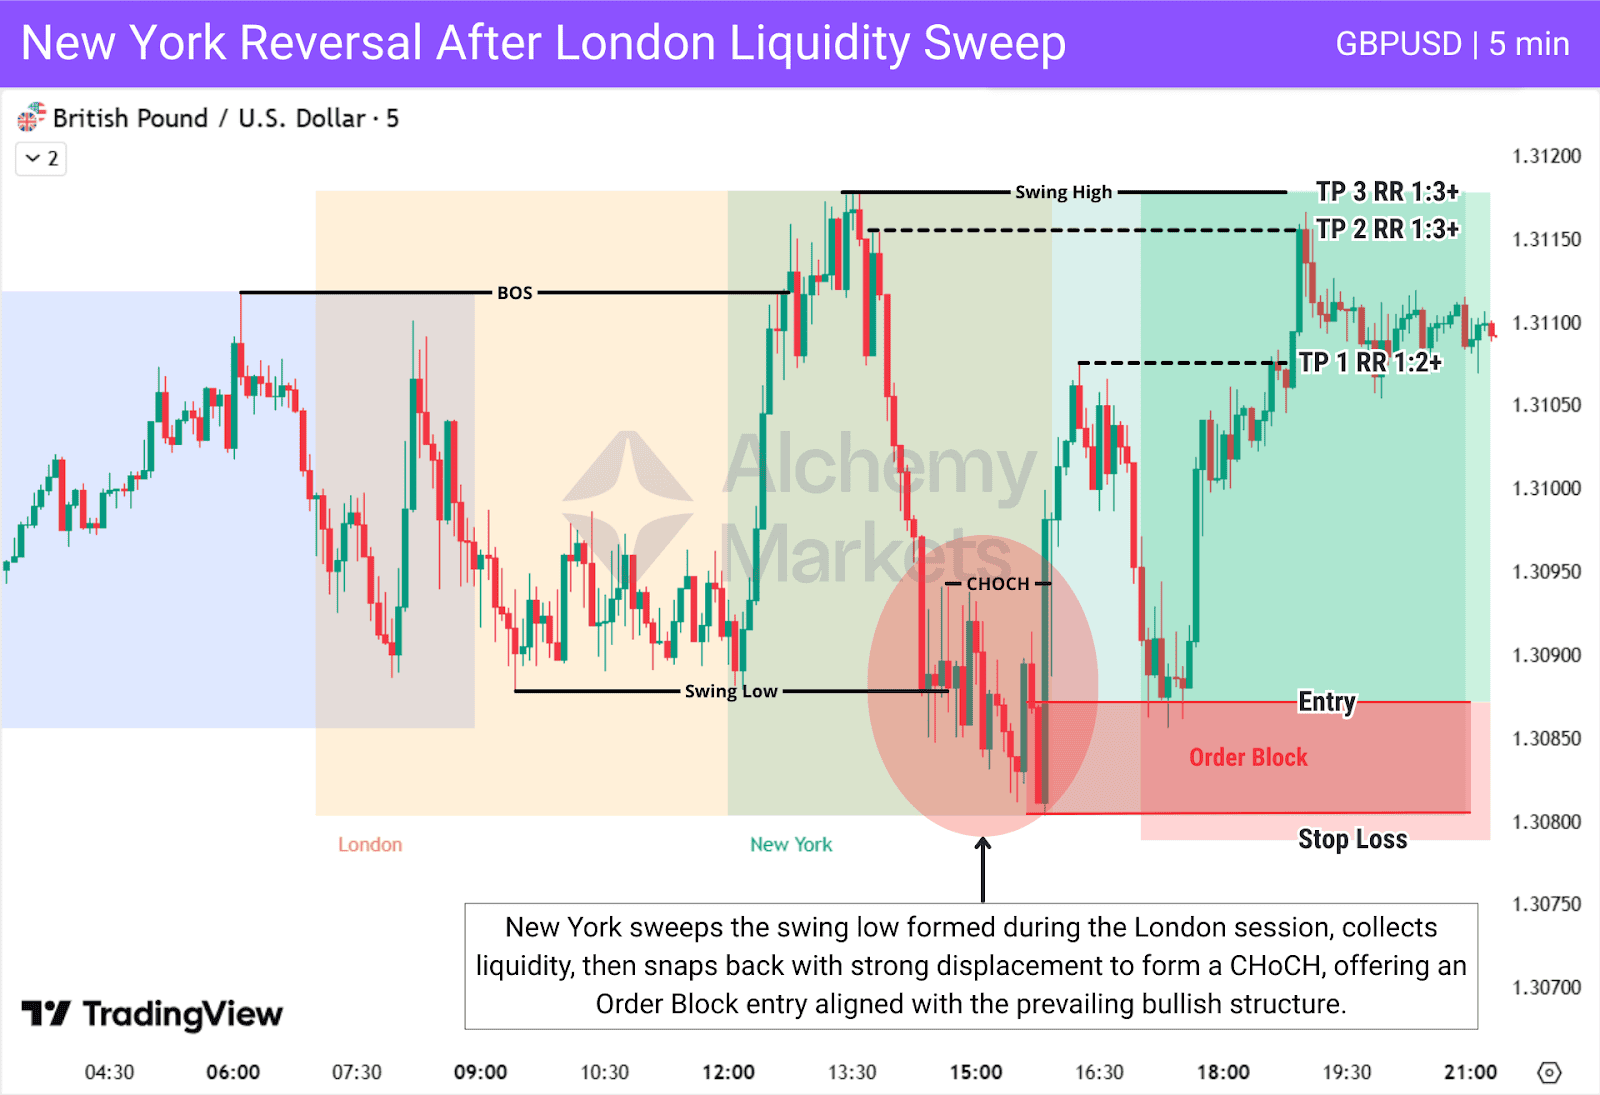
| Entry: Just above the Order Block. |
| Stop Loss: Below the Order Block |
| Take Profit: Target the opposite side of the Asian range (Asian Low). |
The Weekly Structure Strategy
The Weekly Structure Strategy combines high-timeframe direction with lower-timeframe precision. Use the weekly chart to define structure, then zoom into the Daily or 4H to find key levels or areas to enter a trade, and wait for price to return into them and react.
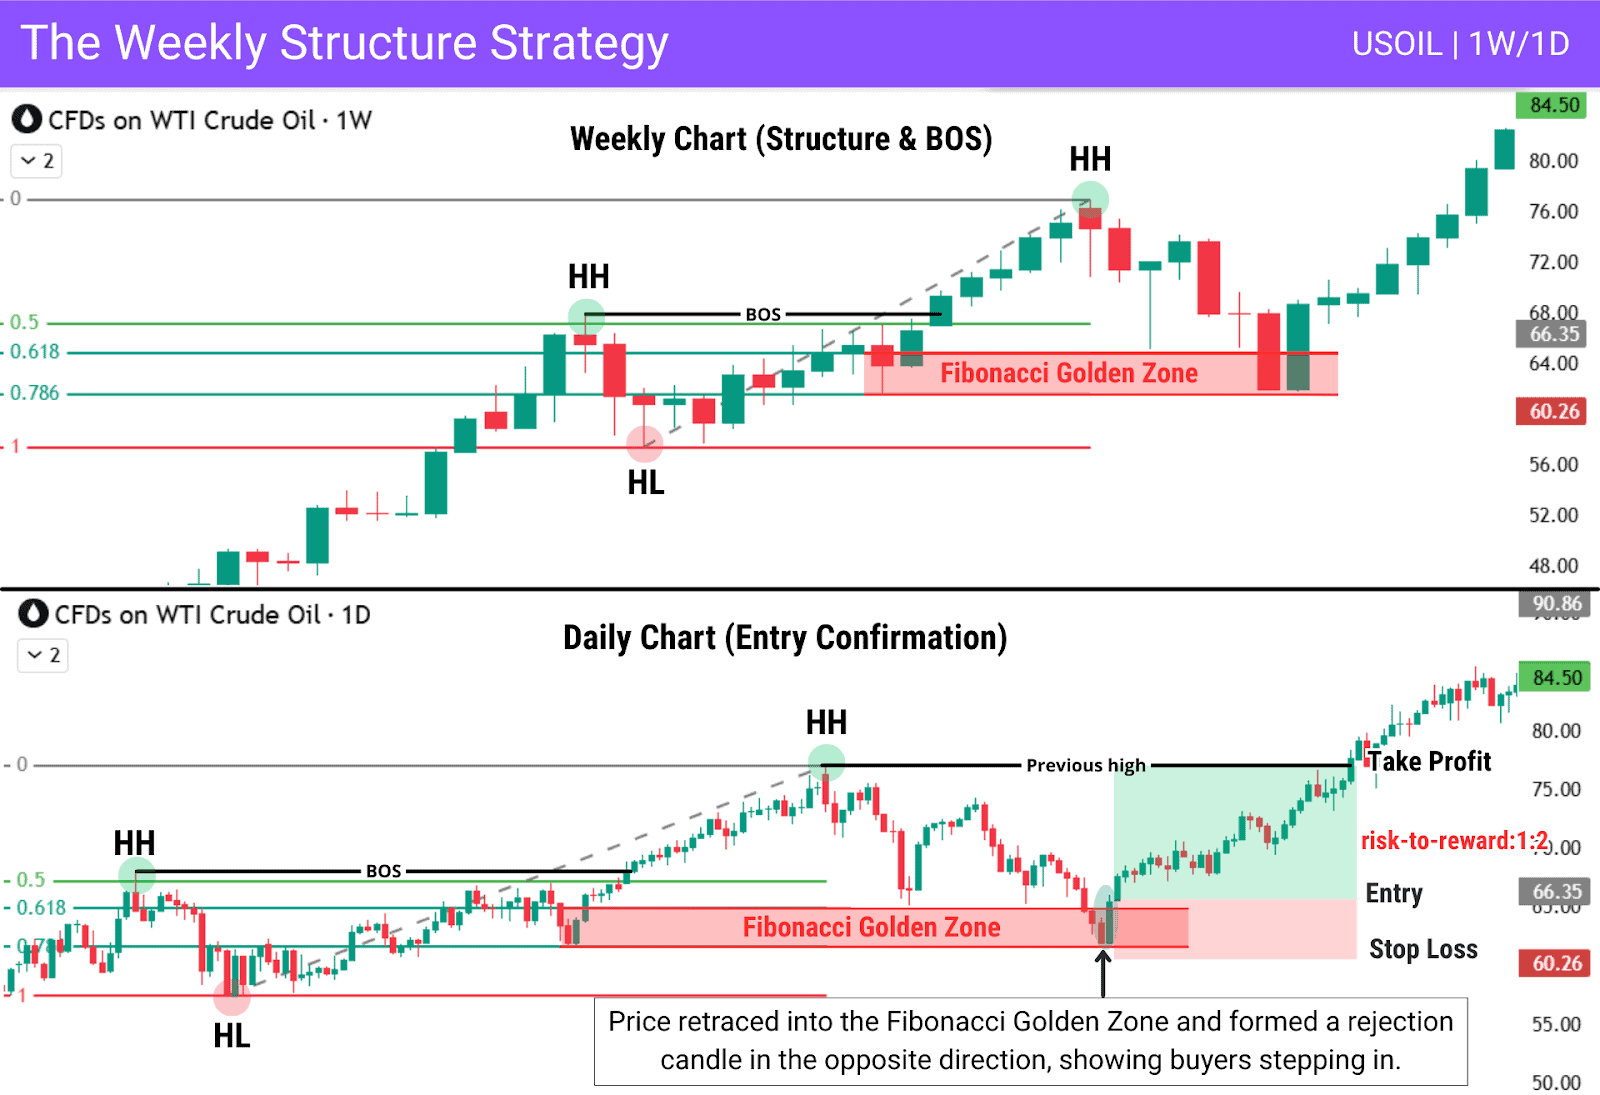
| Entry: Enter when price returns to the fibonacci golden zone inside the weekly structure and shows a clear reaction such as strong rejection candle. |
| Stop loss: Place the stop loss below the fibonacci golden zone. |
| Take Profit: Target the opposite side of the Asian range (Asian Low). |
Advantages of Trading on the Break of Structure
Understanding Break of Structure offers strong advantages to traders:
| Advantage | Explanation |
| Identifies Trend Direction | BOS shows the dominant side of the market, especially on higher timeframes, helping traders follow real momentum instead of guessing. |
| Provides Tighter Stops | By validating clear swing points, BOS gives traders reliable structural levels to place stop losses, improving risk-to-reward and reducing unnecessary losses. |
| Improves Entry Precision | BOS helps refine precise entries and confirmations, especially on lower timeframes where structure becomes more detailed. |
| Can Be Used as a Target | Previous BOS levels act as natural liquidity pools, allowing traders to use them as profit targets. |
Disadvantages of Trading on the Break of Structure
Despite its advantages, trading the Break of Structure comes with several limitations that traders must understand:
| Disadvantage | Explanation |
| False Signals | Price may break a swing only to reverse immediately after sweeping liquidity, causing false signals. |
| No Pullback After BOS | Price can continue trending after a BOS without retracing to a POI, leaving no opportunity to enter. |
| Misreading Lower Timeframes | Small fluctuations or BOS on lower timeframes are often mistaken for real structure without higher-timeframe context. |
| Requires Deep Analysis | BOS must be interpreted within the broader market structure, otherwise key movements can be misread. |
Break of Structure vs Market Structure Break
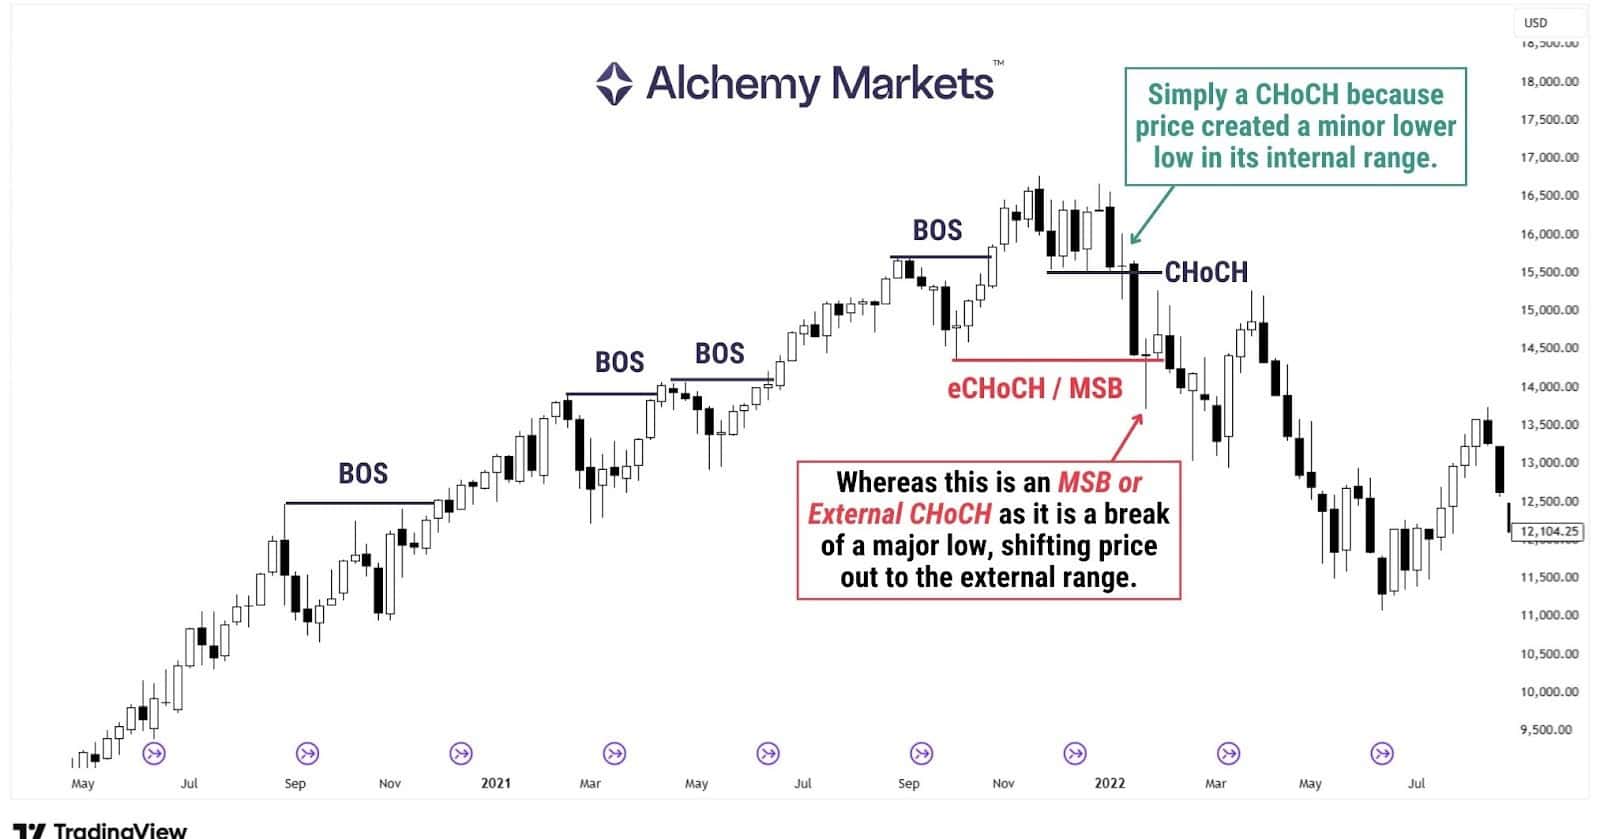
A Break of Structure (BOS) shows continuation of a trend. When price breaks a swing in the direction of the trend, it confirms that the dominant side is still in control.
An MSB, on the other hand, breaks a major swing point against the trend. This type of break is effectively an external Change of Character (eChoCH), because it takes out an external, higher-importance level rather than a small internal swing.
When this major swing breaks, it disrupts the previous structure and signals that the trend may be shifting.
Break of Structure vs Change of Character (CHoCH)
A CHoCH is any break against the current trend. It can be internal or external, which simply describes the scale of the swing that was broken. An internal CHoCH breaks a minor swing, while an external CHoCH breaks a larger one.
A CHoCH is only an early signal that the trend may be weakening. It does not confirm a full shift on its own. The confirmation comes when price follows the CHoCH with a BOS in the new direction.
If no BOS forms after the CHoCH, the move may just be a retracement and the original trend can continue.
Break of Structure vs Liquidity Sweep
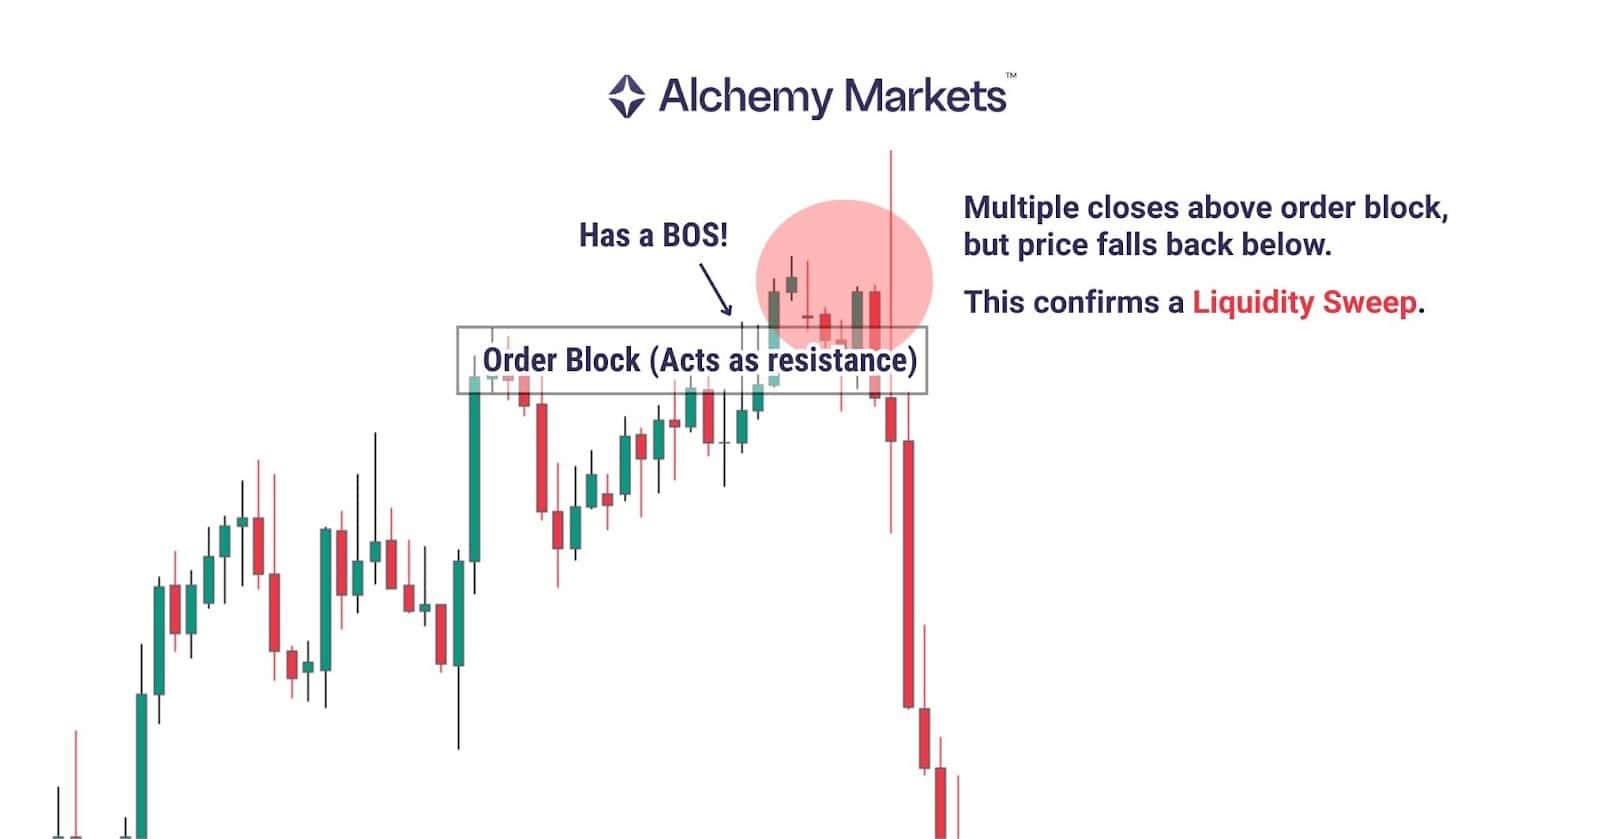
A liquidity sweep is a brief break of a key level designed to collect stops before reversing. It may even create a few candle closes beyond the level, but there is no real commitment or follow-through. Volume often spikes once and then fades.
A Break of Structure requires a decisive close beyond the level and continued movement in the same direction, usually supported by rising volume. This shows the market is accepting the breakout rather than just running liquidity.
Break of Structure vs Liquidity Grab
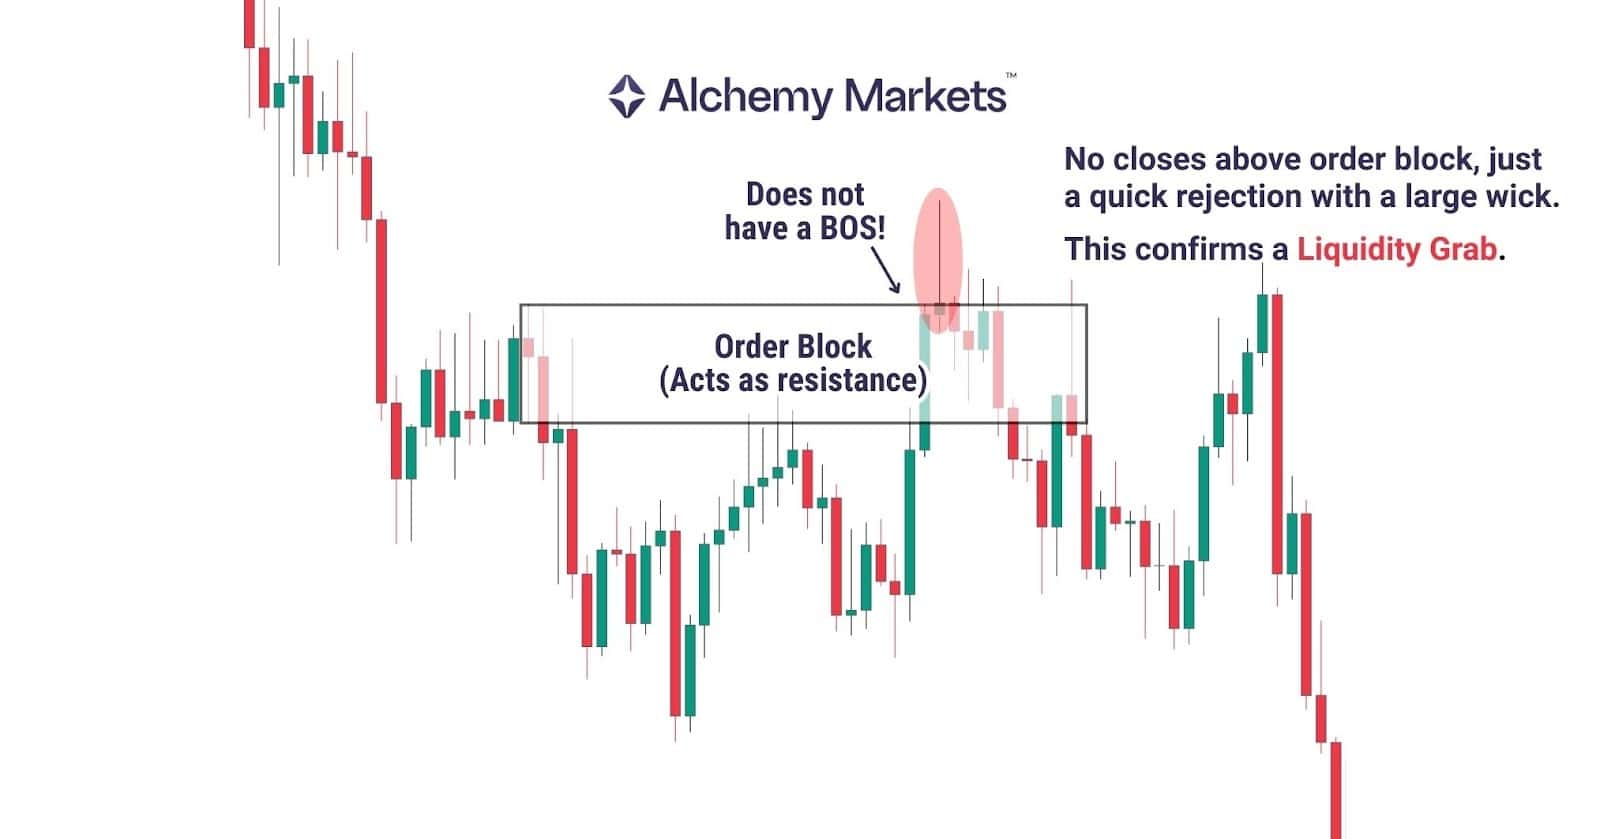
A liquidity grab is a fast, wick-driven spike through a level or into an order block that instantly snaps back. It usually happens in a single candle, builds no structure, and does not continue in the breakout direction.
A Break of Structure is the opposite. It needs a strong close and displacement after the break, showing that the move is genuine rather than a trap.
Break of Structure vs Support and Resistance
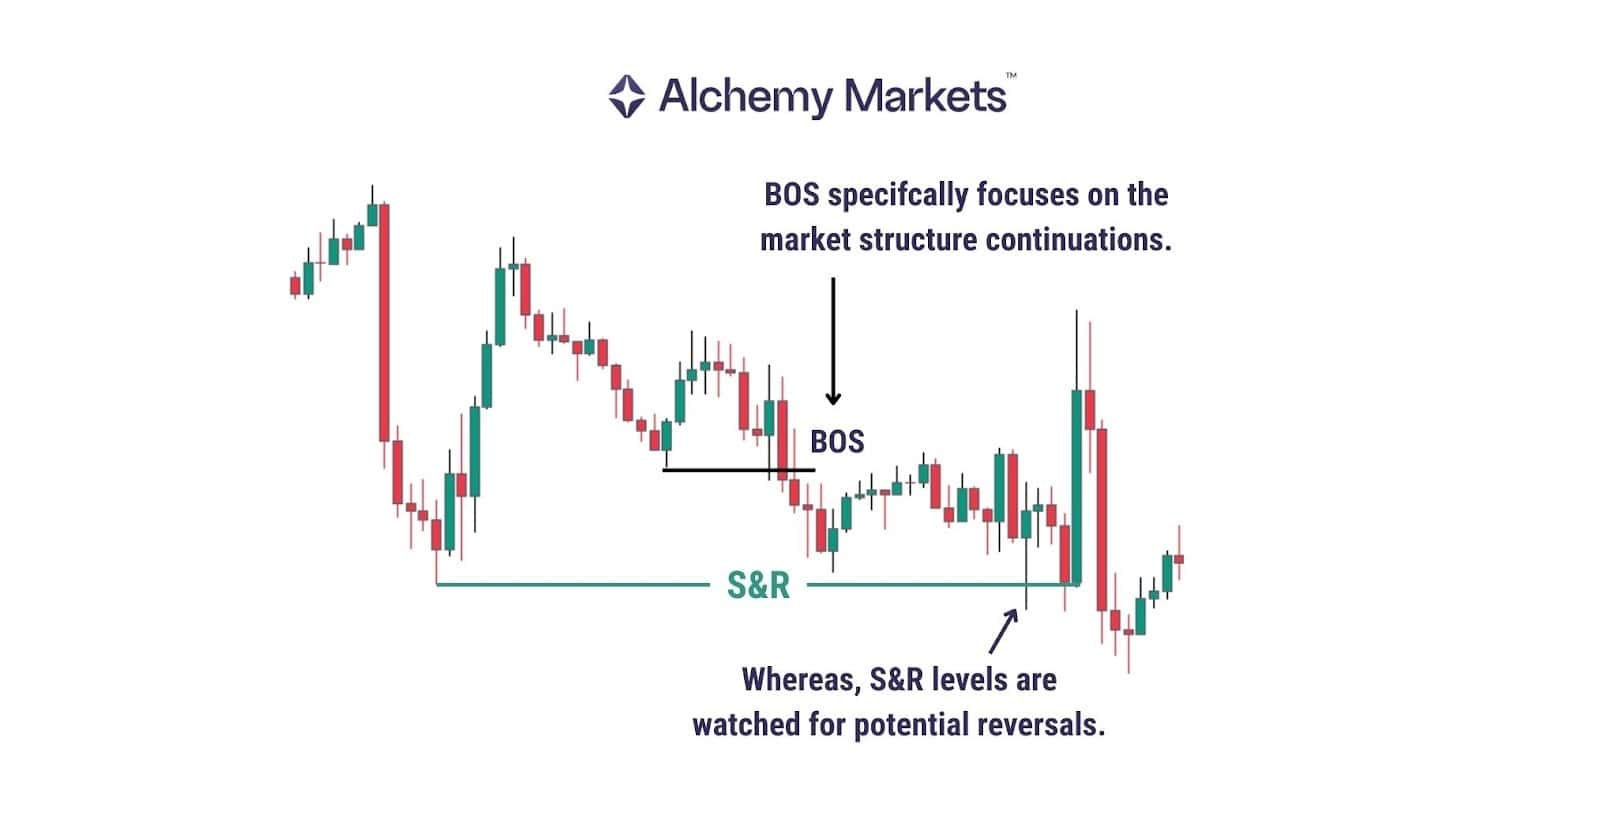
Support and resistance are static reference lines, while BOS is dynamic and shows how price actually behaves around those lines.
S&R tells you where the price reacted. BOS tells you how the market has shifted.
The BOS mindset focuses on structural flips, such as resistance turning into support or support becoming resistance, often long before traditional S&R tools reveal the shift.
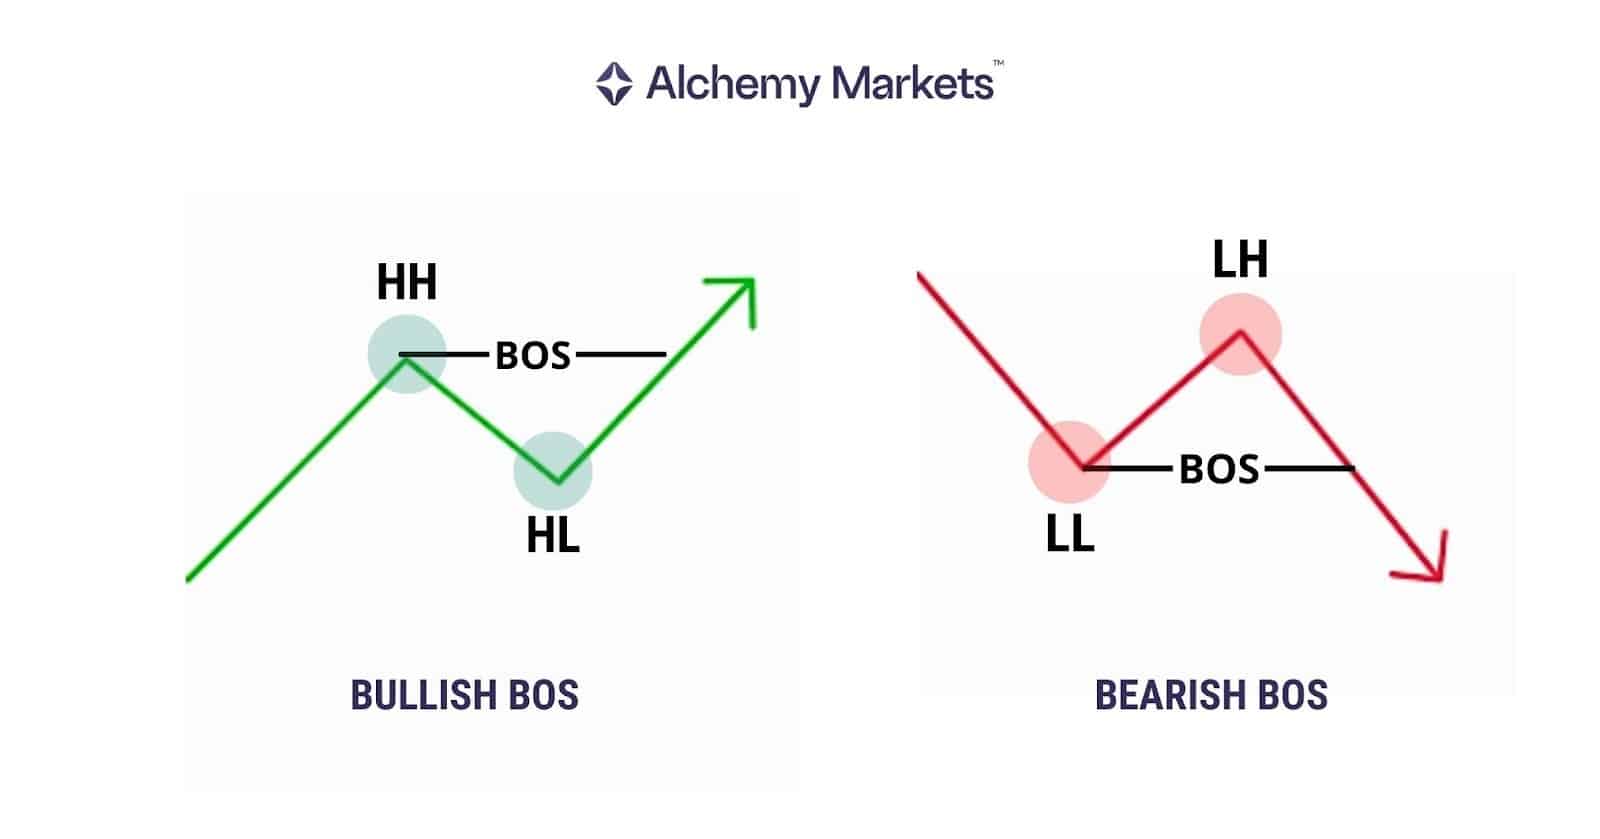
Bullish BOS vs Bearish BOS
In forex trading, these structural sequences appear clearly on major pairs such as EUR/USD, GBP/USD and USD/JPY, where liquidity and volatility naturally create well-defined swing points.
Bullish BOS (Break of Structure) occurs when the price has already formed a higher high, and higher low. This signals bullish continuation. Bearish BOS occurs when the price has already formed a lower low, and lower high. This signals bearish continuation.
FAQ
Is Break of Structure (BOS) a Leading or Lagging Indicator?
BOS is a lagging confirmation because the break occurs after the move begins, but once validated it provides a leading indication that the trend is likely to continue.
Is Break of Structure (BOS) an ICT Concept?
ICT helped popularise the term, but BOS existed long before ICT and originates from classical price action, Wyckoff swing theory and traditional trend analysis.
What are the Common Break of Structure Mistakes to Watch Out For?
The most common mistakes include treating minor fluctuations as BOS, entering before the break is confirmed and ignoring higher timeframe structure or context.
What Is the Best Time Frame To Use for the Break of Structure?
BOS works across all timeframes. Higher timeframes such as the Weekly, Daily and 4H provide the clearest structure and strongest directional confirmation. Lower timeframes are best used for precise entries and timing once the higher timeframe bias is clear.
What are the best markets for Break of Structure?
BOS works best in efficient and highly liquid markets that produce clean impulses and retracements. Major forex pairs, indices, commodities and large-cap stocks usually offer the cleanest and most reliable BOS patterns.
What is the Psychology Behind the Break of Structure?
A BOS reflects a shift in control where one side of the market overwhelms the other, triggering liquidity, forcing exits and creating momentum as market sentiment aligns.
Can Break of Structure work in ranging markets?
Yes, but BOS inside a range is often unreliable. Only breaks followed by clear displacement beyond the range boundaries provide trustworthy continuation signals.
Is Break of Structure bullish or bearish?
A BOS is bullish when price breaks a previous swing high and bearish when price breaks a previous swing low. The direction is defined by which structural level is broken.


