Written by:


- Chart of the Day
- November 24, 2025
- 3 min read
Bears on Parade: BTC Still Bearish, Short Term Bounce Possible
Bitcoin is getting a short-term boost as markets price in a December Fed cut, with expectations now near 67.1 percent for a 25 bps move.
Adding to the mix, President Trump has also floated a 2,000 dollar stimulus check for all U.S. citizens, but prediction markets on Polymarket assign only a 7 percent chance of it actually happening.

Liquidity is improving, yes — yet the chart still leans bearish. Bitcoin’s current reprieve is shaping up as a potential relief rally within a larger correction.
BTC Technical Analysis — November 24th, 2025
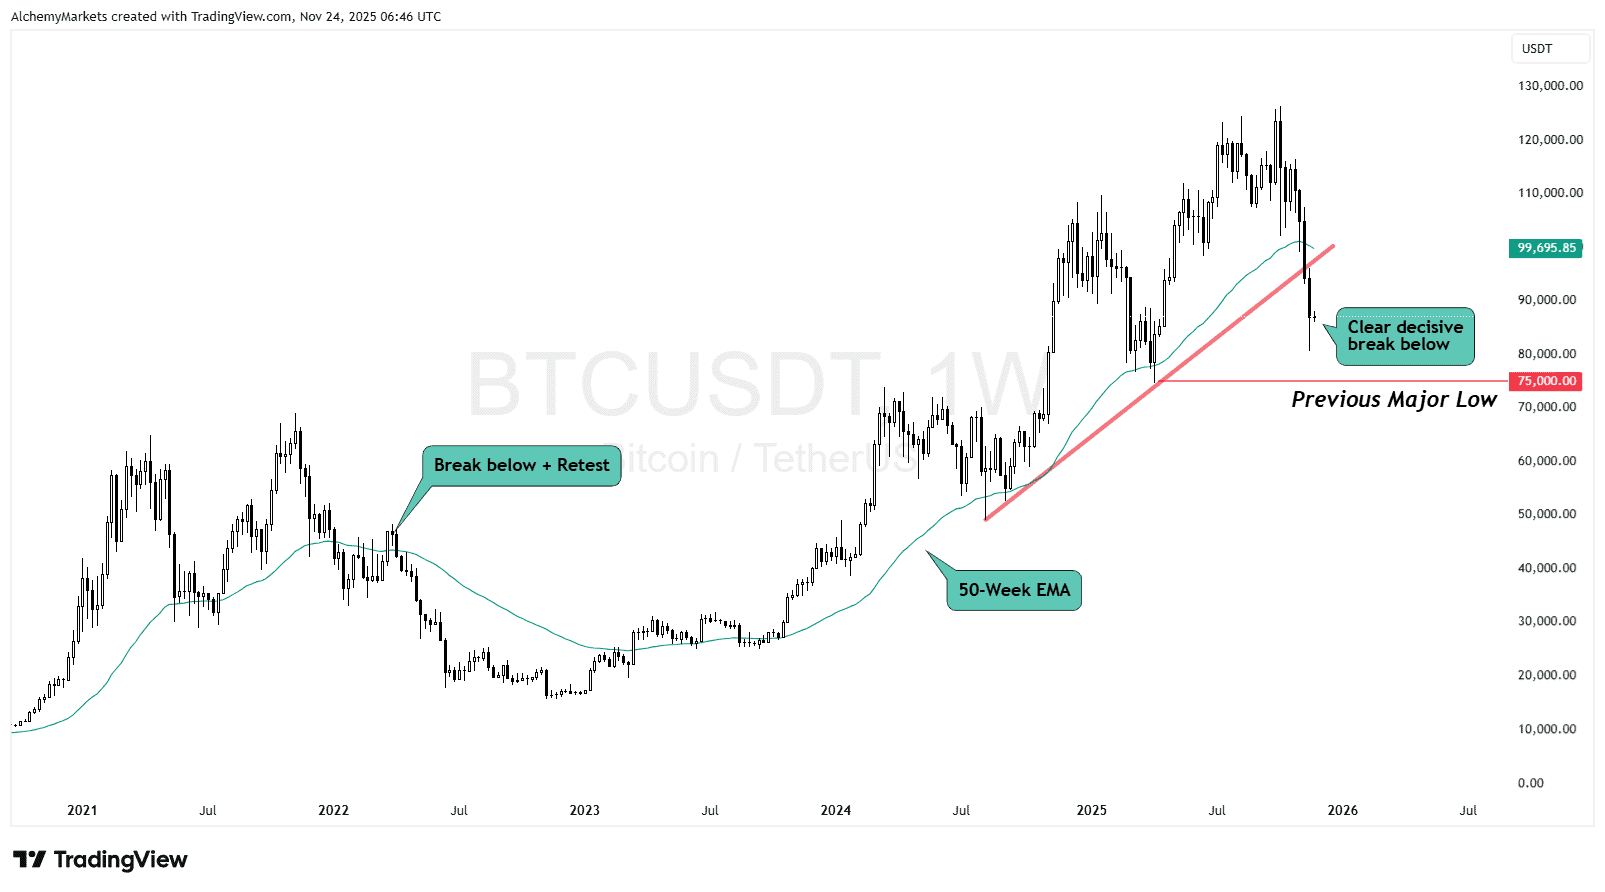
BTC lost two major supports:
- The 50-week EMA, which has been a historical support.
- The rising trendline that guided the entire move from 2024.
Breaking both puts price in a structural retracement phase. Even with the current bounce, BTC remains below the key reclaim zones.
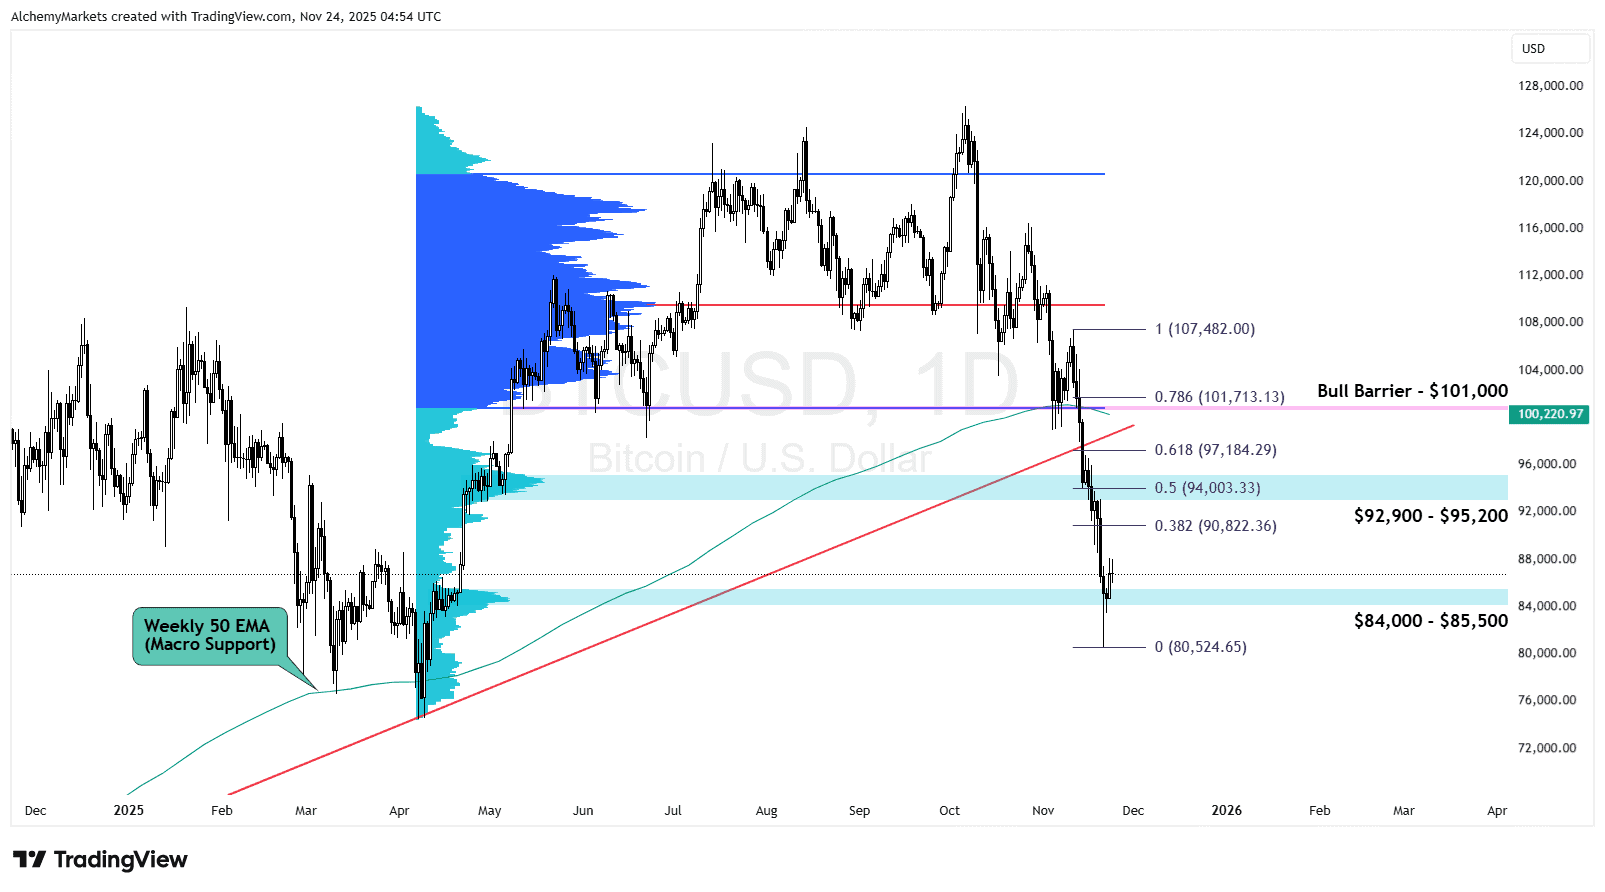
The chart shows a clear two-stage roadmap:
Short-term upside
Macro optimism can fuel a retest of broken structure.
Immediate resistance is the 38.2 Fib at 90,822 and the 50 Fib at 94,003, sitting inside the $92,900 to $95,200 high volume zone (shown by the volume profile anchored to April’s rally).
Higher resistance
If BTC breaks above that, the final decision point sits at $101,000. This level aligns with:
- The Value Area Low of the entire rally
- The 0.786 Fib at 101,713
- Multiple critical lows in prior structure
This is the zone where bulls either reclaim control or the bearish structure snaps back and sends price lower. Alternatively, the 0.618 Fib is also a legitimate rejection zone on its own.
The Weekly 50 EMA is now curling downward and could very easily meet the 0.618 level, creating a trendline + EMA + Fib confluence.
If that alignment happens, BTC may struggle to break through long before it reaches $101k.
Downside map
The swing low at $80,524, remains a valid target for a second sweep. However, the larger target would be the psychological low at $75,000.
DXY Technical Analysis — November 24th, 2025
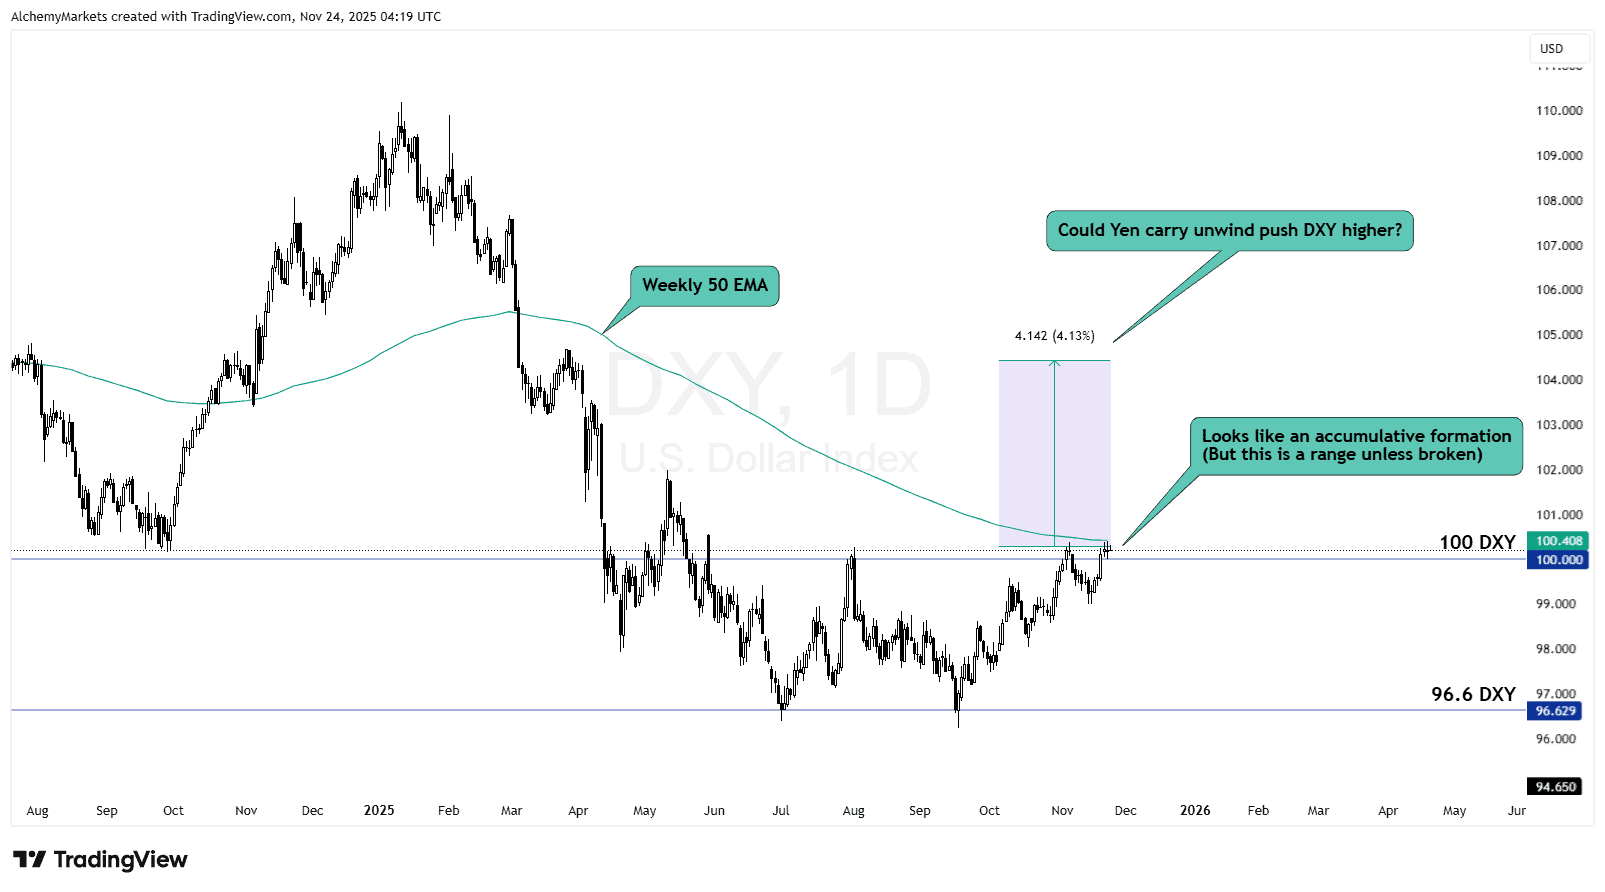
While BTC’s chart leans bearish on its own, the macro layer isn’t offering relief either. The Dollar Index (DXY) has been building a clear accumulation range beneath 100 to 96.6 (approximately), and this structure matters for crypto.
DXY’s current setup looks like a horizontal base that could extend higher if catalysts line up. The range remains a range until broken, but the behaviour underneath resistance tells its own story.
Two things stand out:
1. Yen carry unwind risk
Any further unwinding of the USDJPY carry trade can tighten global liquidity and push DXY higher by extension. A stronger dollar typically pressures risk assets such as Crypto and Stocks.
2. Weekly 50 EMA overhead
The Dollar Index sits right below its Weekly 50 EMA. If DXY breaks above 100 and accelerates into the 102–104 region, it becomes a direct headwind for BTC’s attempt to reclaim broken structure.
In short: DXY isn’t confirmed bullish, but its positioning is not supportive for a sustained BTC recovery. A breakout above 100 and the weekly 50 EMA would add another macro layer of resistance against any upside attempt in Bitcoin.
| Quick recap: This analyst believes that Bitcoin is currently macro-bearish, and rallies are for selling until $101,000 is decisively broken and held. |