


Written by:

Reviewed by:

- July 19, 2025
- 20 min read
Anchored VWAP Explained
The VWAP is one of the most widely used tools by institutional traders — a benchmark for fair value and execution. But did you know there’s a more flexible, event-driven version?
Meet the Anchored VWAP, a powerful variation that lets traders track volume-weighted price action from any key point in time.
What is the Anchored VWAP?
The Anchored VWAP (Volume Weighted Average Price) is a technical trading tool that helps traders identify key price levels based on both price and volume, but anchored from a specific starting point. Unlike the traditional VWAP line, which resets daily, Anchored VWAP allows traders to select a meaningful anchor point—such as a major swing high, low, or a significant event (like earnings releases or news-driven price movements).
By anchoring VWAP to a specific point, traders gain a clearer picture of market sentiment and can determine whether an asset is trading above or below a fair price based on historical volume. It is widely used for identifying support and resistance levels, trend confirmation, and trade entry or exit points.
Now, let’s break it down further by understanding the VWAP line itself.
What is VWAP?
VWAP, or Volume Weighted Average Price, is a benchmark trading indicator that calculates the average price of an asset based on both price and volume over a set period—typically within a single trading day.
VWAP is heavily used by institutional traders to assess whether they are buying or selling at a fair market price. It serves as:
- A reference point for trade execution—institutions aim to buy below VWAP and sell above it.
- A trend confirmation tool—when the price is above VWAP, it indicates bullish sentiment, and vice versa.
- A support and resistance indicator—price movements around VWAP can signal potential reversals.
While VWAP resets daily, the Anchored VWAP offers more flexibility by allowing traders to choose their own starting point. This customisation makes it more relevant for longer-term trend analysis and strategy building.
How Does the Anchored VWAP Work?
The Anchored VWAP (AVWAP) works by calculating the Volume Weighted Average Price (VWAP) from a specific, user-defined point in time, rather than resetting at the start of each trading day like traditional VWAP. This custom anchoring allows traders to analyse price and volume from key market events, providing more contextual and actionable insights.
Key Mechanism of Anchored VWAP
- Selecting an Anchor Point:
- Traders choose a significant event as the starting point, such as:
- A major swing high or low
- Earnings reports or economic data releases
- Breakouts or breakdowns from consolidation zones
- Market opens or closes
- Traders choose a significant event as the starting point, such as:
- Volume-Weighted Price Calculation:
- From the chosen anchor point, the VWAP line continuously recalculates the average price, weighted by volume.
- This means price movements with higher volume have a greater impact, making the AVWAP a more reliable support or resistance indicator than simple moving averages.
- Dynamic Support & Resistance Levels:
- The VWAP line adjusts in real time, reflecting the true market sentiment from the anchored event.
- If the price stays above the VWAP line, it suggests bullish momentum; if it stays below, it indicates bearish sentiment.
- Traders use it to spot potential trade entries, exits, and trend reversals.
Importance of Anchored VWAP for Traders
The Anchored VWAP (AVWAP) is a game-changer for traders because it provides a customisable, data-driven approach to identifying key price levels. Unlike traditional VWAP, which resets daily, AVWAP allows traders to analyse price movements based on meaningful historical events, giving them a clearer understanding of market sentiment and trend strength.
Why Anchored VWAP Matters
- More Accurate Support and Resistance Levels
- Traditional support and resistance lines are often subjective, based on the trader’s view of the market. Anchored VWAP creates an objective price level that reflects actual market participation.
- If price consistently respects the AVWAP, it confirms the level is significant for buyers and sellers.
- Institutional Order Flow Insights
- Large institutional investors execute trades in phases, often accumulating or distributing stock over time.
- By anchoring VWAP to a key breakout, earnings date, or major market event, traders can track institutional footprints and position themselves accordingly.
- Works for Multiple Trading Strategies
- Day Traders: Use short-term AVWAP for scalping and intraday trades, identifying precise entry and exit points.
- Swing Traders: Anchor VWAP to recent highs/lows to determine trend strength and potential reversal zones.
- Long-Term Investors: Can anchor VWAP to yearly highs, IPO dates, or economic reports to assess fair value levels over extended periods.
- Reduces Market Noise
- Standard indicators like moving averages can lag behind price action, while support/resistance levels can be arbitrary.
- AVWAP smooths out price action by weighting it based on actual traded volume, making it a more reliable guide for trend confirmation.
Practical Example: Trading a Breakout Using AVWAP
- A stock breaks out from a long-term resistance level.
- Traders anchor VWAP to the breakout day to track how price interacts with it.
- If price pulls back to AVWAP and bounces off with strong volume, it signals that buyers are stepping in.
- This offers a high-probability entry point with a logical stop-loss just below AVWAP.
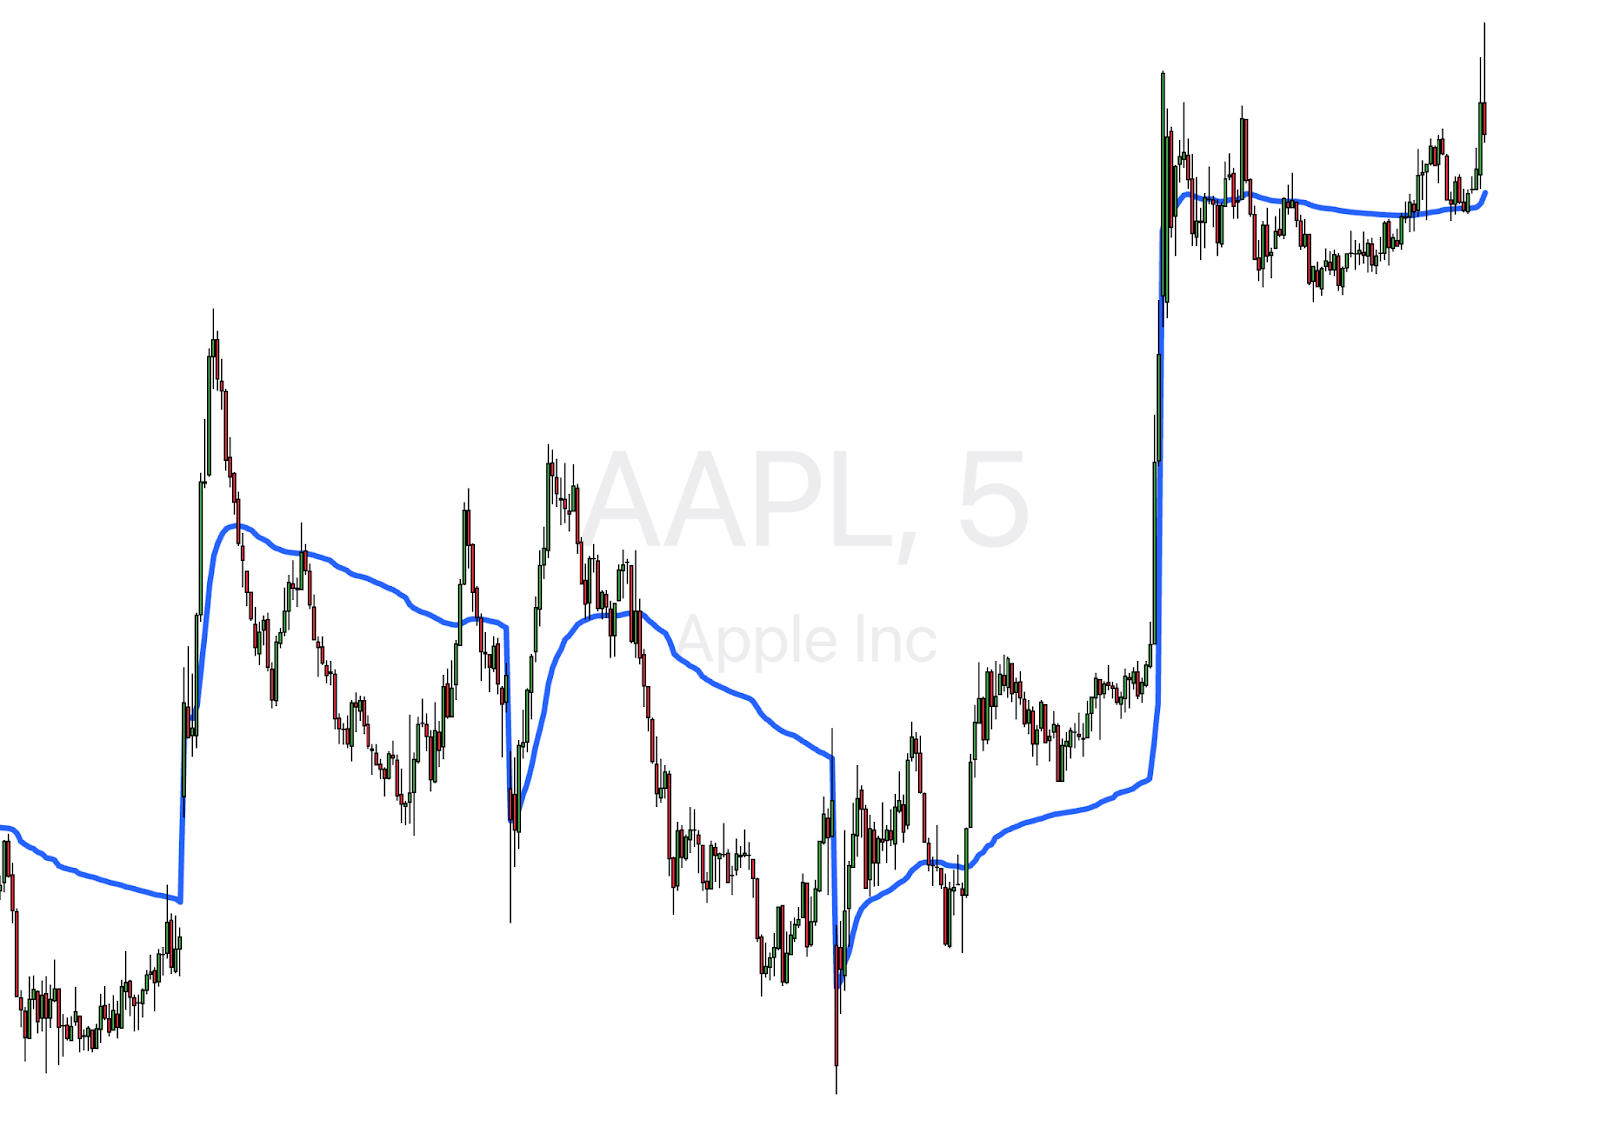
How to Read Anchored VWAP
Reading Anchored VWAP (AVWAP) effectively comes down to understanding how price interacts with this dynamic level. When price is above the VWAP line, it suggests bullish momentum, meaning buyers are in control. Conversely, when price is below the AVWAP, it signals bearish sentiment, indicating sellers have the upper hand.
Traders typically watch how price reacts to AVWAP as support or resistance. A stock pulling back to its Anchored VWAP and bouncing off with strong volume can indicate a buying opportunity, while a breakdown below it may signal further downside. Additionally, multiple AVWAPs from different anchor points (e.g., swing highs, lows, or major events) can provide a layered view of market structure, helping traders confirm trend strength and potential reversal zones.
Choosing an Anchor Point
Selecting the right anchor point is crucial when using Anchored VWAP (AVWAP). The goal is to choose a point where market sentiment may have shifted, allowing AVWAP to provide meaningful support or resistance levels. The best anchors are key price action events that attract significant volume and institutional interest.
Best Anchor Points for AVWAP:
- Major Swing Highs/Lows – Helps track trend reversals or continuations.
- Earnings Reports – Useful for stocks experiencing significant post-earnings moves.
- High-Impact News Events – Anchoring to major news can show if the move sustains.
- IPO Dates – Helps long-term investors assess fair value levels.
The key is to choose an anchor point that aligns with your trading strategy—day traders may anchor to intraday highs/lows, while swing traders might use weekly or monthly pivots.
Manual Anchoring vs. Automatic Anchoring
When using Anchored VWAP, traders can choose between manual and automatic anchoring methods, depending on their strategy, tools, and trading objectives.
Manual Anchoring gives the trader full control over where to place the AVWAP. This approach is preferred by experienced traders who understand key price action levels, such as swing highs/lows, breakouts, earnings reports, or other significant market events. By manually selecting these points, traders can align the AVWAP with moments of major sentiment shift, ensuring that the analysis is contextually relevant. However, this method requires a solid grasp of technical analysis and market structure, as poorly chosen anchors can result in misleading signals.
Automatic Anchoring, on the other hand, is a feature offered by advanced charting platforms. These tools use algorithms to identify high-probability anchor points—such as local tops, bottoms, or gaps—based on volume, volatility, or other predefined criteria. This can be a huge time-saver and is particularly useful for newer traders or those running multi-asset strategies. The downside is that automated anchors might not always align with the trader’s unique interpretation of market context, and may occasionally miss the nuance that a human eye can catch.
Ultimately, both methods have their advantages. Manual anchoring offers precision and flexibility, while automatic anchoring provides efficiency and consistency. Many traders combine both, using automation for initial scans and then refining anchor points manually for specific setups.
Anchored VWAP Calculation
The Anchored VWAP (AVWAP) is calculated similarly to the traditional VWAP, but starts from a user-defined anchor point instead of resetting daily. The formula is:
AVWAP = (∑ Price × Volume) / ∑ Volume
This means it weights prices by volume from the selected anchor point—such as a swing high, earnings report, or breakout—up to the current time. By anchoring to a significant event, traders gain a clearer picture of how the market has priced an asset since that moment, helping to identify key support and resistance levels. It’s adaptable across timeframes, making it valuable for both short-term and long-term strategies.
VWAP Formula
The VWAP line (Volume Weighted Average Price) formula is:
VWAP = (∑ Price × Volume) / ∑ Volume
It calculates the average price of an asset throughout the trading day, weighted by volume. This helps traders see whether they’re getting a good deal relative to the day’s trading activity—buying below VWAP is generally seen as favorable, while selling above it can indicate strength.
Anchored VWAP example
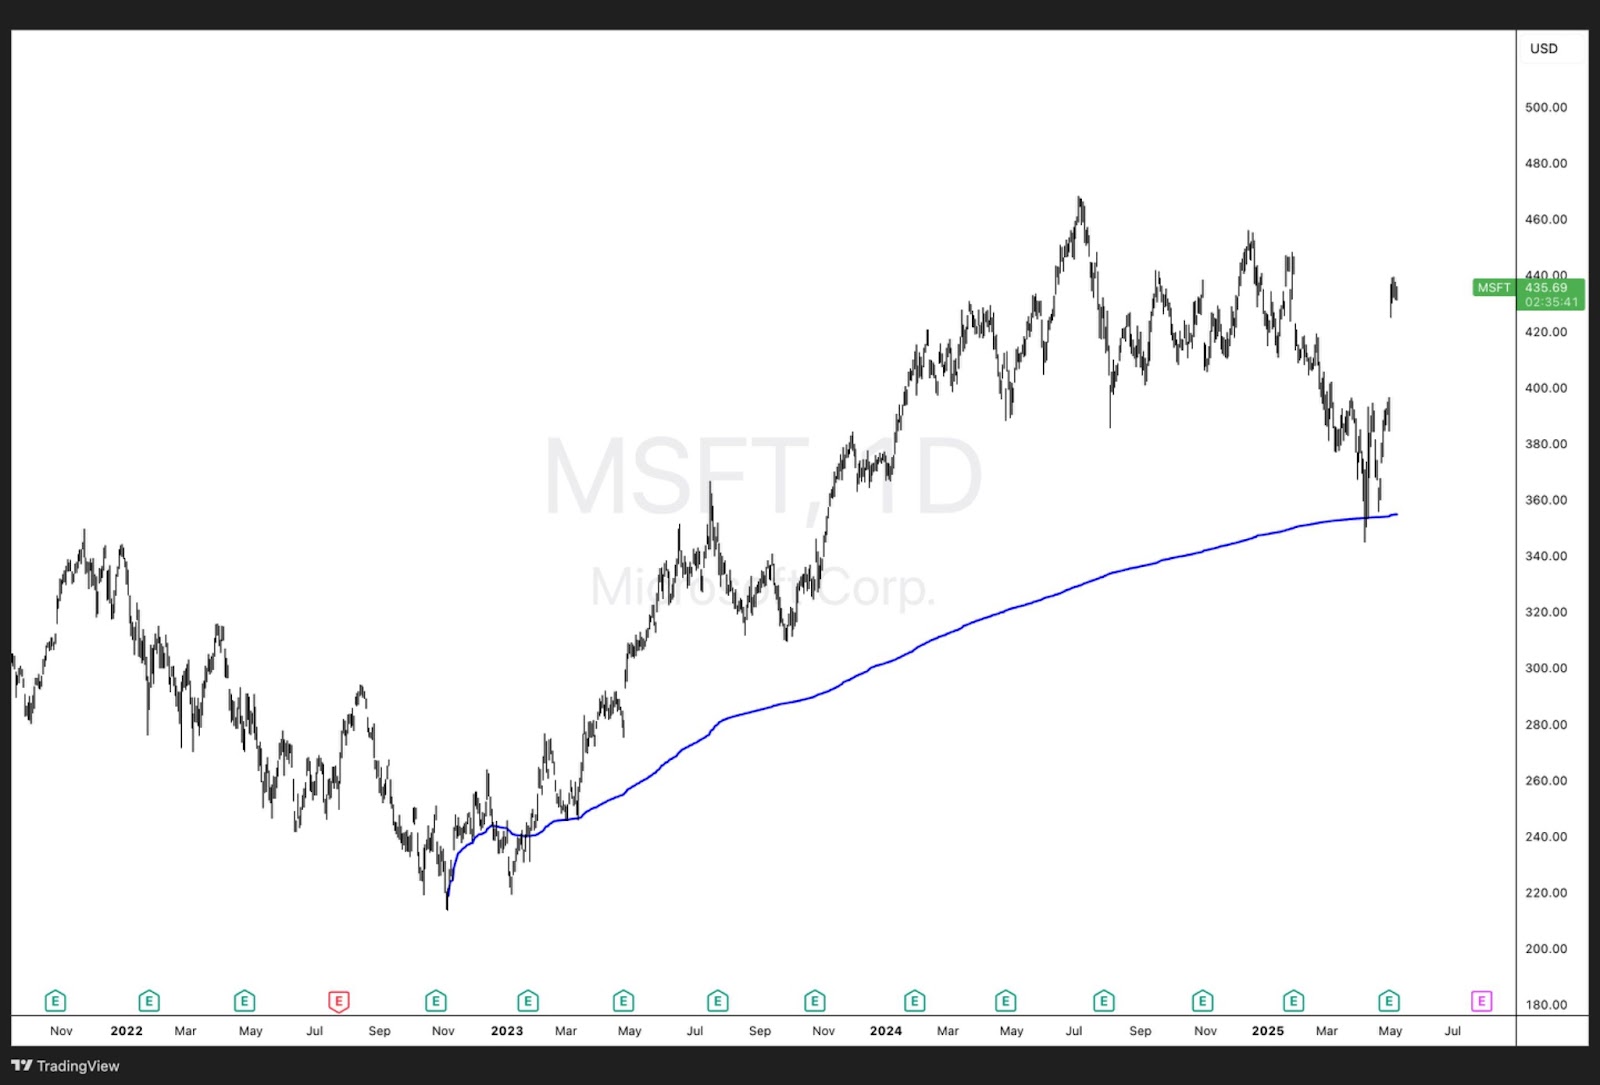
A great real-world example of Anchored VWAP in action can be seen in the chart of Microsoft (MSFT). In this case, the AVWAP is anchored to a major swing low around the end of 2022—a point that marked a clear shift in market sentiment following a prolonged downtrend.
As price began to recover from that low, the AVWAP (depicted by the blue line) served as a dynamic support level throughout the uptrend. Notice how price consistently traded above the anchored VWAP for most of 2023 and into 2024, confirming strong bullish momentum. Even during periods of moderate corrections or pullbacks, the stock repeatedly found support near the anchored VWAP, indicating continued buyer interest and validating the level’s significance.
Most recently, in early 2025, MSFT experienced a notable pullback. Yet again, price found support right at the anchored VWAP before rebounding strongly—further highlighting how institutional participants may be respecting this level. This kind of behavior illustrates why anchoring the VWAP line to key swing lows can be an effective strategy for identifying high-probability support zones and trend continuation opportunities.
Manual Anchor Points Example
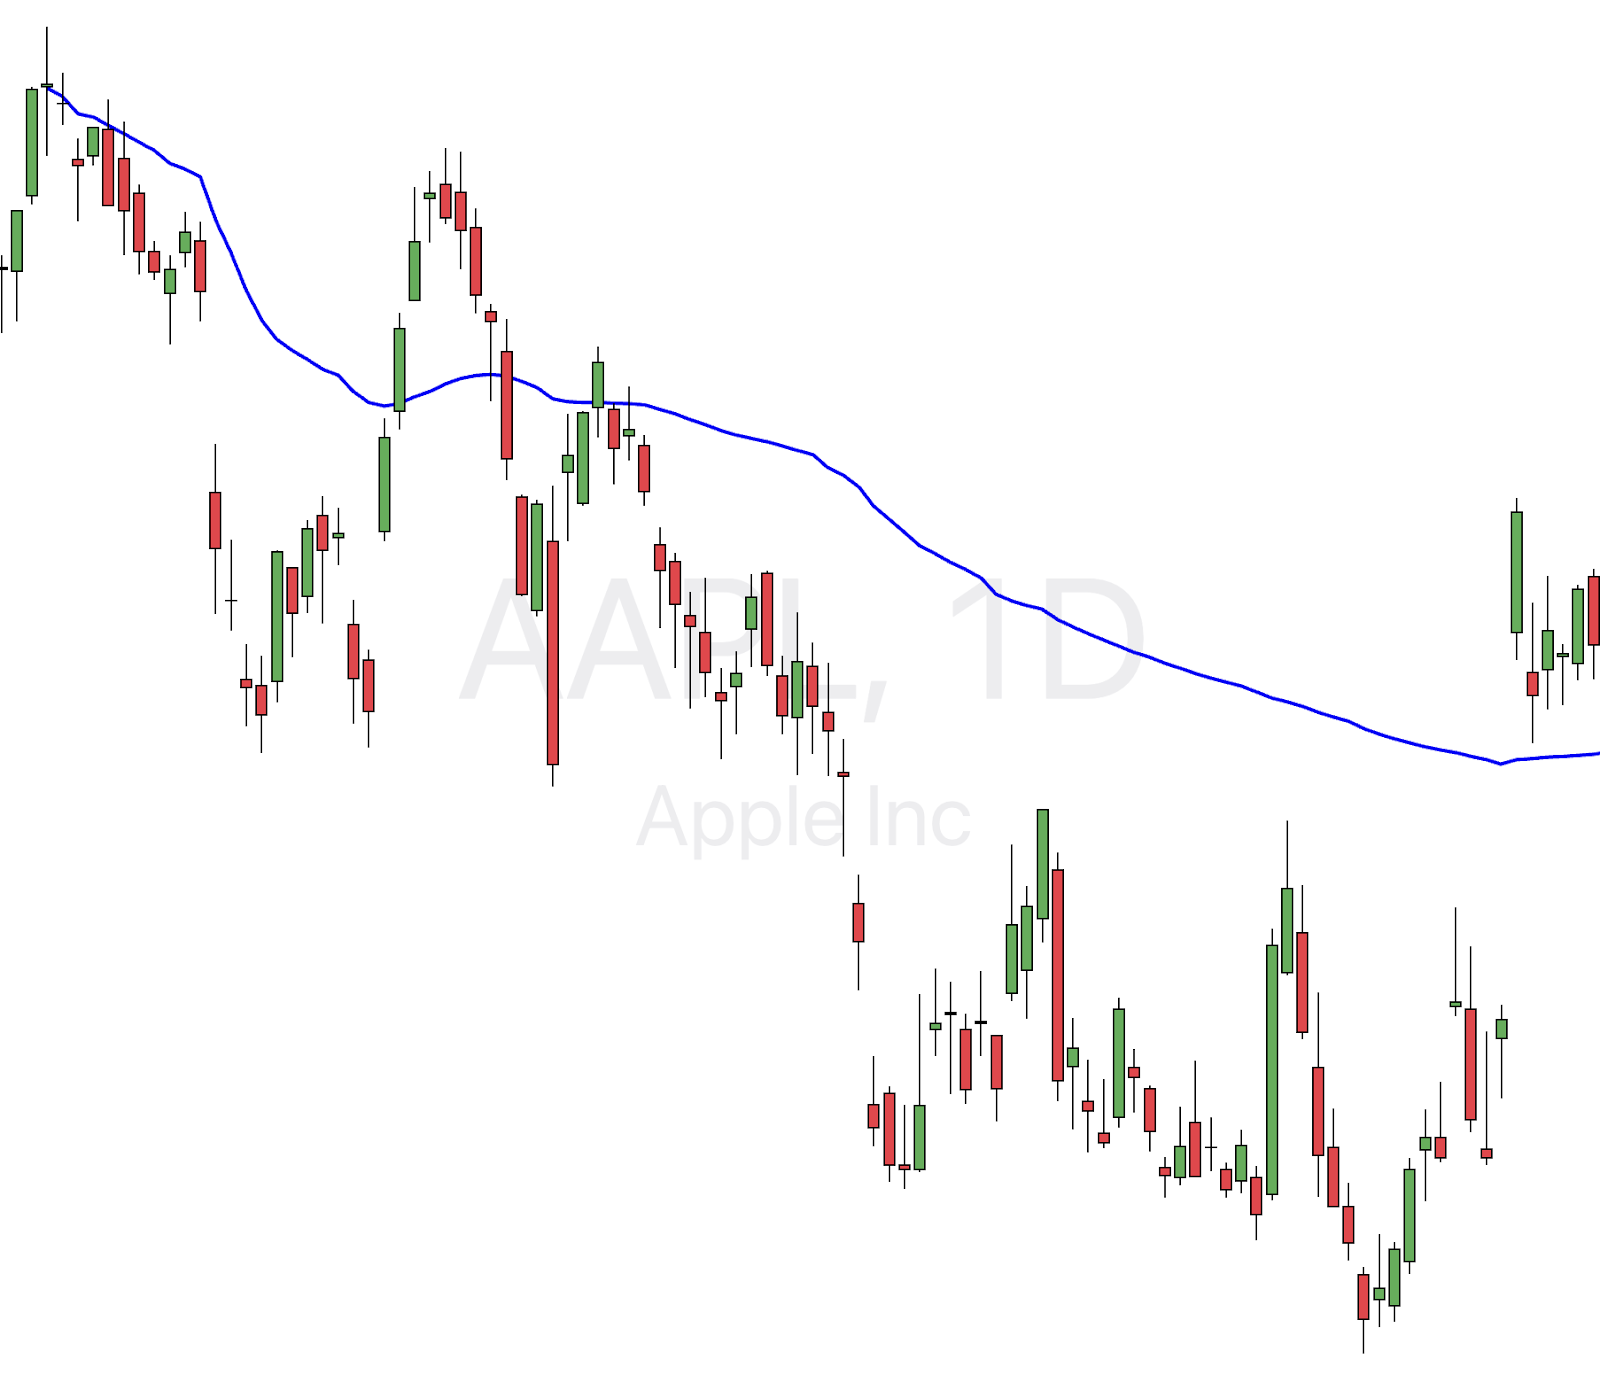
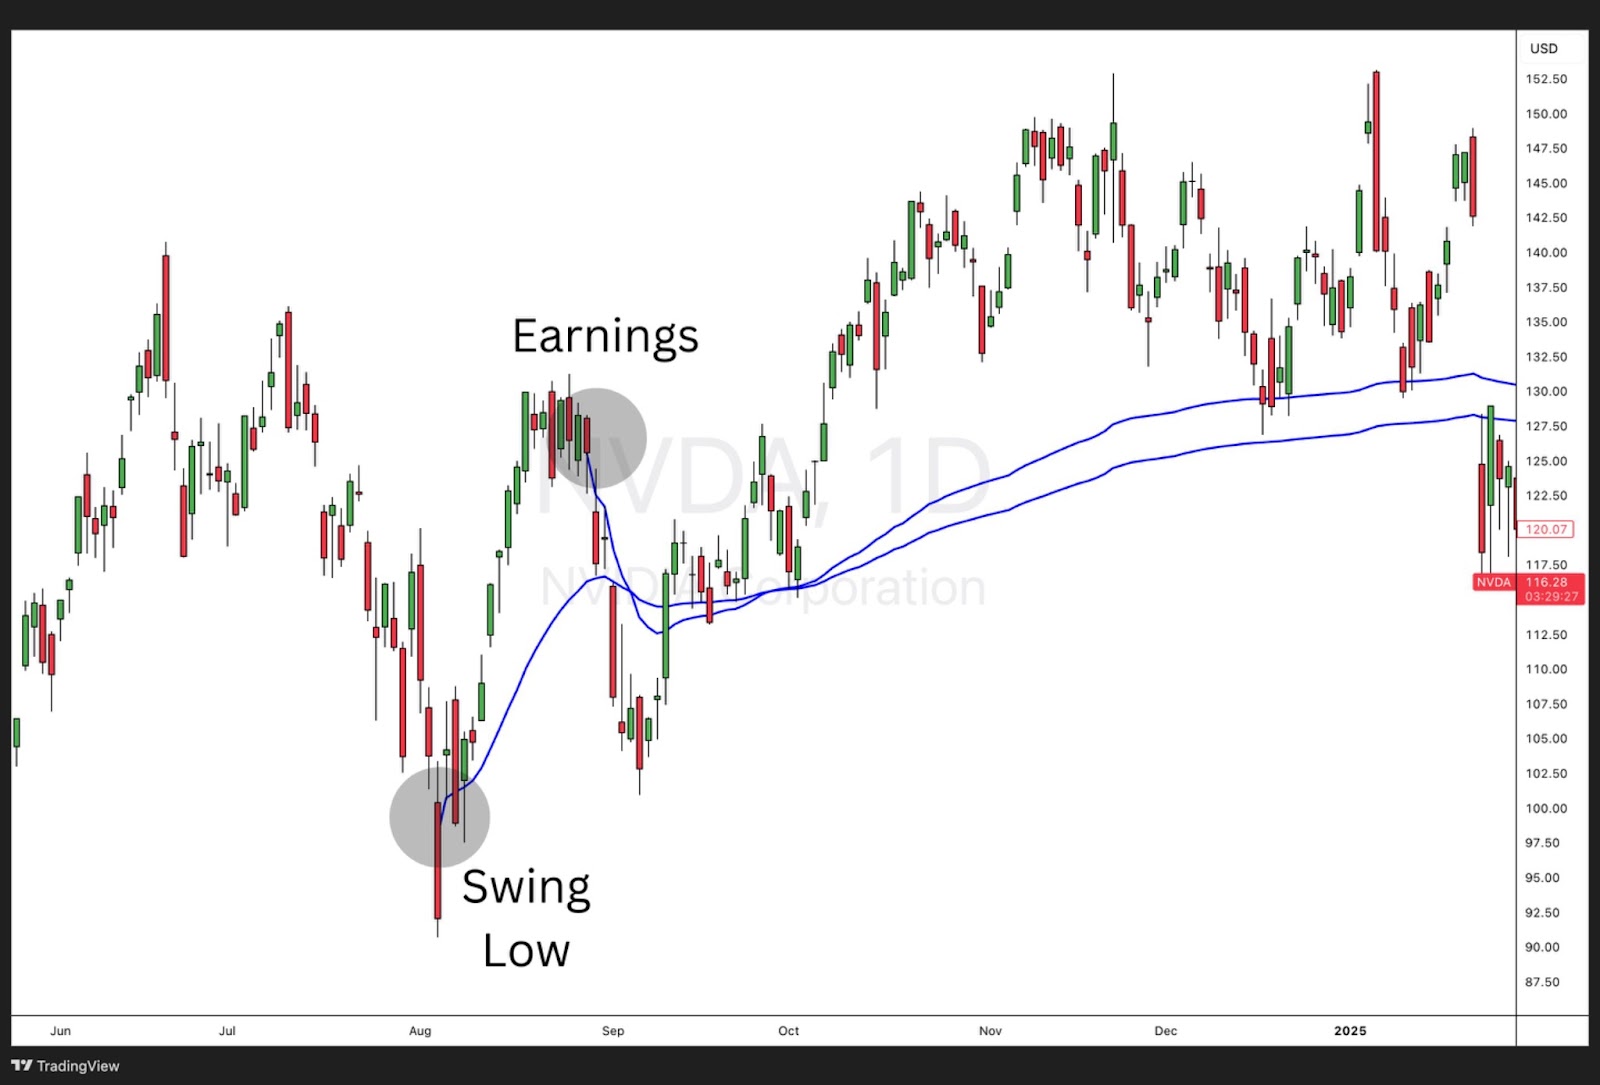
Major Swing Highs or Lows – Key Reversal Zones or Trend Continuation Levels
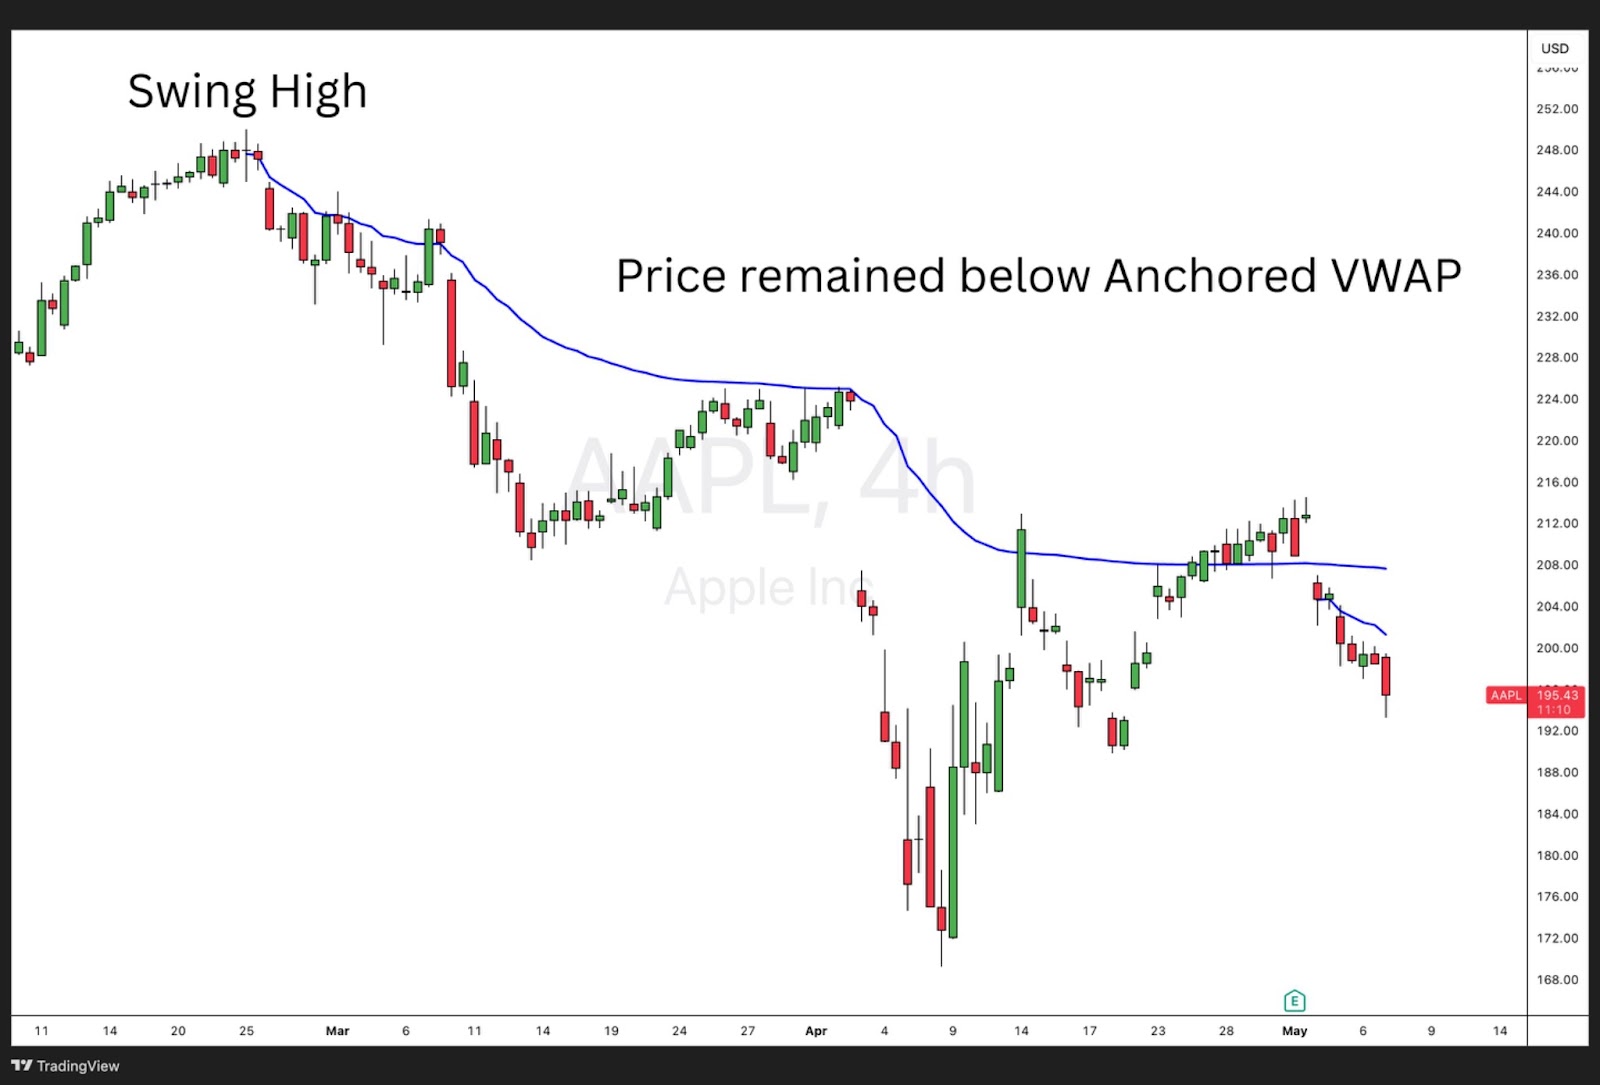
Anchoring VWAP to a major swing high or low allows traders to gauge how the market is behaving relative to critical inflection points. When price remains above the anchored VWAP from a swing low, it often suggests strong buying interest and ongoing bullish momentum. Conversely, if price stays below the AVWAP from a swing high, it signals persistent selling pressure. This strategy helps confirm trend direction and offers high-confidence entry and exit points by aligning trades with dominant market sentiment.
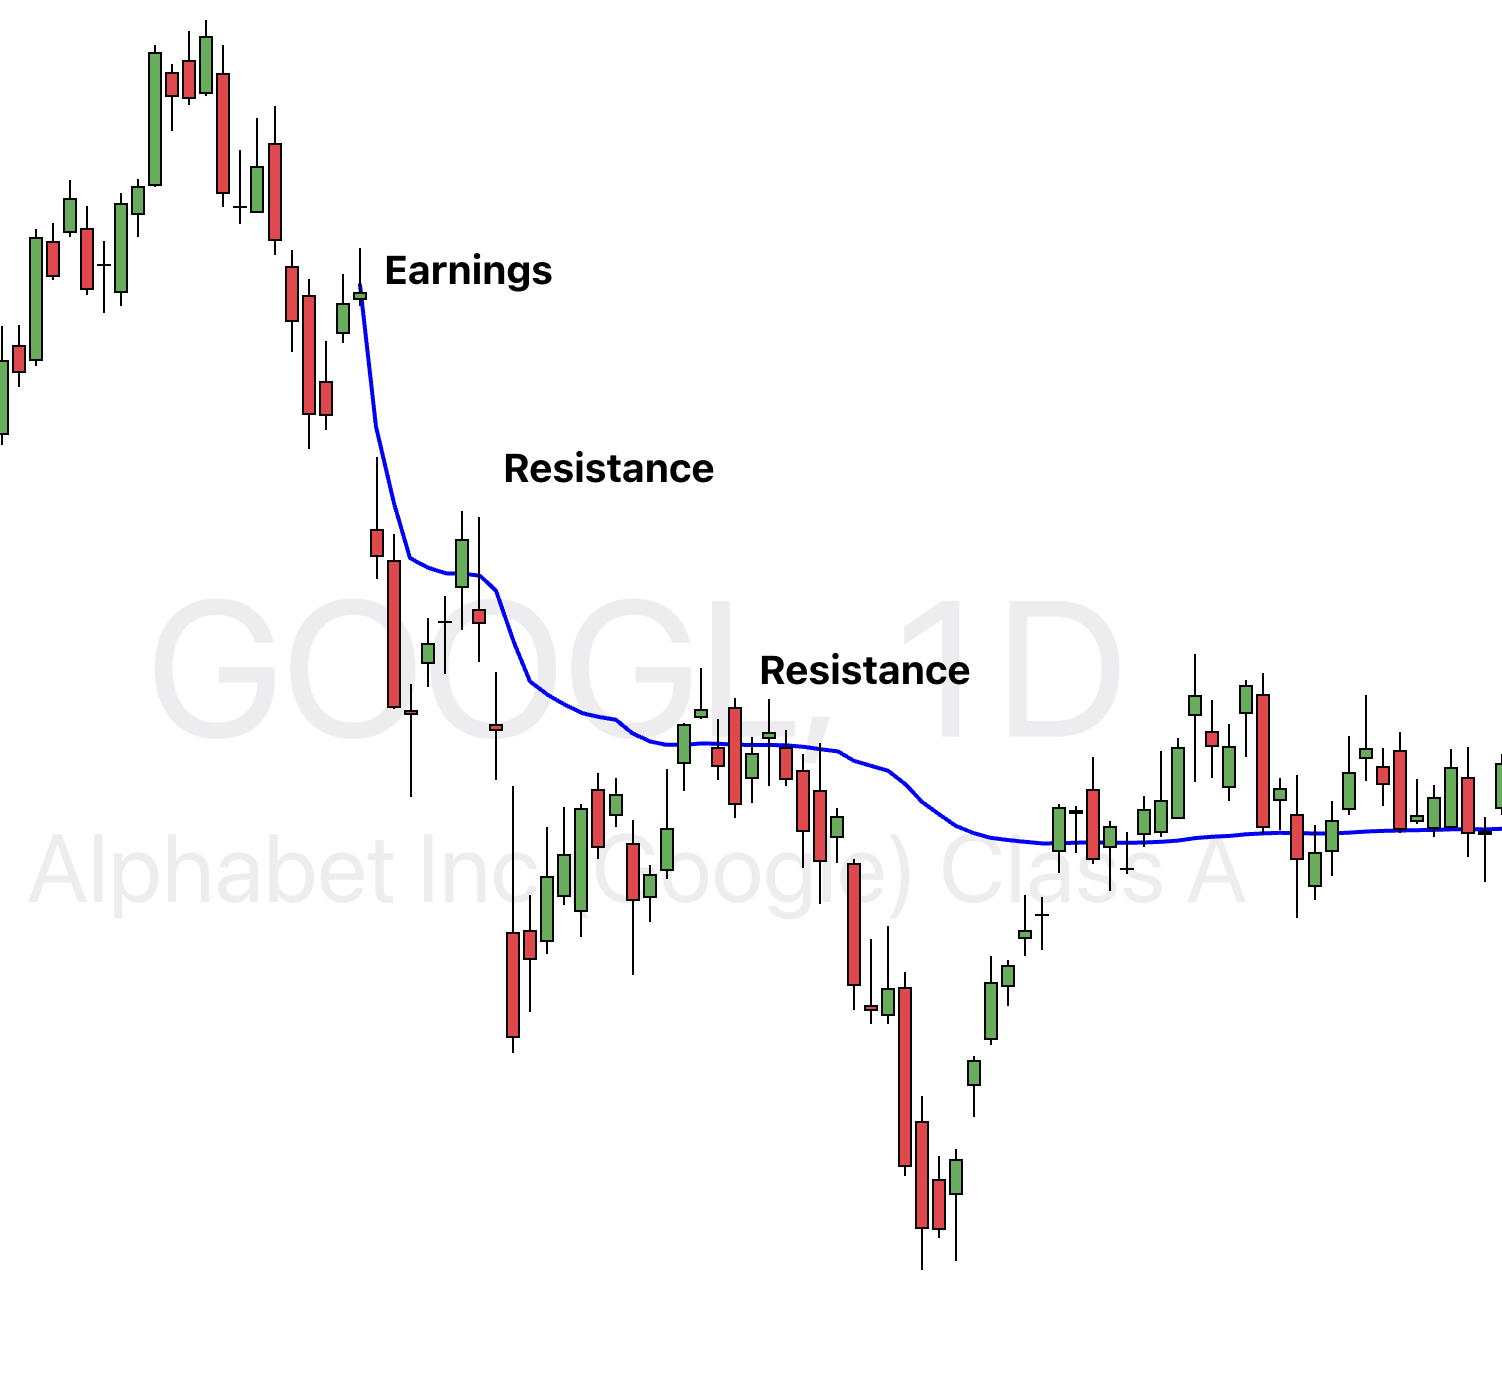
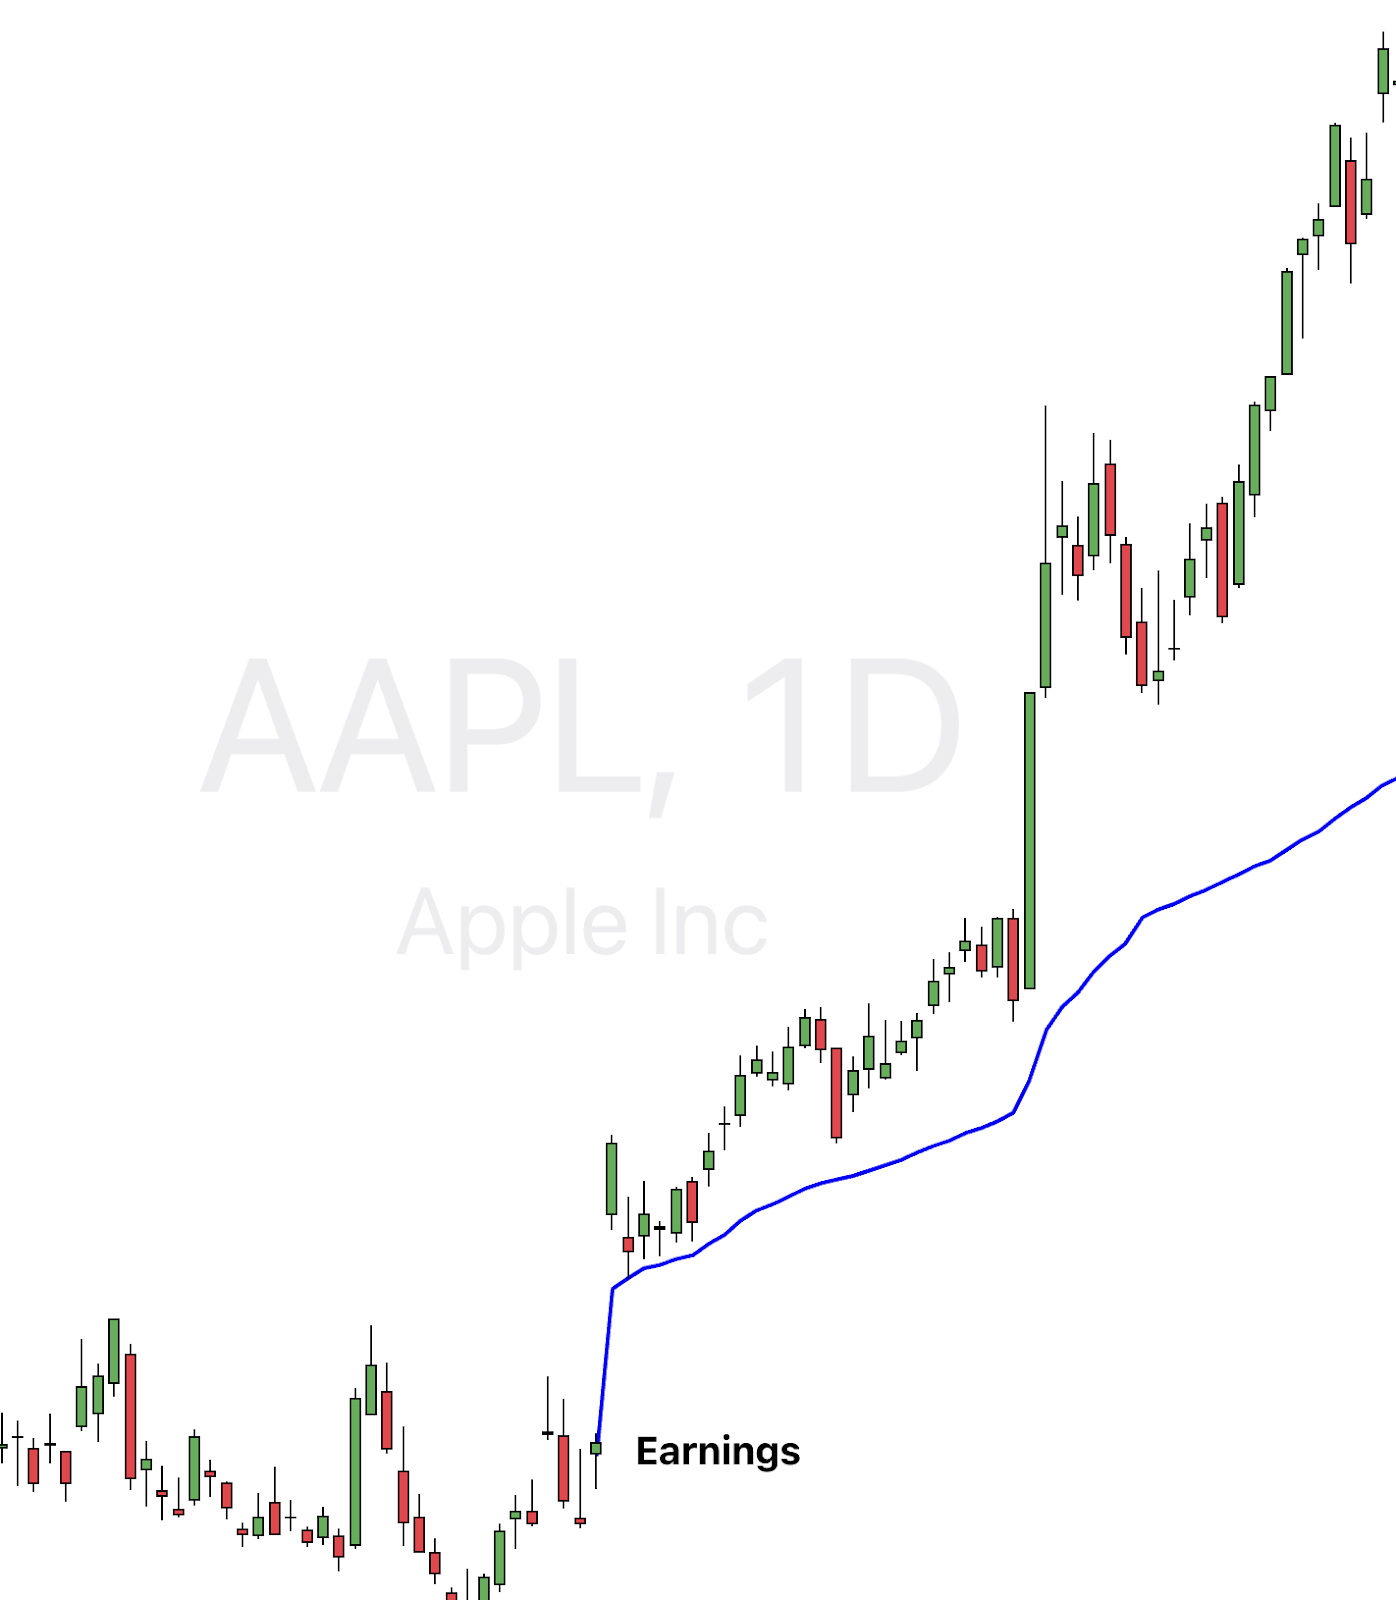
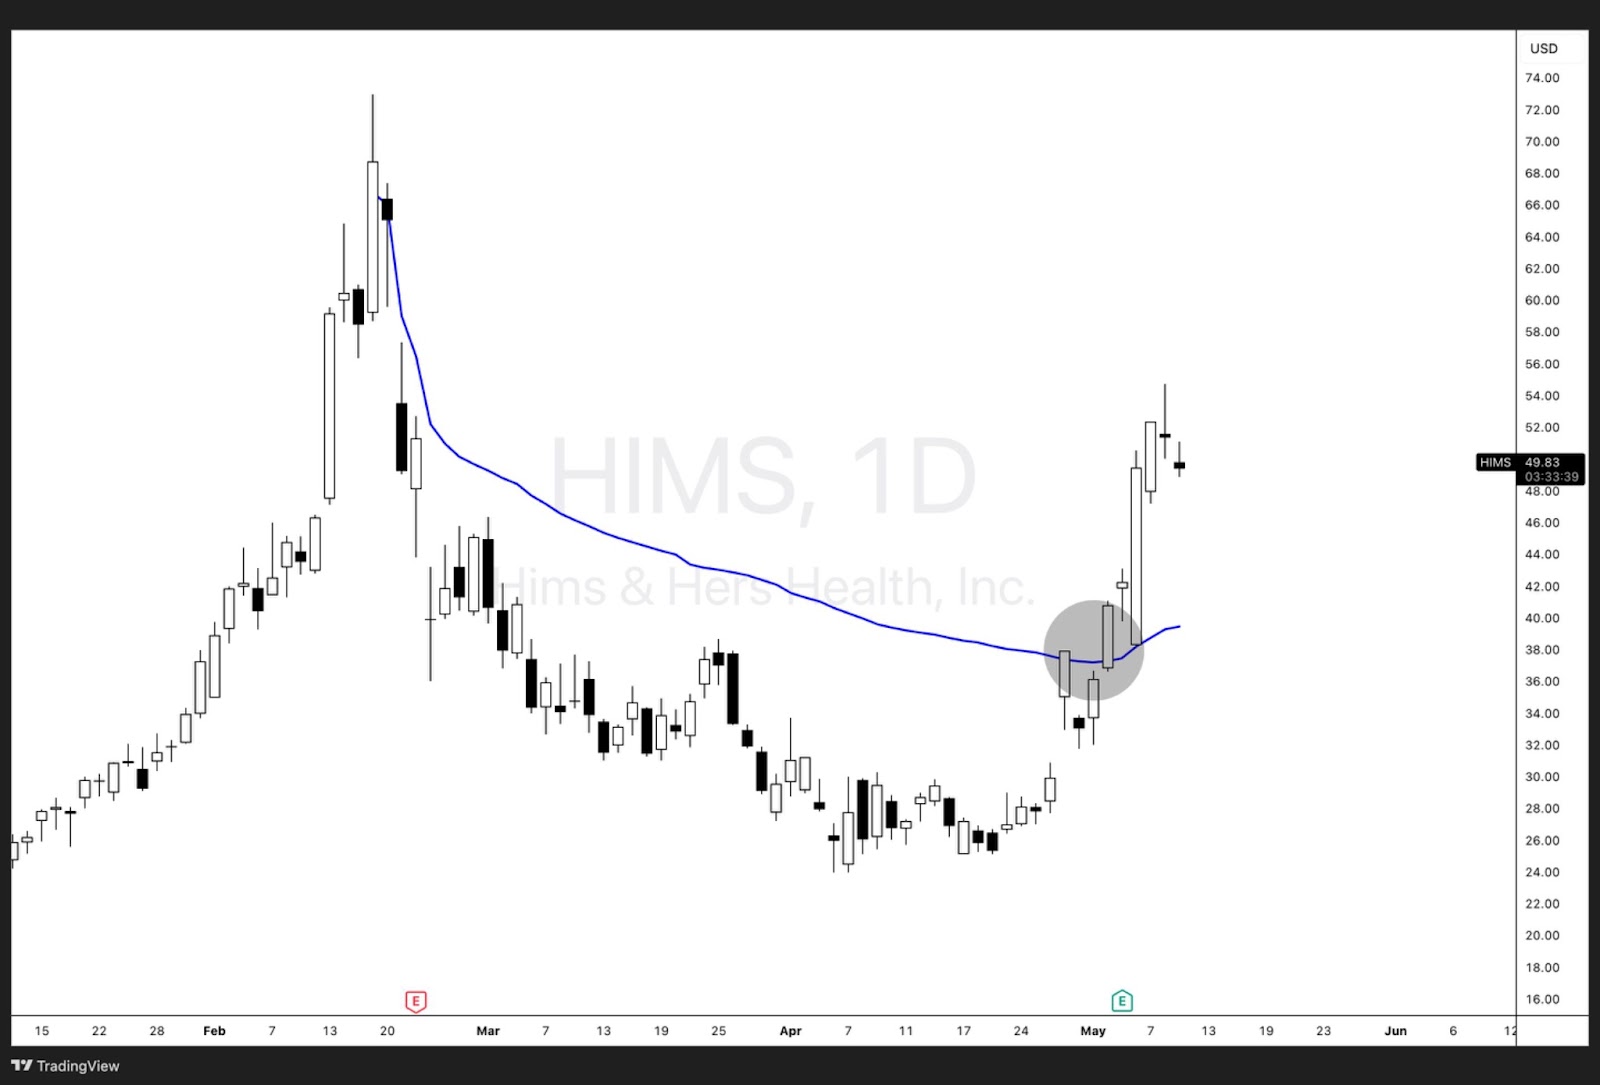
Earnings Reports – Especially When Price Reacts Strongly Post-Announcement
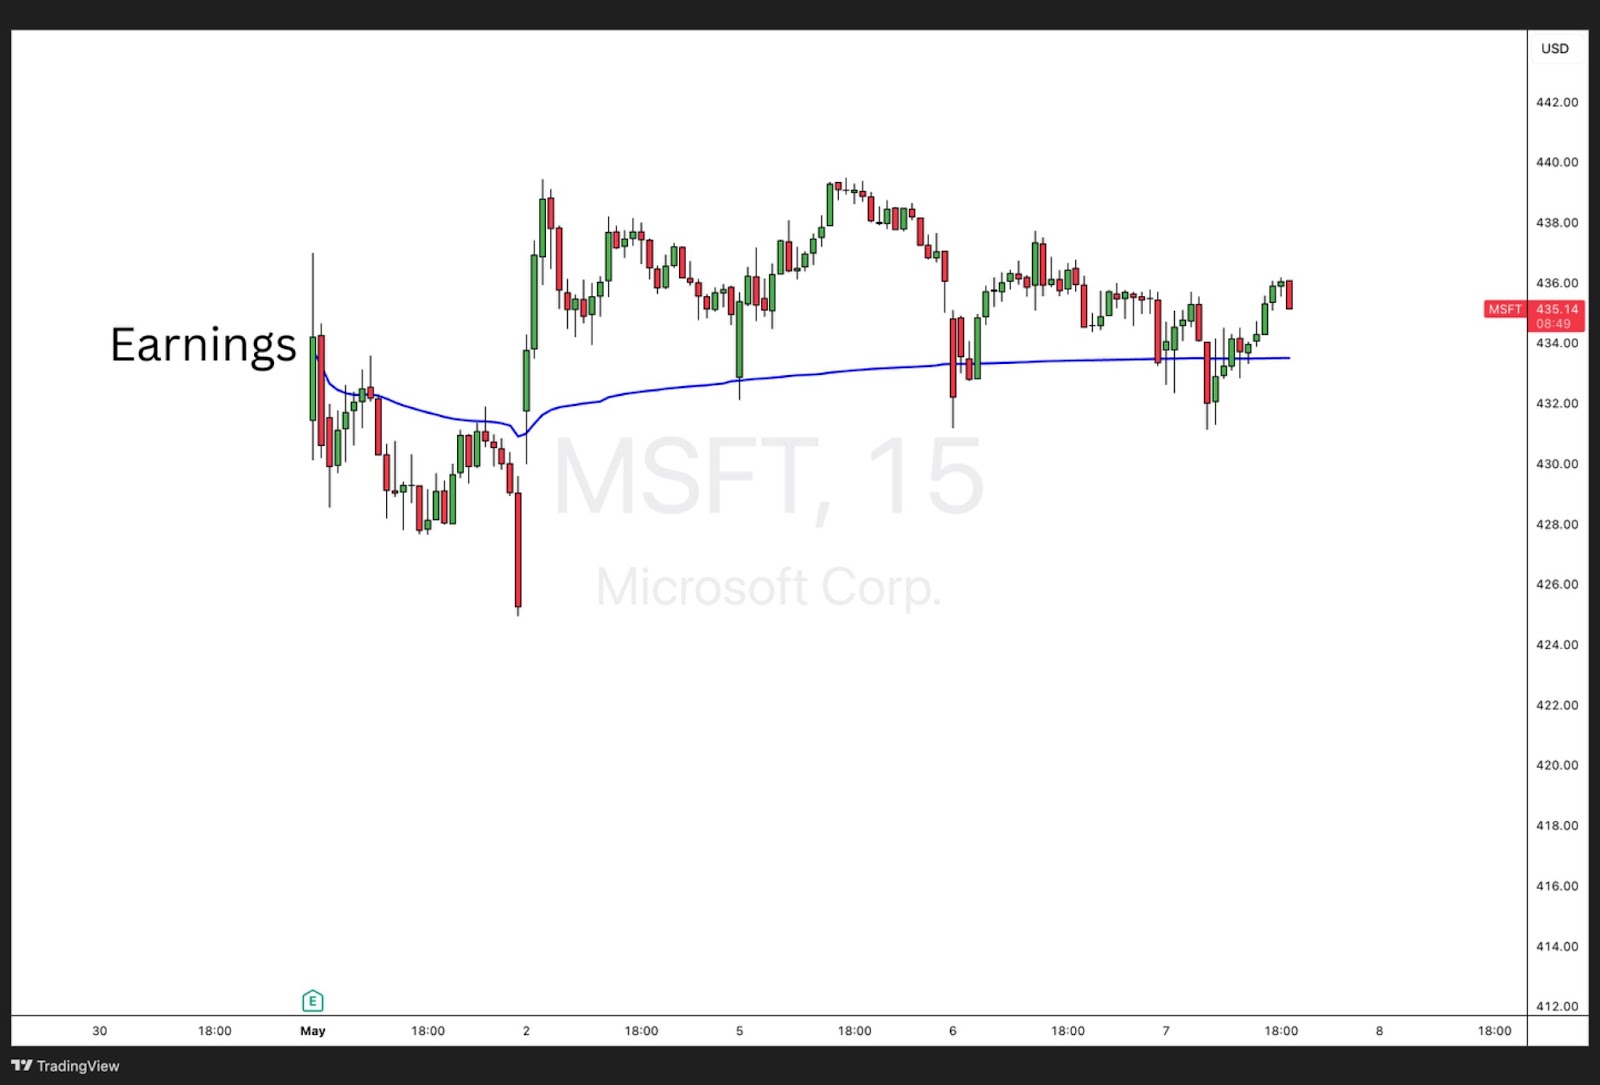
Earnings releases are high-impact events that often cause significant shifts in stock price and volume. By anchoring VWAP to the earnings announcement date or the opening candle following the report, traders can track institutional response to the news. If price holds above the AVWAP anchored to earnings, it typically indicates positive sentiment and possible accumulation. A breakdown below this level, however, may suggest disappointment and increased risk. This method offers an objective way to measure post-earnings trend strength and validate breakout or breakdown moves.
Breakouts or Breakdowns – From Consolidation or Key Resistance/Support Zones
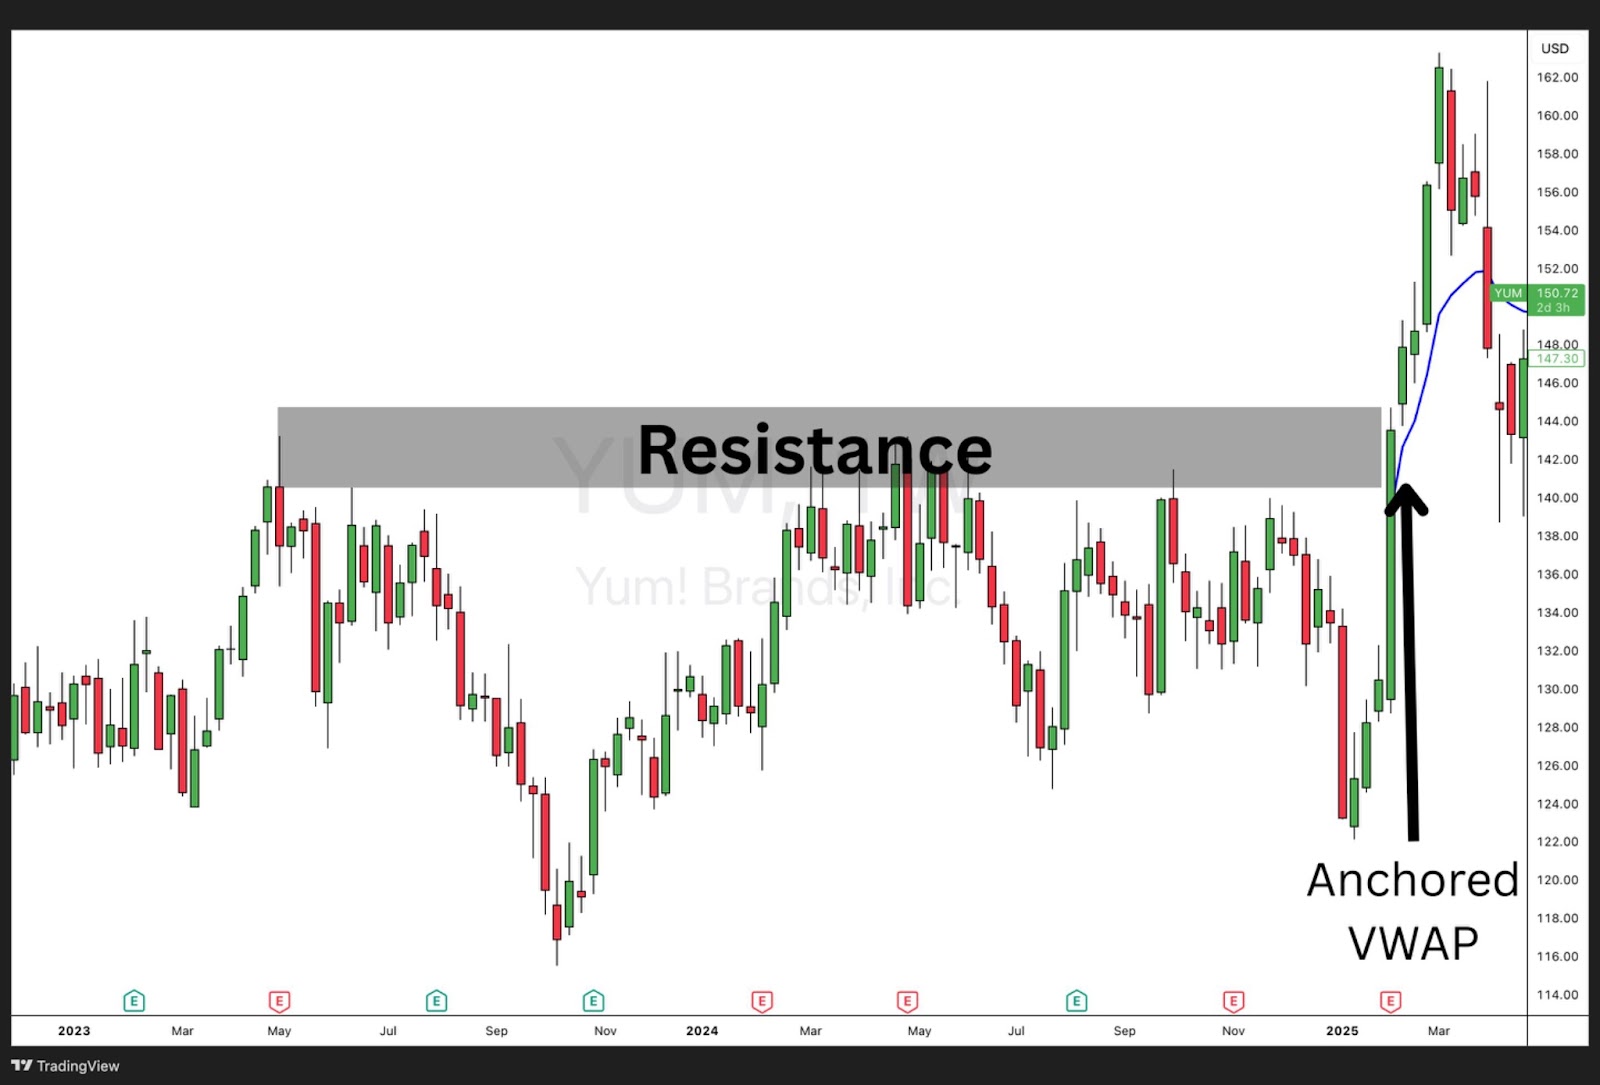
When a stock breaks out above resistance or falls below support, anchoring VWAP to the breakout or breakdown point can help confirm whether the move is sustainable. Price remaining above an AVWAP anchored to a breakout level reinforces the strength of the bullish move and helps define pullback entries. Similarly, anchoring to a breakdown point and watching price reject that AVWAP from below can validate bearish momentum. This strategy is especially useful for timing entries with clear risk management levels in trend-following setups.
Anchored VWAP Trading Strategies
Anchored VWAP is more than just a line on a chart—it’s a strategic tool that adapts to multiple trading styles and timeframes. By anchoring the VWAP to significant events or price levels, traders can unlock deeper insights into market sentiment and behavior. Whether you’re a scalper or long-term investor, integrating AVWAP into your strategy can help confirm trends, identify precise entries, and manage risk more effectively. Below are some powerful ways to apply Anchored VWAP across various strategies and technical setups.
Choose a meaningful anchor point
The effectiveness of AVWAP hinges on selecting the right starting point. Anchor to significant events like swing highs/lows, earnings, breakouts, or news-driven candles where volume surges. This ensures the VWAP reflects true market interest and institutional activity from that key moment.
Use it as a potential support or resistance level

AVWAP often acts as dynamic support or resistance. When price approaches it from above, it may find support; from below, it may face resistance. This provides traders with logical zones for entries, exits, and stop placements.
Use it to identify breakouts or breakdowns
Anchor the VWAP line to the breakout or breakdown candle. If price holds above (or below) the AVWAP after the move, it confirms strength and continuation. Failure to hold suggests a false breakout or reversal.
Use multiple Anchored VWAPs
Layering AVWAPs from different events—like a swing low and an earnings date—gives a multi-dimensional view of price structure. When several AVWAPs converge, that area becomes a high-confluence zone for potential reversals or consolidations.
Anchored VWAP with RSI
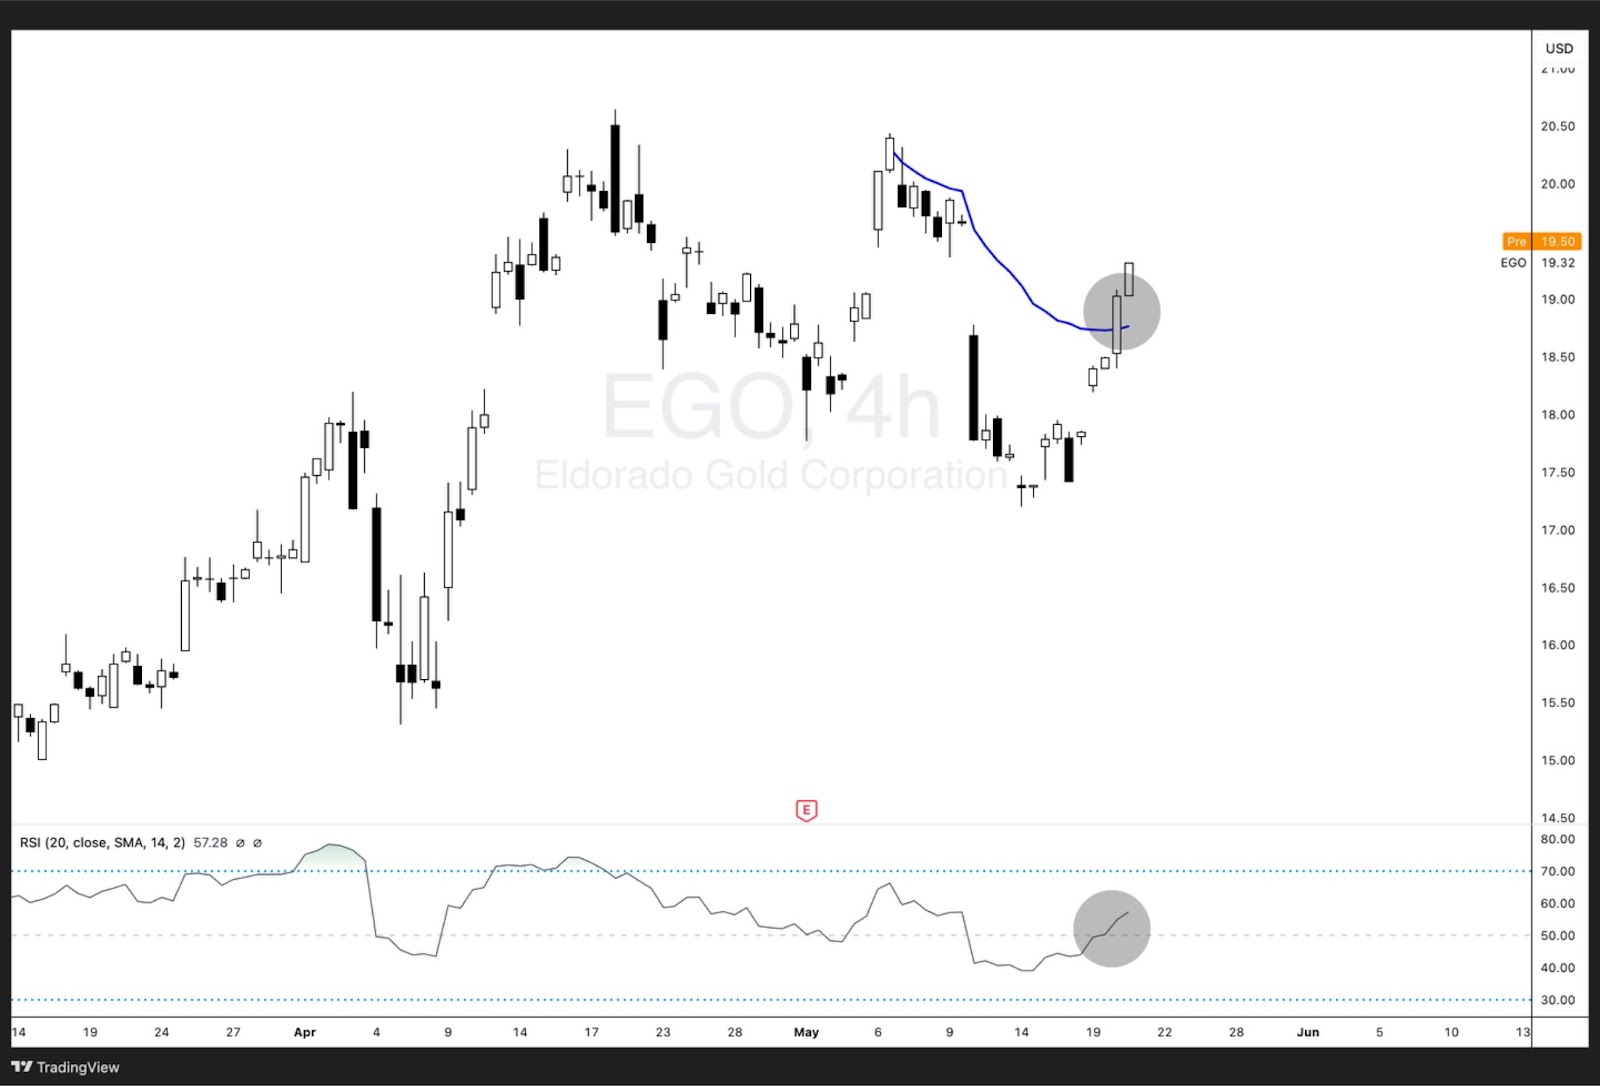
Combine AVWAP with RSI to filter trades. For example, if price is above AVWAP and RSI shows strength (above 50), it supports bullish momentum. Conversely, AVWAP rejections combined with RSI divergence can signal weakening trends.
Anchored VWAP with MACD
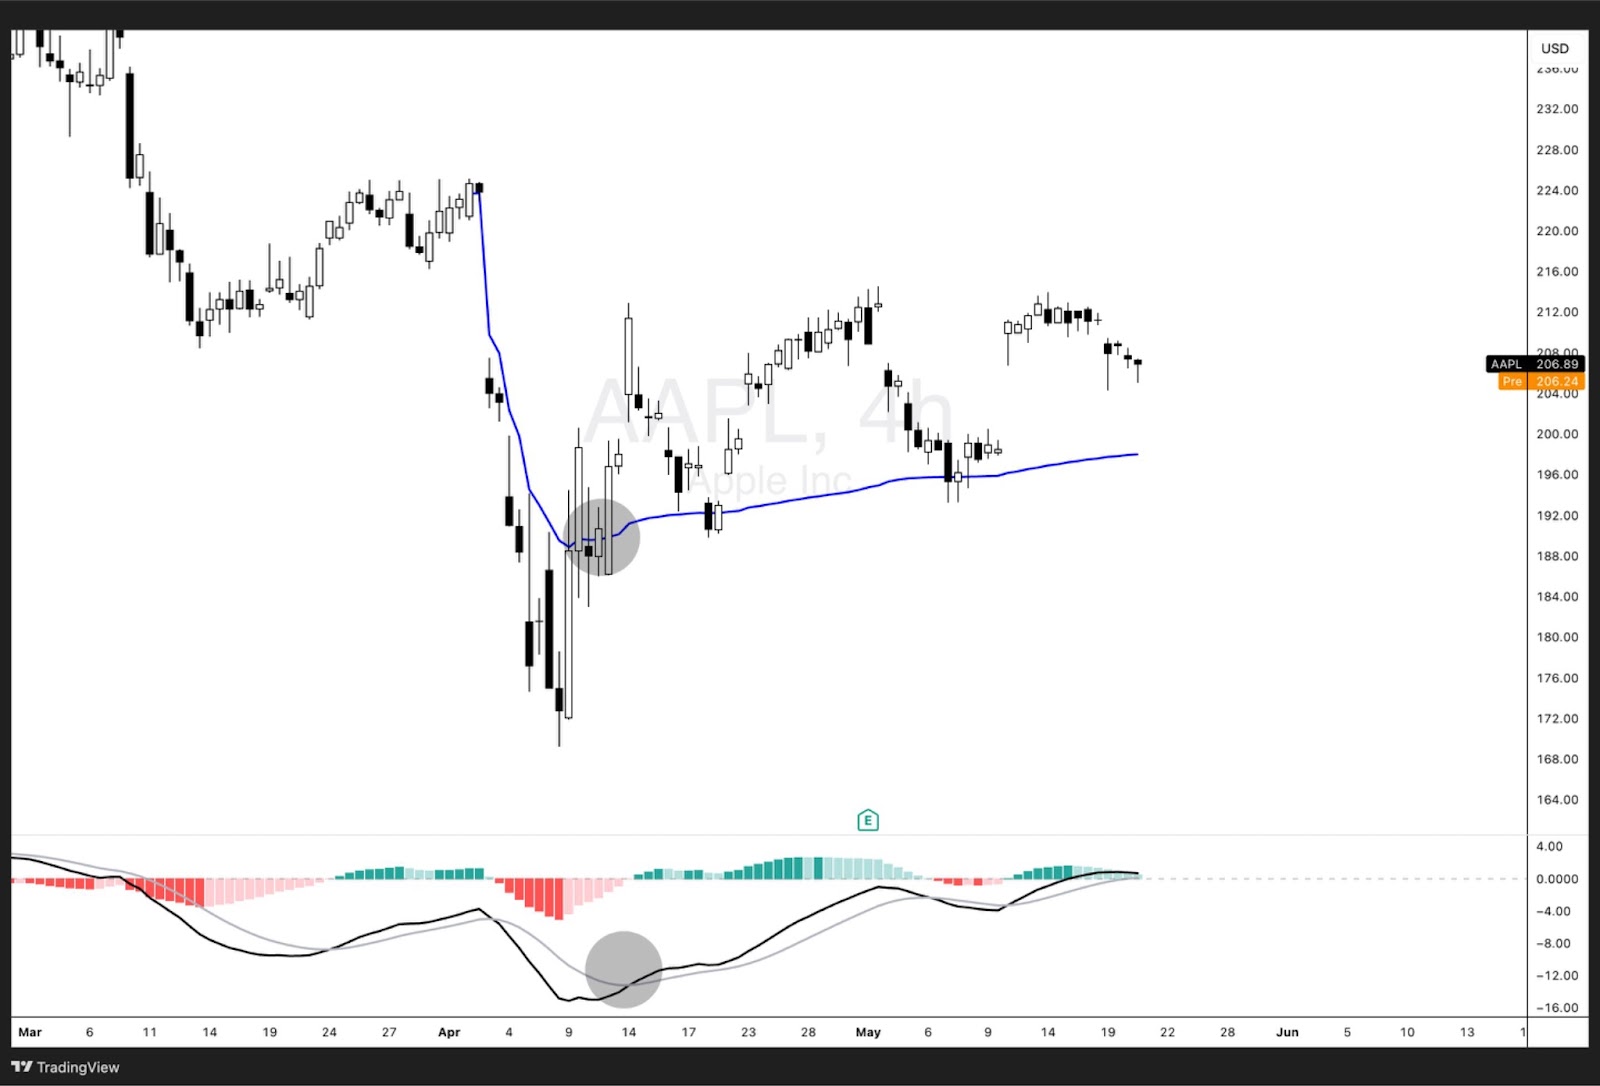
Use MACD crossovers in conjunction with AVWAP interactions. A bullish MACD crossover while price bounces from AVWAP increases confidence in trend continuation. A bearish crossover near AVWAP resistance suggests possible reversal.
Anchored VWAP with Fibonacci retracement
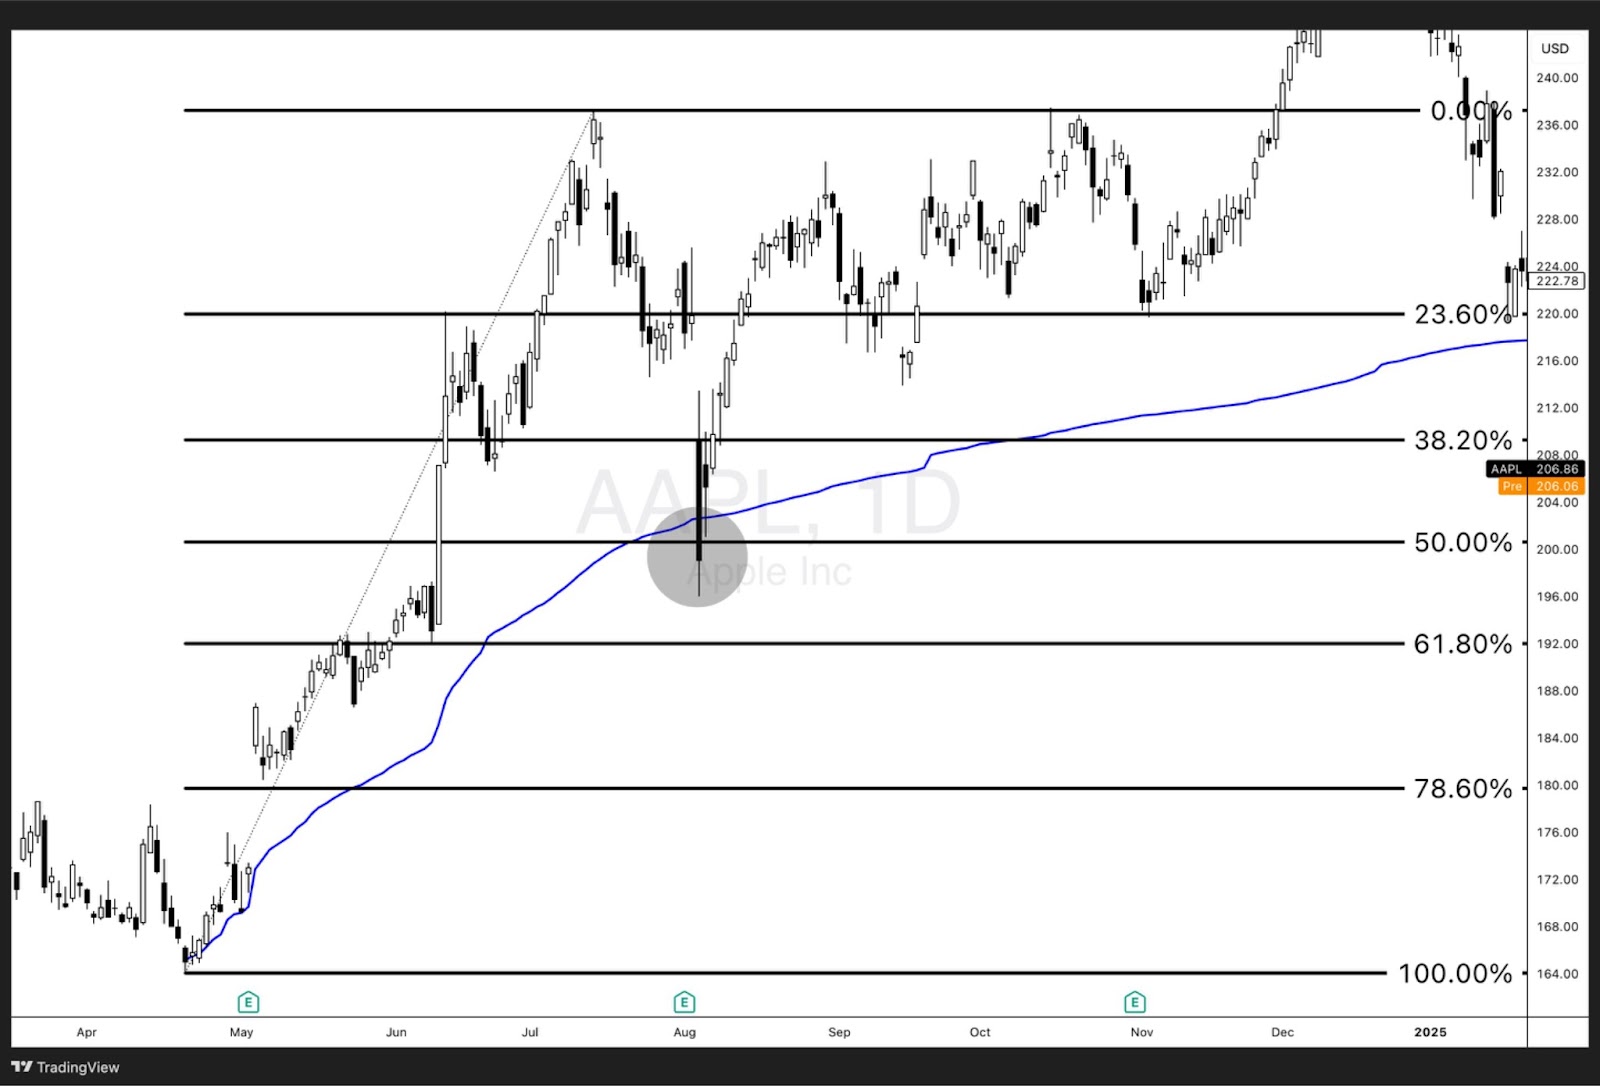
Overlay Fibonacci retracement levels with AVWAP to pinpoint high-probability zones. When retracement levels align with the anchored VWAP, it strengthens the level’s significance as support or resistance.
Anchored VWAP with Moving Averages
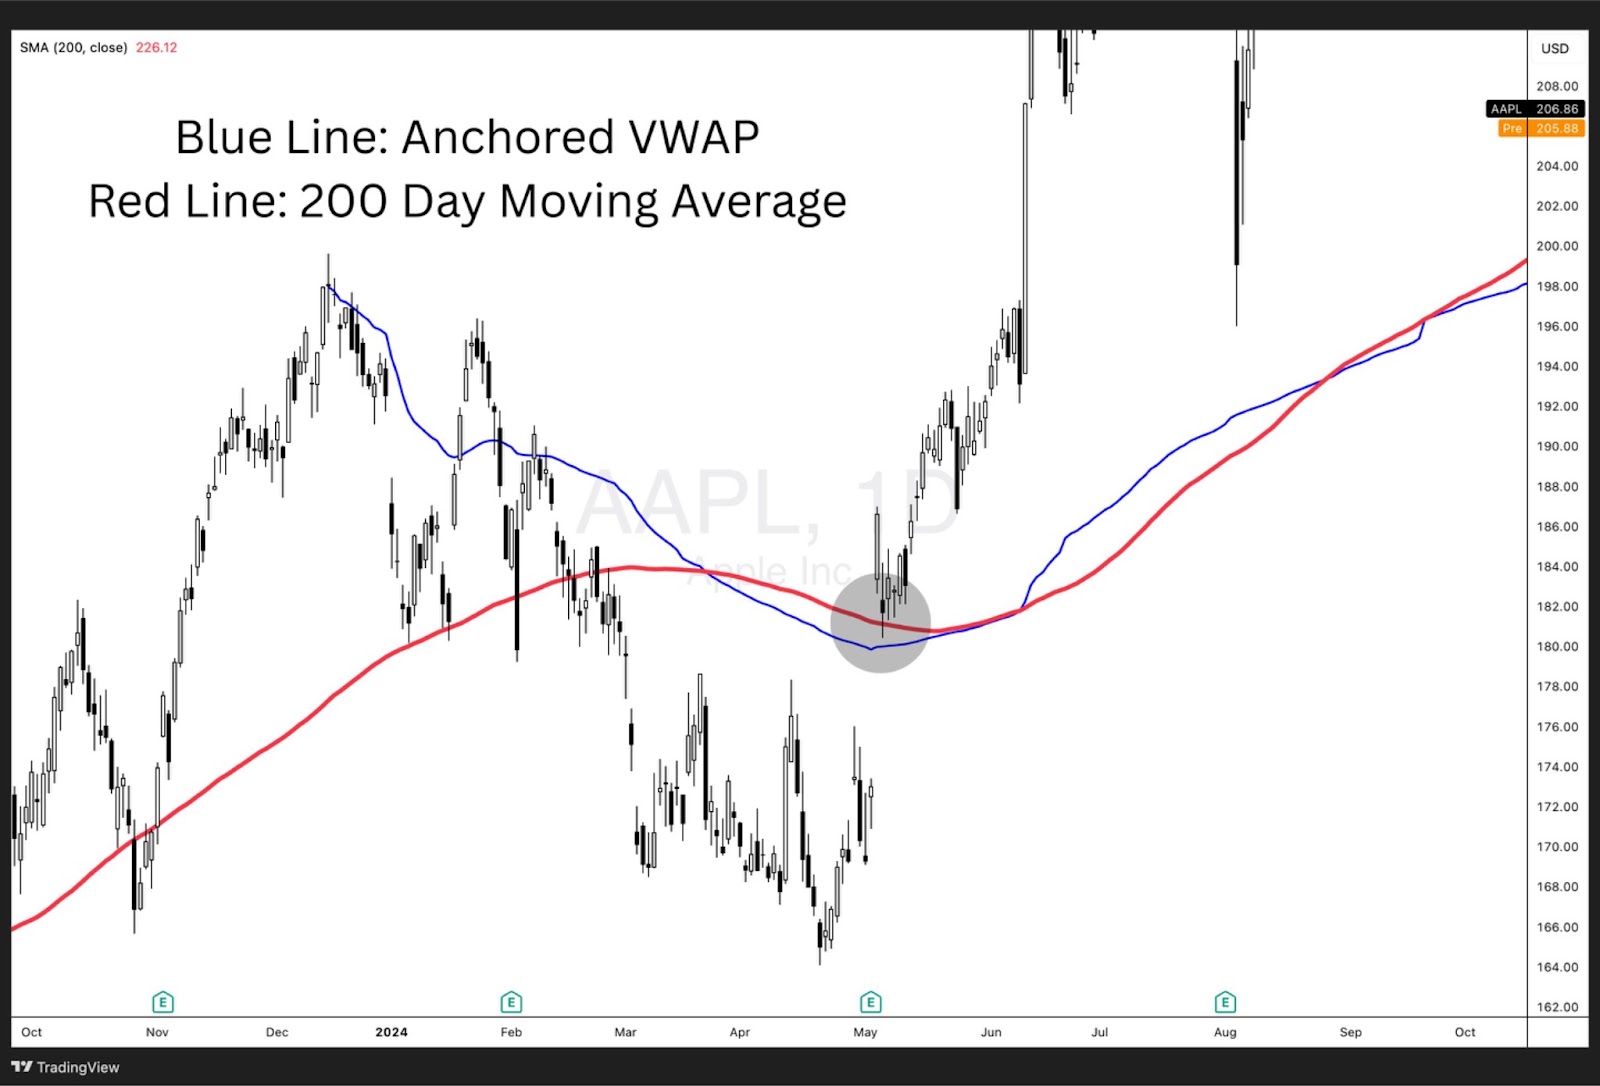
When AVWAP aligns with key moving averages (like the 50- or 200-day MA), it reinforces trend direction. A crossover or confluence with a moving average can serve as an added layer of validation for entries.
Anchored VWAP with Bollinger Bands
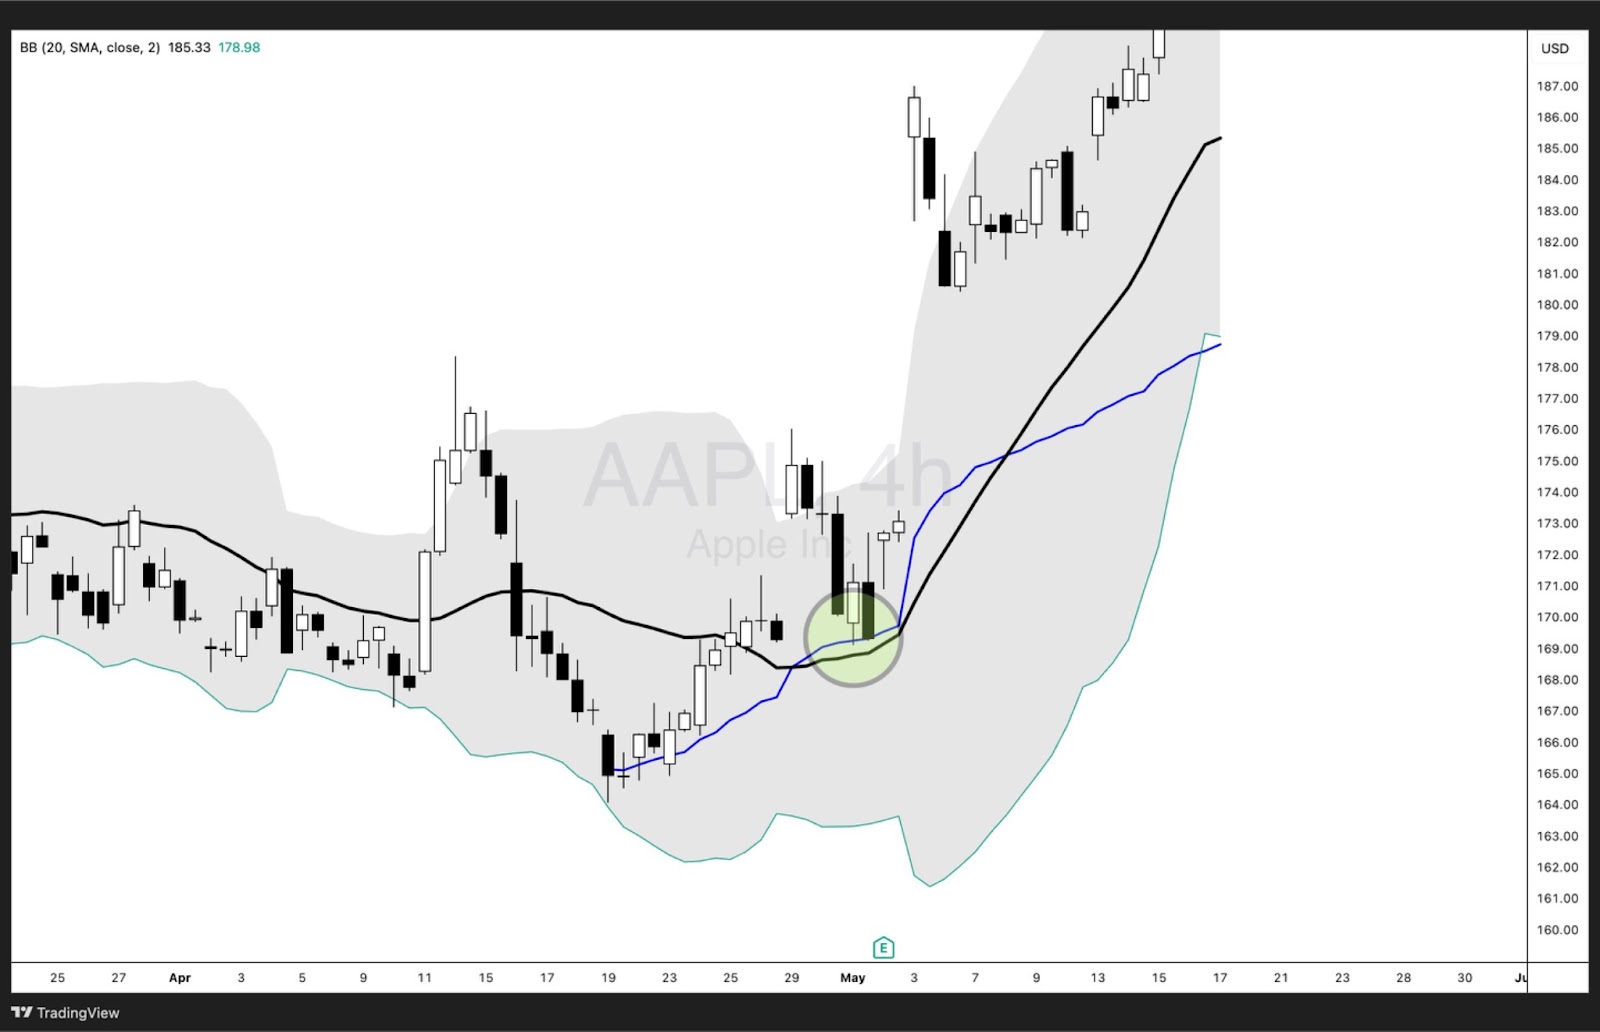
Price moving outside Bollinger Bands® but pulling back to AVWAP offers a balanced mean-reversion setup. AVWAP serves as the “true” mean, particularly in volatile markets.
Anchored VWAP Algorithmic Trading
In quant strategies, AVWAP is often programmed as a benchmark to detect accumulation/distribution or momentum shifts. It’s used to trigger entries, exits, or filter trades based on position relative to the AVWAP.
Anchored VWAP Scalping Strategy
Scalpers can anchor to the day’s opening candle or first high-volume move. Quick bounces from AVWAP offer tight-risk entries. The strategy works best with strong volume confirmation and fast-moving instruments.
Anchored VWAP Day Trading
Day traders anchor to the opening range or previous day’s high/low. AVWAP helps gauge intraday sentiment and structure, allowing traders to time breakouts, pullbacks, or reversals with precision.
Anchored VWAP Swing Trading
Swing traders benefit by anchoring to major events like earnings or multi-day consolidation breakouts. This lets them ride broader trends and use AVWAP as a dynamic trail stop or re-entry level.
Anchored VWAP Trend Following
For trend followers, anchoring to the beginning of a trend or a macro event helps define the trend’s strength. If price remains consistently above AVWAP, it signals trend continuation. A breakdown below it may warn of reversal or weakening momentum.
Advantages of The Anchored VWAP
The Anchored VWAP (AVWAP) offers several key advantages that make it a favored tool among professional traders and institutions alike:
1. Contextual Accuracy
Unlike the traditional VWAP line that resets daily, AVWAP allows traders to start calculations from any significant price point. This results in more accurate, event-driven insights that reflect real market sentiment following catalysts like earnings, breakouts, or news releases.
2. Objective Support and Resistance Levels
AVWAP creates volume-weighted price levels that are less arbitrary than traditional horizontal support/resistance lines. When price reacts consistently around an anchored VWAP line, it confirms that level’s importance to market participants.
3. Visibility into Institutional Activity
Institutions often accumulate or distribute positions gradually, but each time they trade it is in large volumes. Those large volumes flow through into AVWAP. Anchoring VWAP to a breakout or news event can reveal whether price is being supported or rejected by institutional flows, offering retail traders a glimpse into smart money behavior.
4. Versatility Across Timeframes and Strategies
Whether you’re a scalper, swing trader, or long-term investor, AVWAP can be tailored to your strategy. It can be anchored to intraday events or multi-year price pivots, making it universally applicable.
5. Enhanced Trade Timing and Risk Management
Using AVWAP helps define clearer entry and exit points with logical stop-loss placements. When price tests the anchored VWAP, traders can enter with high conviction and tight risk controls based on how price reacts.
Disadvantages of The Anchored VWAP
While AVWAP is a powerful tool, it’s not without its limitations:
1. Anchor Point Subjectivity
One of AVWAP’s greatest strengths—its flexibility—can also be a weakness. Selecting the “right” anchor point is subjective and can vary based on trader experience. Poorly chosen anchors may lead to misinterpretation of market context.
2. Not Predictive on Its Own
AVWAP is a reactive indicator, meaning it reflects past price and volume activity rather than predicting future moves. It should be used in combination with other tools or price action signals to confirm trade setups.
3. Can Lag in Fast Markets
In fast-moving or news-driven markets, AVWAP may lag slightly behind price, especially if anchored to a distant historical point. This delay can reduce effectiveness for ultra-short-term decisions.
4. Limited Use Without Volume Context
Since AVWAP is volume-weighted, it loses significance in low-volume or illiquid assets where price levels aren’t backed by meaningful participation. In such cases, the AVWAP may not act as reliable support or resistance.
Despite these limitations, most traders find that when used correctly and in context, Anchored VWAP significantly improves their ability to interpret price action and structure high-probability trades.
Anchored VWAP vs VWAP
Understanding the distinction between Anchored VWAP and traditional VWAP line is crucial for applying the right tool based on your trading strategy and timeframe.
1. Starting Point
- VWAP: Always begins calculating from the start of the trading day (typically the market open) and resets daily.
- Anchored VWAP: Allows traders to select any specific point in time—such as a swing high, earnings release, or breakout—to begin the calculation, offering greater flexibility.
2. Use Case and Timeframe
- VWAP: Best suited for intraday trading and execution benchmarking. It’s widely used by institutional traders to assess whether trades are occurring above or below the average price for the day.
- Anchored VWAP: Ideal for swing traders, position traders, and investors who want to analyze price behavior following a particular event or over extended timeframes.
3. Market Context Relevance
- VWAP: Provides a snapshot of daily trading activity and is often used to gauge short-term momentum.
- Anchored VWAP: Gives context beyond a single day by reflecting how the market has valued an asset since a key event, helping to identify sustained trends or institutional support/resistance.
4. Strategy Application
- VWAP: Used for trade execution, intraday support/resistance, and determining fair value during a single session.
- Anchored VWAP: Supports broader strategy analysis like trend validation, breakout confirmation, and tracking institutional footprints over weeks or months.
5. Flexibility
- VWAP: Static in nature—always tied to the current day.
- Anchored VWAP: Dynamic and customizable—traders can overlay multiple AVWAPs to analyze different market phases.
Anchored VWAP vs TWAP
Understanding the distinctions between Anchored VWAP (Volume Weighted Average Price) and TWAP (Time Weighted Average Price) is essential for traders aiming to optimize their execution strategies and market analysis.
1. Calculation Methodology
- Anchored VWAP: Calculates the average price of a security, weighted by volume, starting from a specific anchor point chosen by the trader (e.g., a significant high, low, or event). This method emphasizes price levels with higher trading volumes, providing insights into areas of strong market interest.
- TWAP: Computes the average price of a security over a specified time period, giving equal weight to each time interval, regardless of trading volume. This approach smooths out price fluctuations over time, focusing solely on the temporal aspect of trading.
2. Primary Use Cases
- Anchored VWAP: Utilized to identify dynamic support and resistance levels, assess market sentiment post significant events, and track institutional trading activity. It’s particularly beneficial for swing traders and long-term investors analyzing price behavior over extended periods.
- TWAP: Employed primarily as an execution strategy to minimize market impact when placing large orders. By distributing trades evenly over time, TWAP helps in reducing slippage and avoiding significant price movements caused by large single transactions.
3. Sensitivity to Market Conditions
- Anchored VWAP: More responsive to changes in trading volume, making it sensitive to periods of high activity. This sensitivity allows traders to gauge the strength of price movements and potential reversals based on volume-weighted data.
- TWAP: Less sensitive to volume fluctuations, providing a steadier average price over time. This characteristic makes TWAP suitable for executing trades in markets with varying liquidity without reacting to short-term volume spikes.
4. Flexibility and Customization
- Anchored VWAP: Offers high flexibility by allowing traders to select specific anchor points, tailoring the analysis to particular market events or price levels. This customization aids in aligning the indicator with individual trading strategies.
- TWAP: More rigid in structure, focusing on time-based averaging without consideration for volume or specific market events. While this simplicity aids in execution, it lacks the adaptability found in Anchored VWAP.
Rolling VWAP vs Anchored VWAP
Rolling VWAP recalculates over a fixed lookback window (e.g. last 20 bars), making it a time-based, dynamic average that adapts to recent price/volume. Anchored VWAP starts from a specific event or price point (e.g. swing low, earnings), making it event-based and tied to contextual market shifts.
FAQ
What is the best Anchored VWAP timeframe to trade?
It depends on your strategy. Intraday traders may anchor to the day’s open or key intraday levels. Swing traders often use weekly AVWAPs, while long-term investors may anchor to quarterly earnings or yearly lows.
How reliable is Anchored VWAP?
Reliability does depend on what the indicator is anchored to. Reliability increases when anchored to meaningful events. It reflects actual traded volume at price levels, making it more accurate than arbitrary support/resistance lines.
Is Anchored VWAP a leading or lagging indicator?
AVWAP is a lagging indicator because it’s based on historical price and volume. However, it effectively reveals where real volume-backed price consensus lies.
What is the origin of Anchored VWAP?
Anchored VWAP was popularised by Brian Shannon of AlphaTrends. He introduced it as a way to analyze price in relation to specific market events instead of arbitrary timeframes.
What common mistakes should traders avoid when using Anchored VWAP?
- Anchoring to irrelevant price points
- Ignoring volume confirmation
- Relying on AVWAP in low-volume assets
- Not aligning AVWAP use with your trading timeframe
Can Anchored VWAP be used for long-term investing?
Absolutely. Long-term investors often anchor to IPO dates, 52-week lows, or major earnings events to assess fair value zones over months or even years.
Do Institutions Use Anchored VWAP?
Yes—large institutions routinely use VWAP line and anchored variations to manage trade execution and track performance. For example, Citadel (handling ~35% of U.S. retail volume) employs VWAP-based algorithms to disguise and optimise trade flow.


