Skriven av:


- Chart of the Day
- juli 9, 2026
- 3 min läsning
SPX Coils Above a Rising Anchored VWAP
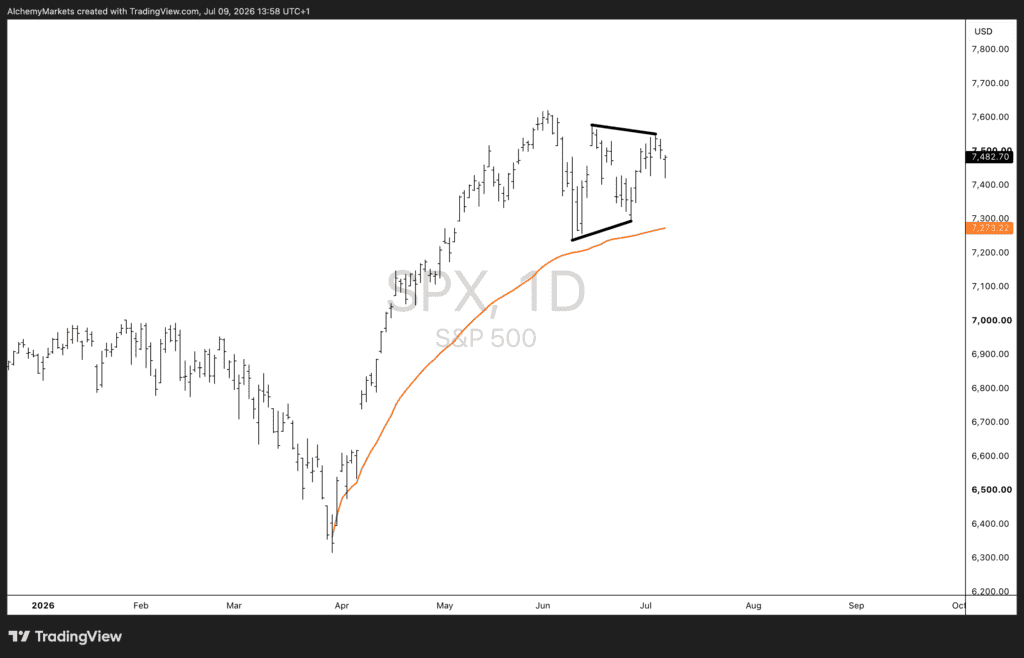
The S&P 500 has spent three weeks doing something less dramatic than the June melt-up, but arguably more telling. Since printing an all-time high of 7,621, the index has carved out a tight triangle between roughly 7,300 and 7,570, and it’s currently trading at 7,482, pushing back toward the top of that range.
The structure itself is a classic post-impulse consolidation. Price rallied hard off the April low near 6,400, topped out in June, and has since been contracting sideways rather than correcting sharply, which is generally the market’s way of digesting a strong move rather than rejecting it. The ceiling near 7,570 has been tested and held twice, and the floor near 7,300 has done the same, tightening the range each time price has revisited it.
The line running underneath the whole structure is where this gets more interesting. That’s an anchored VWAP, plotted from the April low, and it’s currently tracking just below the range floor and rising into it. An anchored VWAP isn’t a lagging average, it’s the volume-weighted average price paid by every buyer since that anchor point. Read plainly, it means the entire cohort that has bought this recovery is still sitting on a rising cost basis beneath current price, and the triangle has formed without ever threatening to test that collective breakeven. That’s a meaningfully different setup to a market that’s simply gone up a lot. It’s one where the buyers underneath the move haven’t been forced to defend their position yet.
That’s the backdrop the bull case leans on. A triangle sitting above a rising VWAP, directly beneath a fresh high, is the kind of setup that more often resolves as continuation than reversal. Layer in the earnings calendar and the picture firms up further, with Q2 growth expected in the low twenties percent year over year and the banks reporting first. If financials and the AI-linked megacaps deliver, that’s the fundamental confirmation that turns a break above 7,570 into a genuine push back toward 7,621 and beyond, rather than a false start.
Here’s the steelman for why that doesn’t happen. A rising VWAP looks like support until the day it isn’t, and the anchor point is exactly what can flip this argument. If price loses the 7,300 floor and starts closing below the VWAP itself, this stops being healthy consolidation and becomes something else entirely. That line is no longer a level like any other on the chart, it’s the point where the average participant from the entire April to July advance moves from profit into loss. Cohorts that are underwater don’t average in, they sell to get back to flat, and because the VWAP represents real transacted volume rather than a smoothed calculation, a break below it tends to move fast once it goes, precisely because everyone who bought the move is doing the same math at the same time.
The triangle, in other words, isn’t just the market pausing before it goes higher. It’s the market deciding whether three months of gains were fairly priced. Hold the VWAP, and that debate resolves quietly in the bulls’ favour. Lose it, and the same structure marks the top of the move rather than a pause inside it.
The level to watch this week isn’t 7,570 or even 7,300, it’s the anchored VWAP itself, and whether it continues to hold as support while Q2 earnings and the July 28-29 Fed decision both land inside this same range.