


Skriven av:

- Chart of the Day
- mars 30, 2026
- 3 min läsning
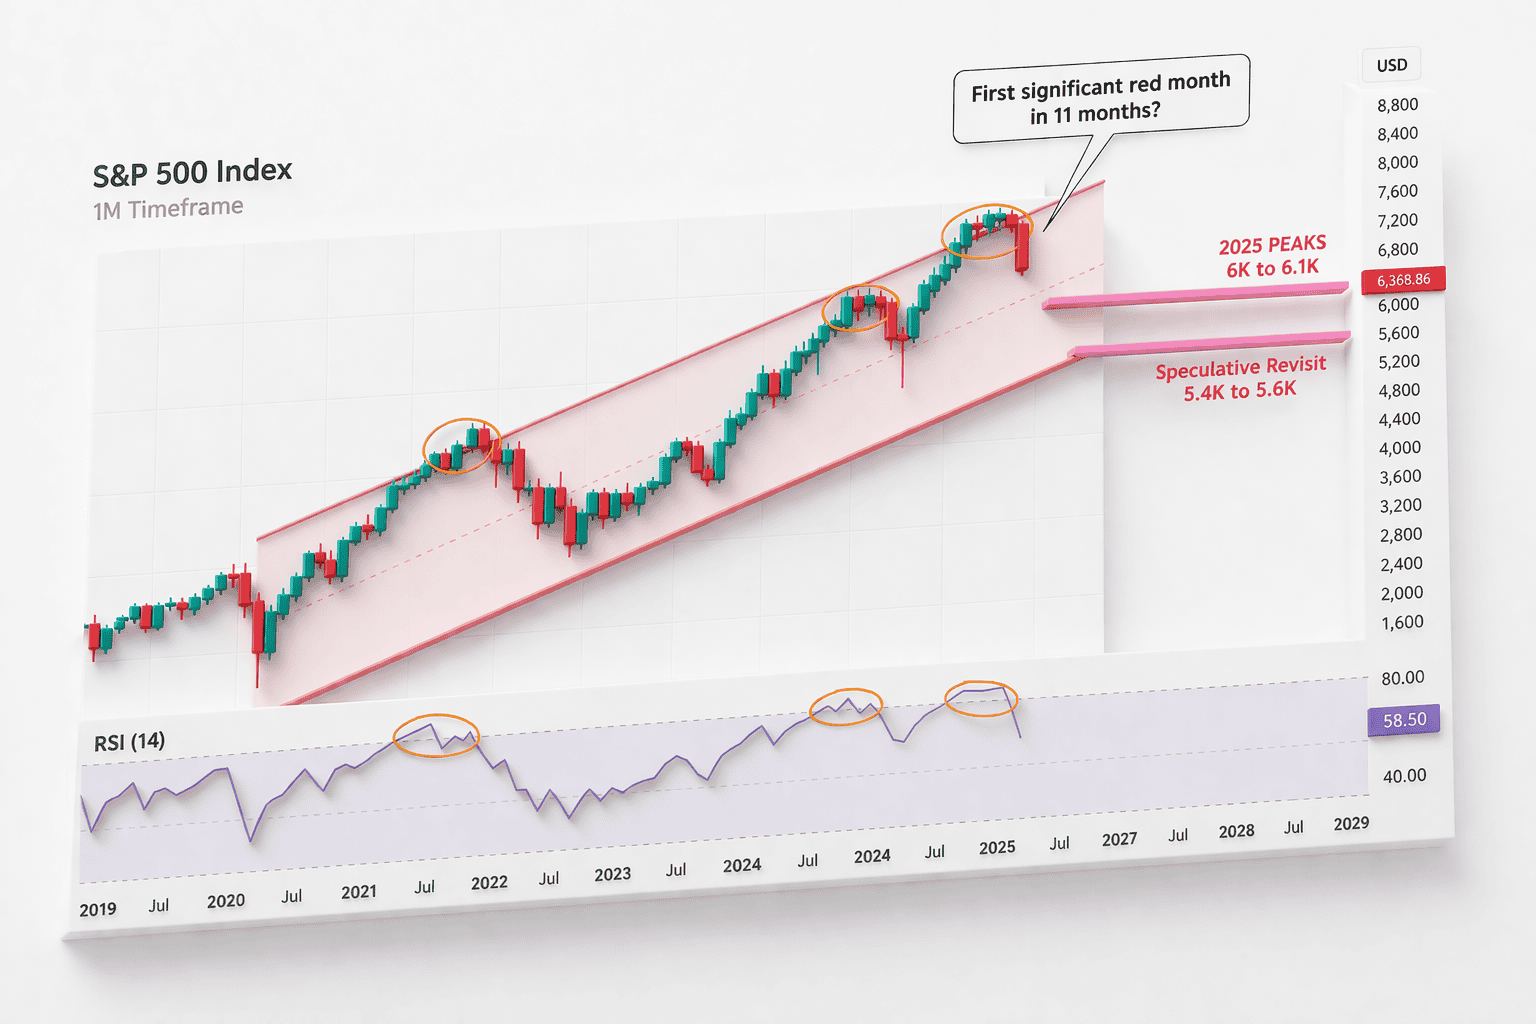
Warning: S&P 500 Heads for Worst Month Close in 11 Months
The S&P 500 is on track to close March down roughly 7.7%, which would make this its first significant bearish month in nearly a year. That alone is enough to change the tone heading into April, but the bigger issue is where it is happening. On the monthly chart, price is rolling over near the upper end of a long-term rising parallel channel, right where previous RSI stretches have also started to lose momentum.
That is why the 6,000 to 6,100 zone matters so much now. It is not just a round-number support area:
- It lines up with the 2025 peak region and the channel midline, which has repeatedly acted as a respected validation area within the broader uptrend.
If buyers can stabilise the index there, the move can still be framed as a sharp reset inside trend. If not, the chart starts opening the door to a deeper revisit toward 5,400 to 5,600 over time.
As Oil Shock Worsens, Global Indices Show Weakness
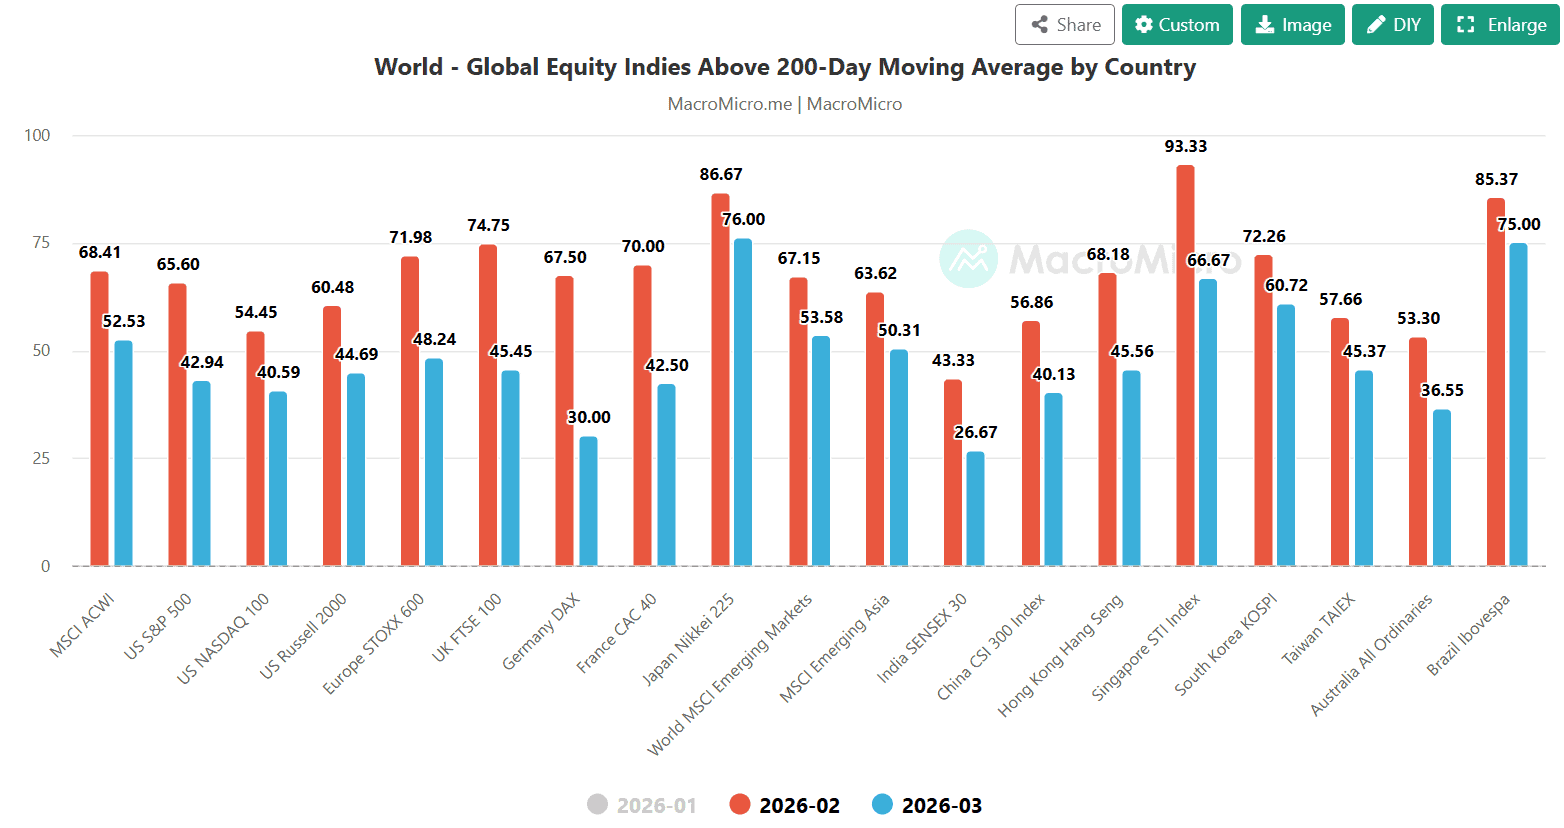
The weakness under the surface also makes this monthly warning harder to dismiss.
The MacroMicro breadth chart shows that within all the major global indices, stocks above their 200-day moving averages have decreased in March versus February, which suggests this is not just an isolated wobble in US equities. Participation is thinning out across markets, and that tends to matter more when headline indices are already breaking lower.
VIX Crosses 30 Again; A Historical Dip-Buying Point
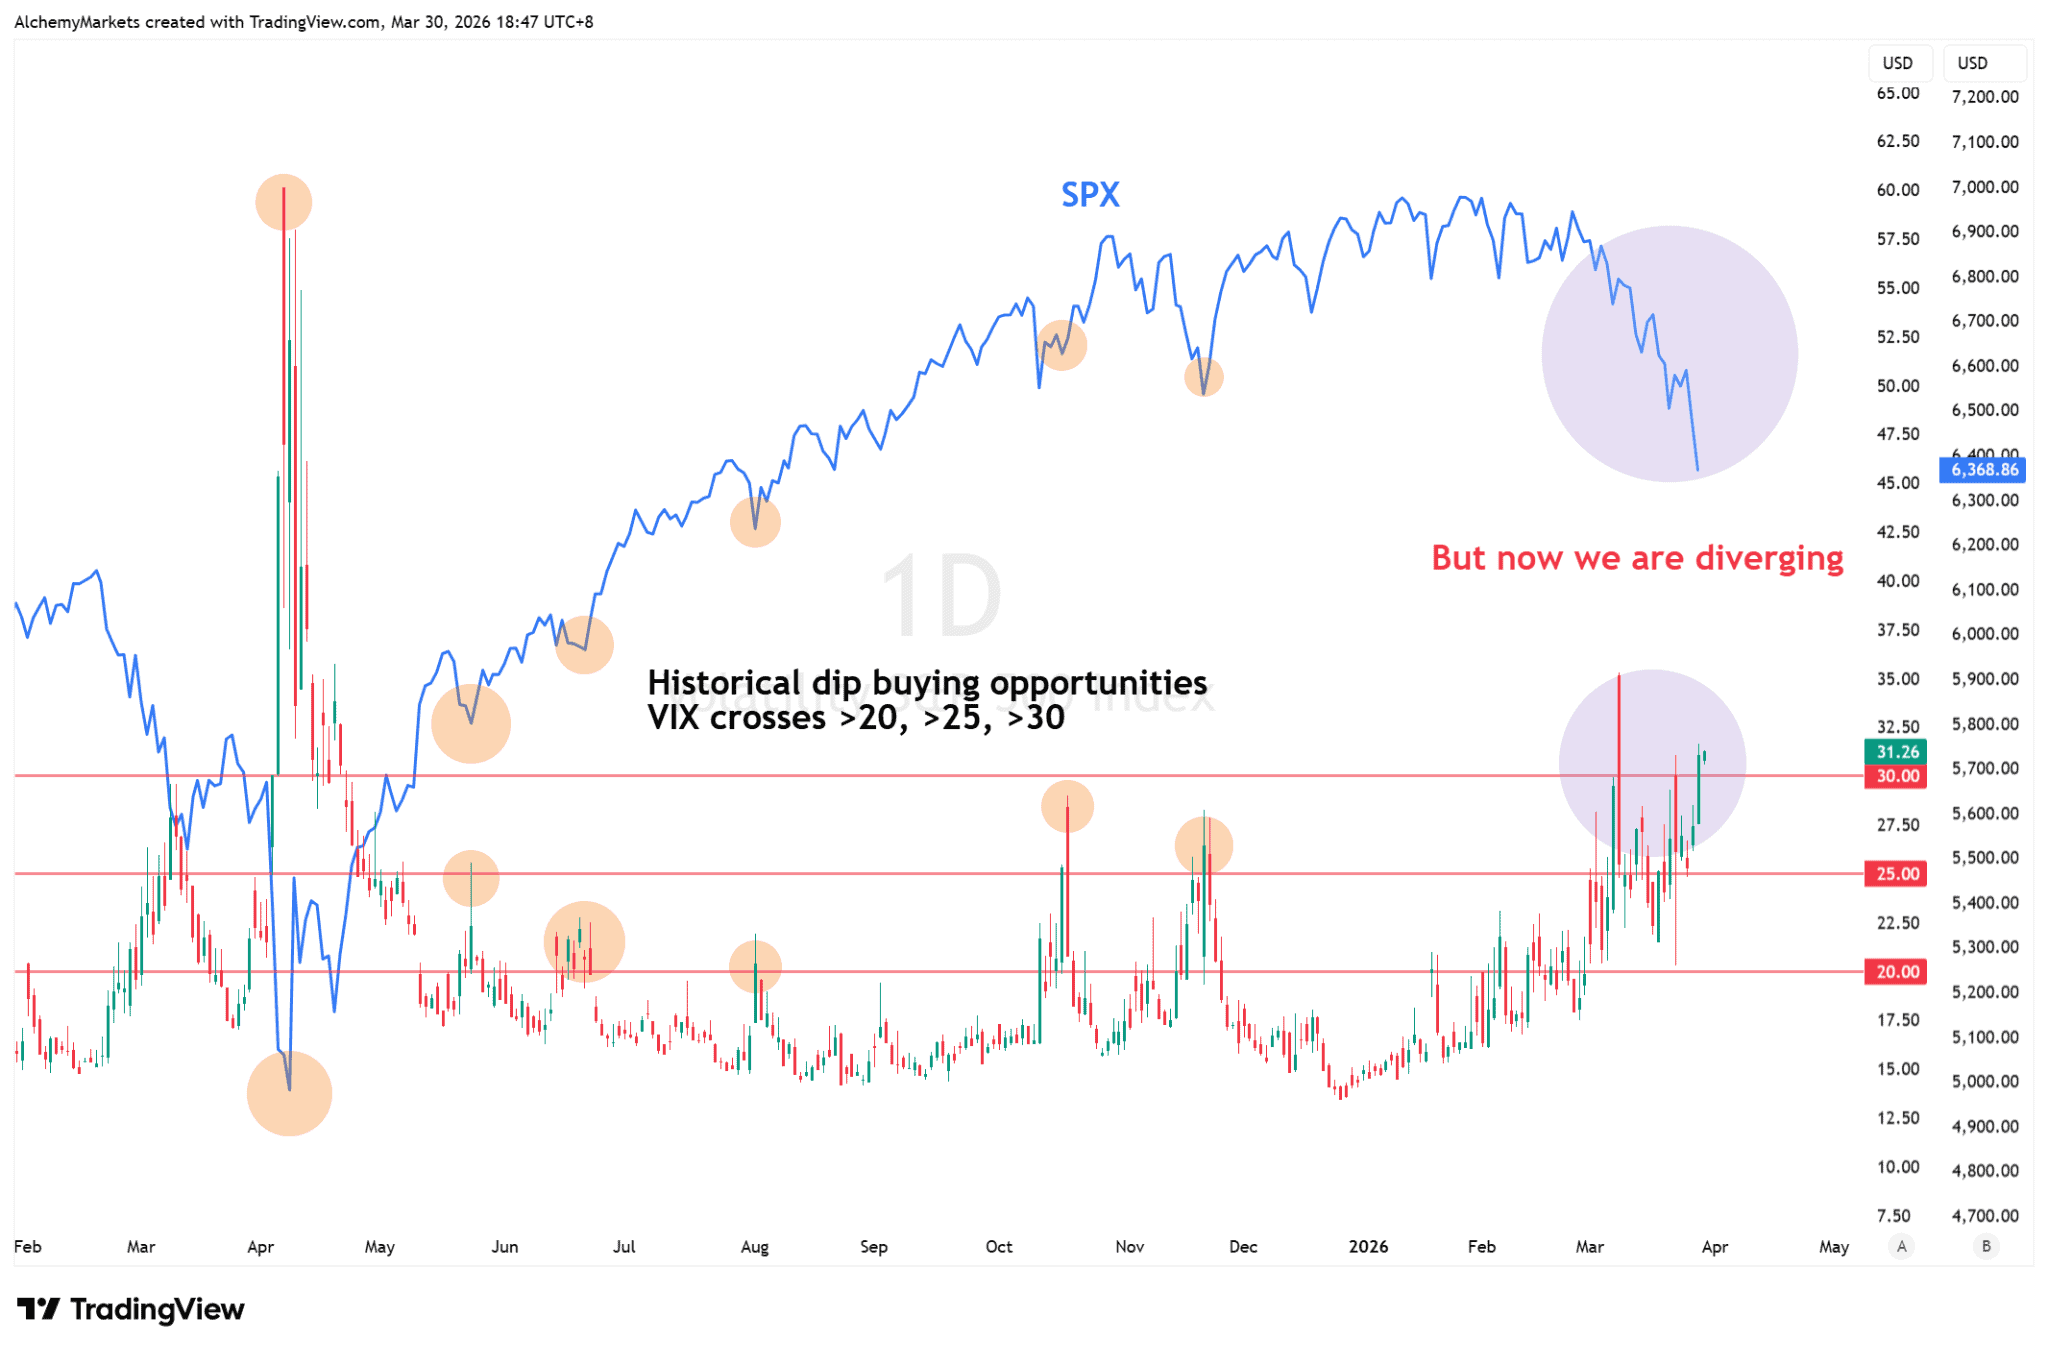
There is a tactical wrinkle, though: the VIX is now high enough to raise the odds of a relief rally, since prior VIX breaks above 30 have often appeared near short-term rebound zones.
The problem is that this setup is not as clean as those earlier dip-buying moments.
The SPX and VIX relationship is now diverging rather than snapping into a cleaner capitulation pattern, which means any rebound still needs to prove itself rather than being trusted automatically.
That caution also fits the broader macro backdrop. There is currently a wider oil-shock style squeeze on growth, margins, sentiment and labour expectations, which helps explain why this selloff has felt sticky rather than like a fast flush that immediately resets.
Bottom Line
For now, the market’s message looks fairly simple. March is ending with a heavy bearish candle, breadth is weakening, and volatility is elevated.
That leaves 6,000 to 6,100 as the first major test. Hold it, and April can still begin with a damaged but repairable structure (a relief rally). Lose it, and the lower end of the channel around 5,400 to 5,600 becomes much harder to ignore.


