Skriven av:


- Chart of the Day
- maj 28, 2026
- 3 min läsning
META Rallies as Subscription Plans Put AI Profitability in Focus
We are almost halfway into 2026, and for much of the year, META has been capped below the $750 area.
The pressure has been simple enough: Meta is still a giant advertising business, but investors have been restless over whether its AI capex can translate into stronger profits and free cash flow.
That concern is visible in the numbers. In Q1, Meta reported $56.31 billion in revenue, with ad impressions up 19% and average price per ad up 12%. Free cash flow came in at $12.39 billion, but capex was already $19.84 billion for the quarter. Meta also lifted its 2026 capex outlook to $125 billion-$145 billion, up from its previous $115 billion-$135 billion range.
That is why the latest subscription news matters. Meta’s core model still runs on advertising across Facebook, Instagram, Messenger and WhatsApp. More users, more engagement, more ad impressions and better pricing drive the engine. The new subscription plans add a recurring revenue layer on top of that model.
Meta is rolling out paid plans for Facebook, Instagram and WhatsApp, while also testing paid tiers for Meta AI.
Reported pricing includes:
- $3.99/month for Facebook Plus and Instagram Plus
- $2.99/month for WhatsApp Plus
- $7.99 / $19.99 Meta AI tiers for heavier users
The market liked the update because it gives Meta a clearer route to charge for premium features and AI usage after months of capex anxiety.
TECHNICAL ANALYSIS OF META CHART (1D)
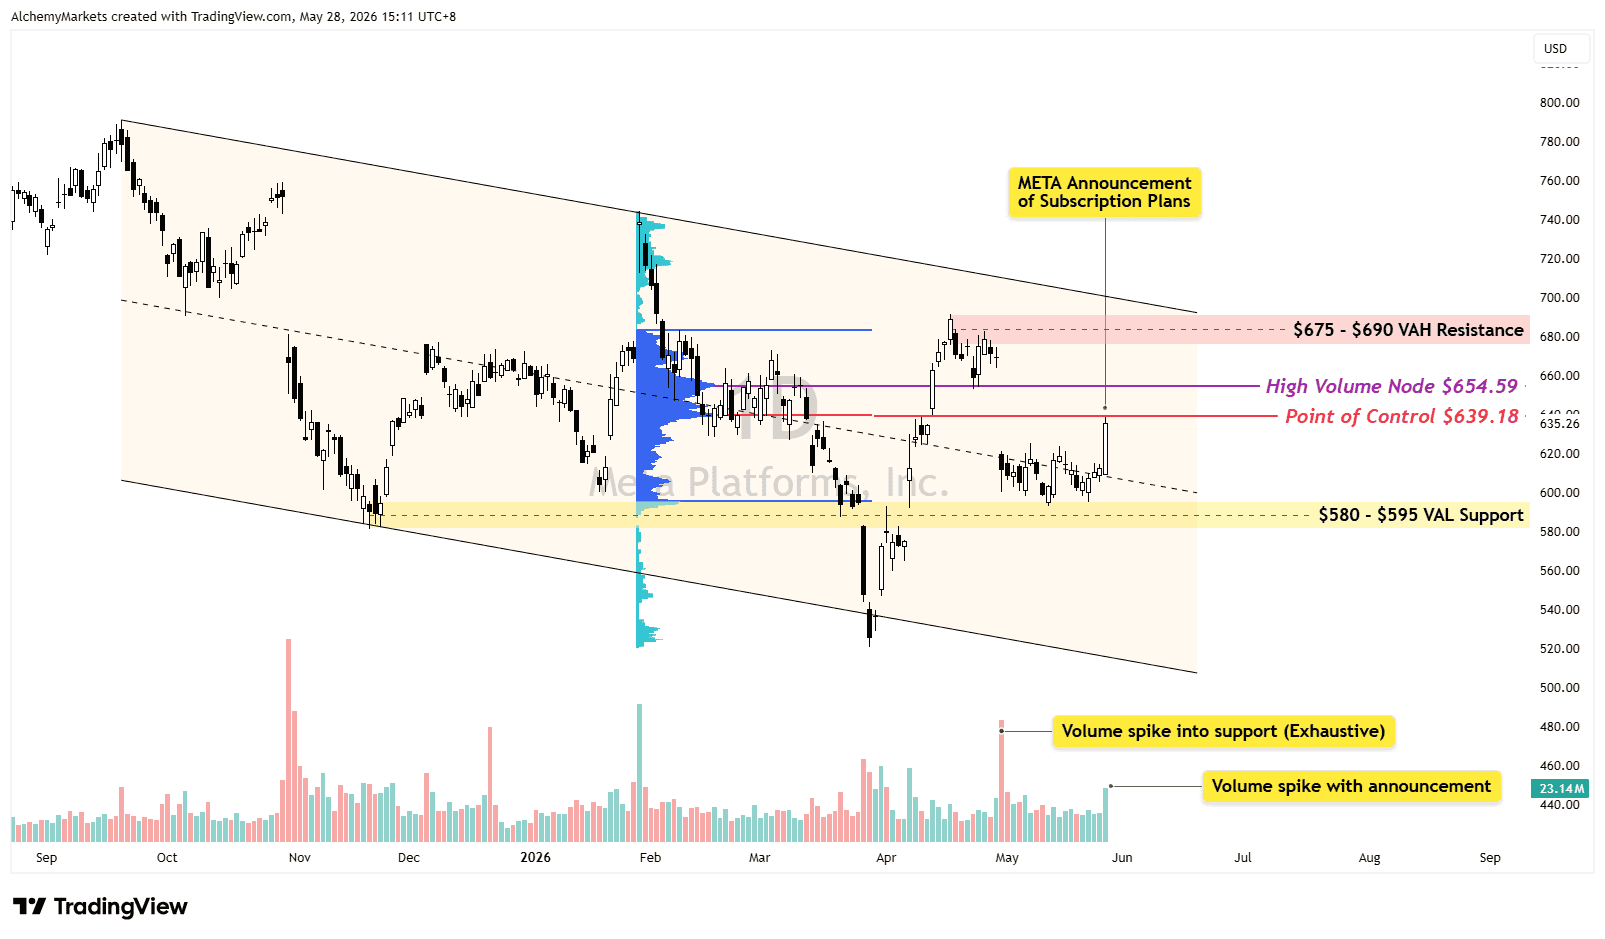
On the chart, the reaction is useful because META was already testing an important support area.
The Fixed Range Volume Profile is drawn from the swing high to swing low because price is still trading inside that broader decline. That makes the volume profile useful for mapping where traders were most active during the selloff, and where price may now react again.
The first key zone is the $580-$595 VAL support, where price stalled after a high-volume selloff. The red candle near the lows was relatively small compared with the volume behind it, which suggests selling pressure was heavy but failed to produce much downside follow-through.
The subscription news then helped trigger a strong bullish candle back above the descending channel midline. That improves the short-term structure, but the stock is now pressing into the old volume-heavy resistance area.
The first test is the $639 POC, followed by the $654 HVN. Holding above $639 would keep the recovery alive. Clearing $654 would make the move look stronger and open the door toward the $675-$690 VAH resistance.
The broader market helps the setup, but not without some growing concerns. Although mega-cap growth appetite is still alive, and rotation out of stretched semiconductors can support names like META — the risk is that AI fatigue, sticky inflation, or higher yields make investors less patient with long-duration capex stories again.
For now, META has a better narrative and a better chart reaction. The move becomes more convincing above $654, with the larger confirmation zone still sitting at $675-$690.