


Skriven av:


- Chart of the Day
- februari 25, 2026
- 5 min läsning
Copper: Triangle Compression at Resistance – Breakdown Risk Rising?
Today’s Copper Chart of the Day highlights a market at inflection. After the sharp January–early February impulse, copper has transitioned from expansion to compression. Price is now pressing into the upper boundary of a medium-term triangle — but the internal structure suggests this move may be corrective rather than impulsive.
Where We Stand Now
The dominant leg on the chart remains the January impulse higher. It was fast, aggressive, and momentum-driven. Wide-range candles, strong follow-through, and volatility expansion defined that phase.
Since then, price hasn’t extended meaningfully higher.
Instead, we’ve seen overlapping candles and narrowing price swings — classic consolidation behavior.
The January Impulse as the Dominant Leg
Structurally, that rally still controls the broader narrative. It represents the last clear expansion phase. Everything afterward has been digestion.
When markets digest strong impulses, they typically:
- Form triangles
- Develop channels
- Rotate within ranges
That’s exactly what copper is doing now.
Transition from Expansion to Compression
Volatility has contracted. Swings are tightening. Highs are capped lower while lows creep higher.
This compression is forming a medium-term triangle — and we’re now testing the upper boundary.
The Medium-Term Triangle in Focus
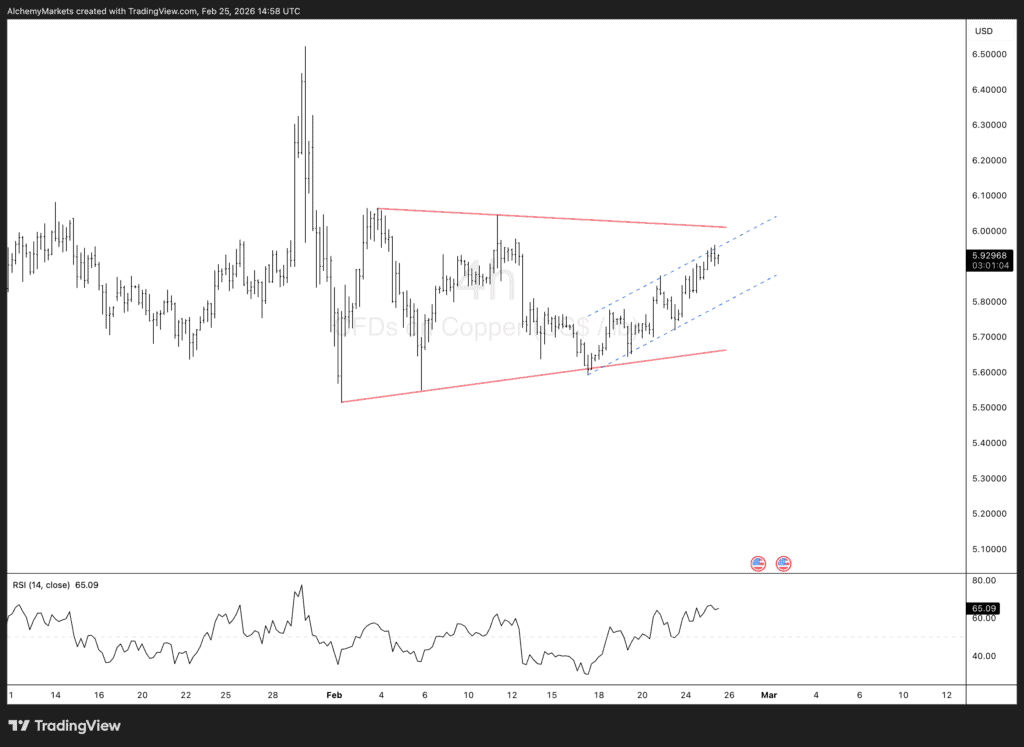
The broader structure is defined by:
- Descending upper resistance
- Ascending lower support
Price is coiling between these converging trendlines.
This is not random noise. It’s a positioning structure.
Upper Boundary Supply Zone
Each approach to the descending resistance line has attracted supply. Sellers are defending that zone.
If this level holds again, it reinforces the idea that the triangle is still active — and unresolved.
Rising Lower Trendline Support
Buyers have been stepping in at progressively higher levels. That’s the bullish counterargument.
But here’s the nuance: higher lows alone don’t equal trend continuation. Inside triangles, both sides press — until one side wins.
Volatility Compression and Positioning Build-Up
Compression often precedes expansion because:
- Stops accumulate outside boundaries
- Liquidity builds
- Option gamma positioning tightens
When the break comes, it’s rarely quiet.
The Internal Rising Channel – Corrective or Reversal?
Zooming in, the recent rally is unfolding inside a smaller rising channel.
The slope is steady but not aggressive.
That’s important.
Channel Characteristics and Slope Analysis
The channel shows:
- Orderly higher highs
- Controlled pullbacks
- No acceleration
Impulsive moves expand range. This one hasn’t.
Why This Looks Corrective
Corrective rallies tend to:
- Move against the larger immediate pressure
- Lack momentum expansion
- Stall near structural resistance
That’s what we’re seeing.
Price is pressing into major resistance without momentum confirmation.
That tilts risk slightly toward rejection — for now.
Momentum Context: RSI Recovery Without Expansion
RSI has recovered into the mid-60s.
It’s firm — but not extreme.
Momentum Profile vs Prior Impulse
During the January impulse, momentum expanded aggressively. Now, RSI is rising in a measured way.
That suggests this rally may be more about positioning unwind than fresh demand.
Risk of Bearish Divergence
If price tags resistance while RSI flattens or fails to make a higher high, short-term bearish divergence becomes a live risk.
Divergence at structural resistance inside compression patterns is something tactical traders watch closely.
Fundamental Backdrop Supporting the Structure
The chart doesn’t exist in a vacuum.
Copper’s macro sensitivity makes the backdrop critical.
USD Direction and Real Yields
Copper remains highly sensitive to USD strength. A firm dollar or rising real yields tend to cap commodities.
If the USD stabilises or strengthens, it reinforces resistance overhead.
China Growth Expectations
China accounts for a significant share of global copper demand. Infrastructure spending, property stabilisation, and manufacturing data all matter.s
Mixed signals from China recently align with a consolidation narrative — not a breakout surge.
For broader copper market context, traders can monitor data and updates via the London Metal Exchange.
Positioning and Sentiment
After the January spike, positioning likely became crowded on the long side. Consolidation often works off that excess.
Until fresh catalysts emerge, price may continue rotating within structure.
Tactical Trade Scenarios
Rejection Scenario: Rotation to Lower Boundary
If resistance holds:
- Expect a move back toward the lower triangle support
- Watch for acceleration once the rising channel breaks
- Downside volatility could expand quickly
This would complete another leg inside the broader consolidation.
Breakout Scenario: Structural Shift Higher
If price closes decisively above the upper boundary:
- Momentum must expand
- RSI should push into overbought territory
- Follow-through sessions are key
Without expansion, breakouts can trap.
FAQs
Is copper currently trending?
Not cleanly. It’s consolidating within a medium-term triangle.
Why is the triangle important?
It defines the current risk boundaries and likely breakout zones.
What would confirm downside?
Failure at resistance and a break of the rising internal channel.
What invalidates the bearish view?
A sustained breakout above triangle resistance with momentum expansion.
How important is USD for copper?
Very. Dollar strength often pressures copper prices.
Is this a high-volatility setup?
Compression suggests volatility expansion is coming — direction pending.


