
- Quarterly Forecast
- Luglio 6, 2026
- 6 min di lettura
Q3 2026 Crude Oil, Silver, Gold, and Bitcoin Forecast
| Q2 2026 Performance | 2026 YTD | |
| *Gold (XAUUSD) | -14.15% | -7.5% |
| *Silver (XAGUSD) | -22.03% | -18.2% |
| *Crude Oil (USOIL) | -31.05% | +22.0% |
| Copper (XCUUSD) | +10.53% | +9.6% |
| Platinum | -21.26% | -24.3% |
| *Bitcoin | -14.18% | -33.1% |
*Analysis and forecast below
Q2 2026 was a rough quarter with most commodities trading lower by more than double digits. Only Copper was positive for the quarter while YTD, Copper and Crude Oil remain higher as a result of inflationary pressures.
Though the Strait of Hormuz appears to be reopened, the supply of oil is likely to remain below pre-war levels with long-term demand remaining sticky.
The metals have traded low enough that a bottom may start to develop. Bitcoin, the digital gold, still appears to have an incomplete downtrend as it has yet to trade below $50k.
Crude Oil
In our previous Q2 2026 report, while crude oil was trading near $110, we forecasted:
“When the conflict begins to simmer down, I’m looking for the dip in crude oil prices to provide another bullish setup as the supply chain disruption of the strait closure continues. Current support for crude oil is $76 and that support may be felt as low as $67.”
Last week, Crude oil printed a low of $67.04, right at the support level we cited three months ago.
Part of the reason crude oil prices have mostly remained below $100 for the duration of the war was because China cut their imports beginning in March by 4 million barrels per day. During a time of a supply crunch, this is a huge cut and it alleviated the pressure as other alternate delivery routes were geared up.
Now that the war is simmering down and crude oil has traded lower, there are some technical reasons why the downside may be limited.
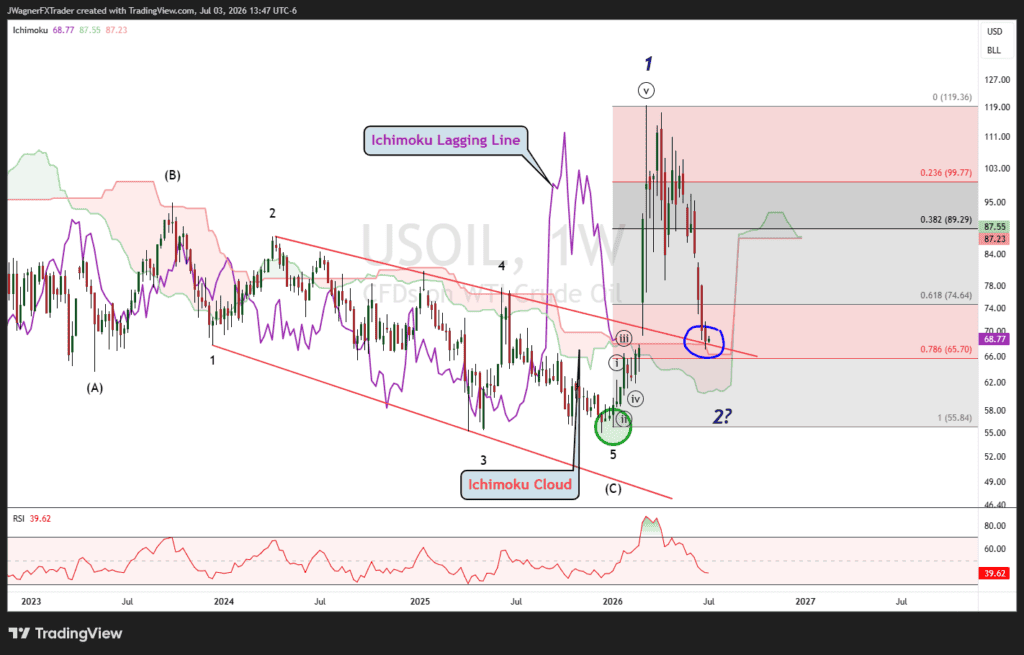
First, the weekly Ichimoku lagging line is still holding up above the Ichimoku cloud. When the charts become difficult to read, one long-term indicator I go to is the weekly lagging line versus the cloud. Until the lagging line falls below the cloud, we can anticipate a bounce higher.
The 2-4 trend line connecting the highs from 2024 and 2025 passes through near $67. This trend line used to be a resistance trend line, then was broken when the war erupted. Broken resistance can act like new support into the future.
From an Elliott wave perspective, this decline is viewed as a wave 2 and this implies a wave 3 higher that pushes above $119. Perhaps this trend needs more time to develop than the “quick” war induced rally. I’m anticipating a steady climb over the coming years.
Gold Forecast
From a longer term perspective (over several years), the Elliott wave pattern is incomplete to the upside suggesting new highs may eventually be seen above $5600. However, gold has been in a fairly steady downtrend so far in 2026.
Our Q2 2026 forecast was spot on. While trading at 4,676, we forecasted:
“Therefore, if gold holds below $5,000, then be mindful of another dip that could dig as low as $3,600.”
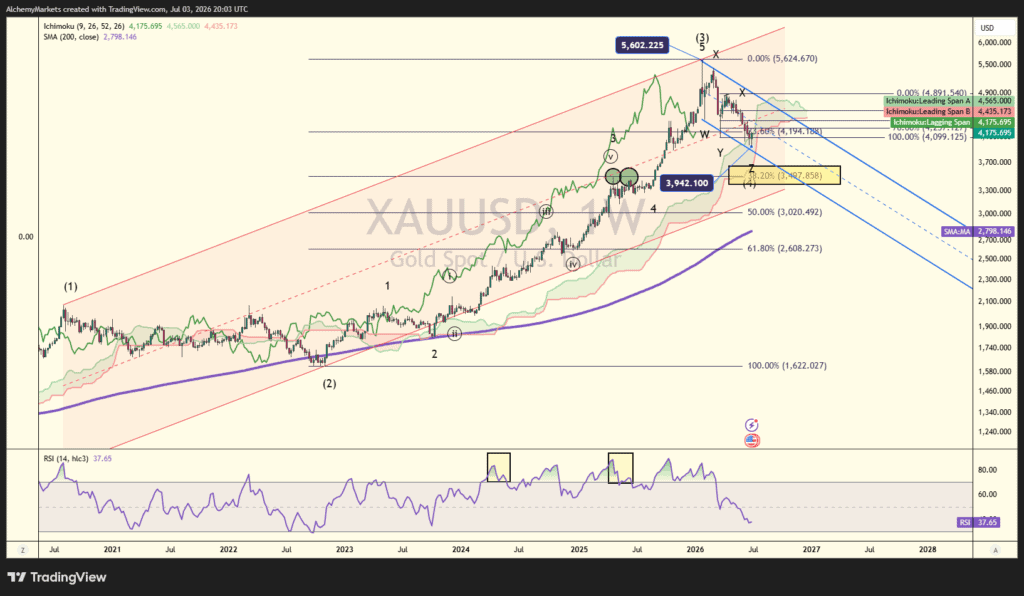
Gold was unable to rally above 5,000 reaching a high of 4,891 in April. This was telling as it exposed new lows, which the market provided down to 3,942.
It is possible to count last week’s low as the ultimate low in wave 4 and Q3 will mark the beginning of a wave 5 rally.
It is also possible that last week’s low is simply part of a wave 4 decline and that prices may dig a little deeper.
I suspect gold will find its footing soon.
When we apply the Ichimoku lagging line and Ichimoku cloud to the weekly chart, we see price has entered the cloud (green shaded area). The cloud tends to act like support and resistance for either price or the lagging line. This is the first time price has touched the cloud since 2023.
Therefore, I suspect a bounce may develop. If the bounce develops and pushes above 5,000, then new all-time highs are just around the corner.
If the bounce does not materialize soon and the price falls below the lower edge of the cloud, then it will expose gold to further losses. If gold pushes below the cloud, then 3,600 is the next possibility.
Silver
Our Q2 forecast in silver was spot on. Back in April, while trading at 72.99, we forecasted:
“Bottom line, wave (4) may be incomplete and require one more poke lower to near $51-58 before starting wave (5).”
Silver traded to a low of $55.59 last week, right inside the target zone.
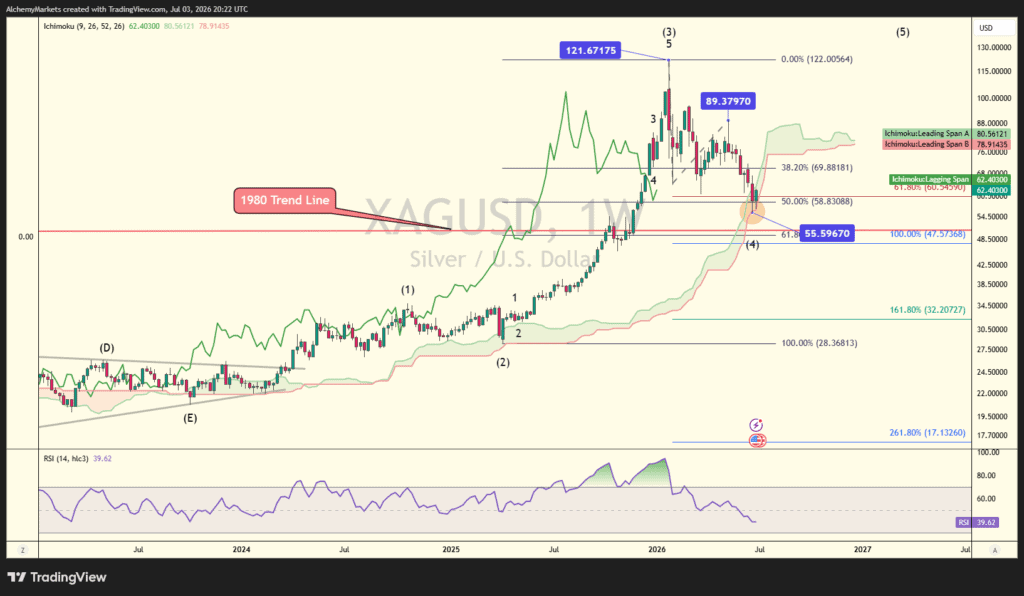
Silver’s technical picture is more or less aligned with gold.
Looking at the weekly price chart, silver prices have entered a thin and severely upward sloping Ichimoku cloud. The last time silver touched the cloud was in 2025. Silver prices entered a strong bullish run after that touch of the cloud.
Silver prices have remained above the lower end of the Ichimoku cloud since 2023.
Additionally, prices have made it to the 50% Fibonacci retracement level of wave (3). This is a common retracement level for a sharp correction after a strong and extended rally.
Therefore, the minimal waves are in place for a rally to develop retracing a large chunk of the decline.
If silver prices were to fall the next level of support would be near $50. This is where a 46 year trend line passes through (red line).
Bottom line, the risk to reward ratio is beginning to skew back to long positions.
If the Ichimoku cloud is able to support prices, then silver may trade up to $80 and possibly higher levels in Q3.
Bitcoin Forecast (Digital Gold)
In our Q2 2026 outlook while Bitcoin was trading near $70k, we forecasted:
“Perhaps some seasonality may push Bitcoin up to the underside of the 2020 trend line ($85-90k) but it doesn’t have to. Once the countertrend bounce is complete (likely in Q2 2026), then this Elliott wave model suggests another decline towards the $49k target or lower levels.”
In May, Bitcoin prices did push up to a high of $82,814, just below the target range, then reversed lower. The forecast is still on track and that we are anticipating a push to the $49k target with possibly lower levels too.
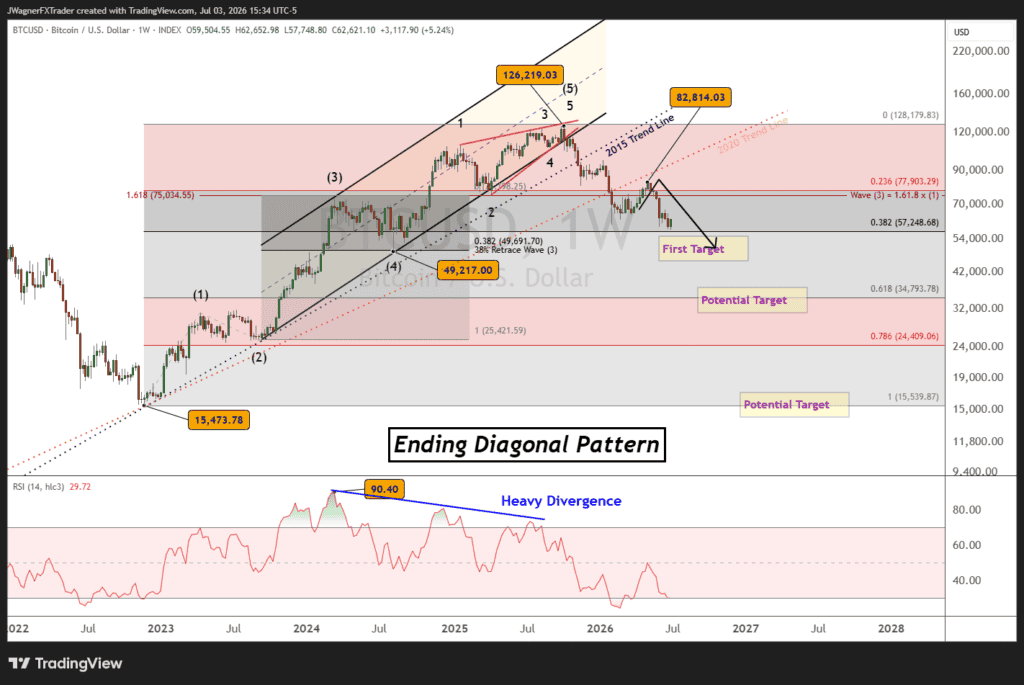
Bigger picture, the main Elliott wave count suggests that an important and long-term top formed in October 2026.
If the 2022-2026 rally is a completed Elliott wave impulse pattern, then wave (5) of the impulse can be counted as an ending diagonal or rising wedge. These patterns tend to be completely retraced leading to a decline back to $49,217, the origination of the diagonal pattern. It is important to keep in mind that even lower levels are possible like $35k and even $15k.
Most of the damage has been done with the current trend low at $57,748. However, the decline does not appear complete and hints that another low is around the corner.
Bottom line, it appears the decline in Bitcoin is not complete and further losses may appear down the road. If Bitcoin does fall below $49k, then it will get tricky as even lower levels are possible.