Scritto da:

- Opening Bell
- Maggio 25, 2026
- 6 min di lettura
This Week: Hike and PCE Risks Test the Relief Trade
Iran optimism has bought markets time last week, but this week, the relief trade could be tested.
Oil has cooled, US30Y has backed away from the 5.15% area, and risk assets now have room to breathe. The problem is that rate-hike risk has not disappeared.
Markets are getting relief because the immediate energy shock looks less threatening. If the Strait of Hormuz risk fades, oil can lose its war premium quickly. That helps the inflation story, softens the dollar, and takes pressure off long-end yields.
So for now, the story remains the same as last week. But this is still optimism, not resolution.
U.S. and Iranian officials have played down the idea of an imminent agreement, even as traders react to signs of progress. Trump has also signalled that the U.S. is not in a hurry, which means markets are still trading headlines rather than a signed deal.
For today, liquidity may also be thinner because the UK is closed for the Spring bank holiday on 25 May 2026. That does not make the market irrelevant, but it does mean headline-driven moves may be easier to exaggerate, especially across oil, FX, and rates.
US30Y Is the Main Stress Test
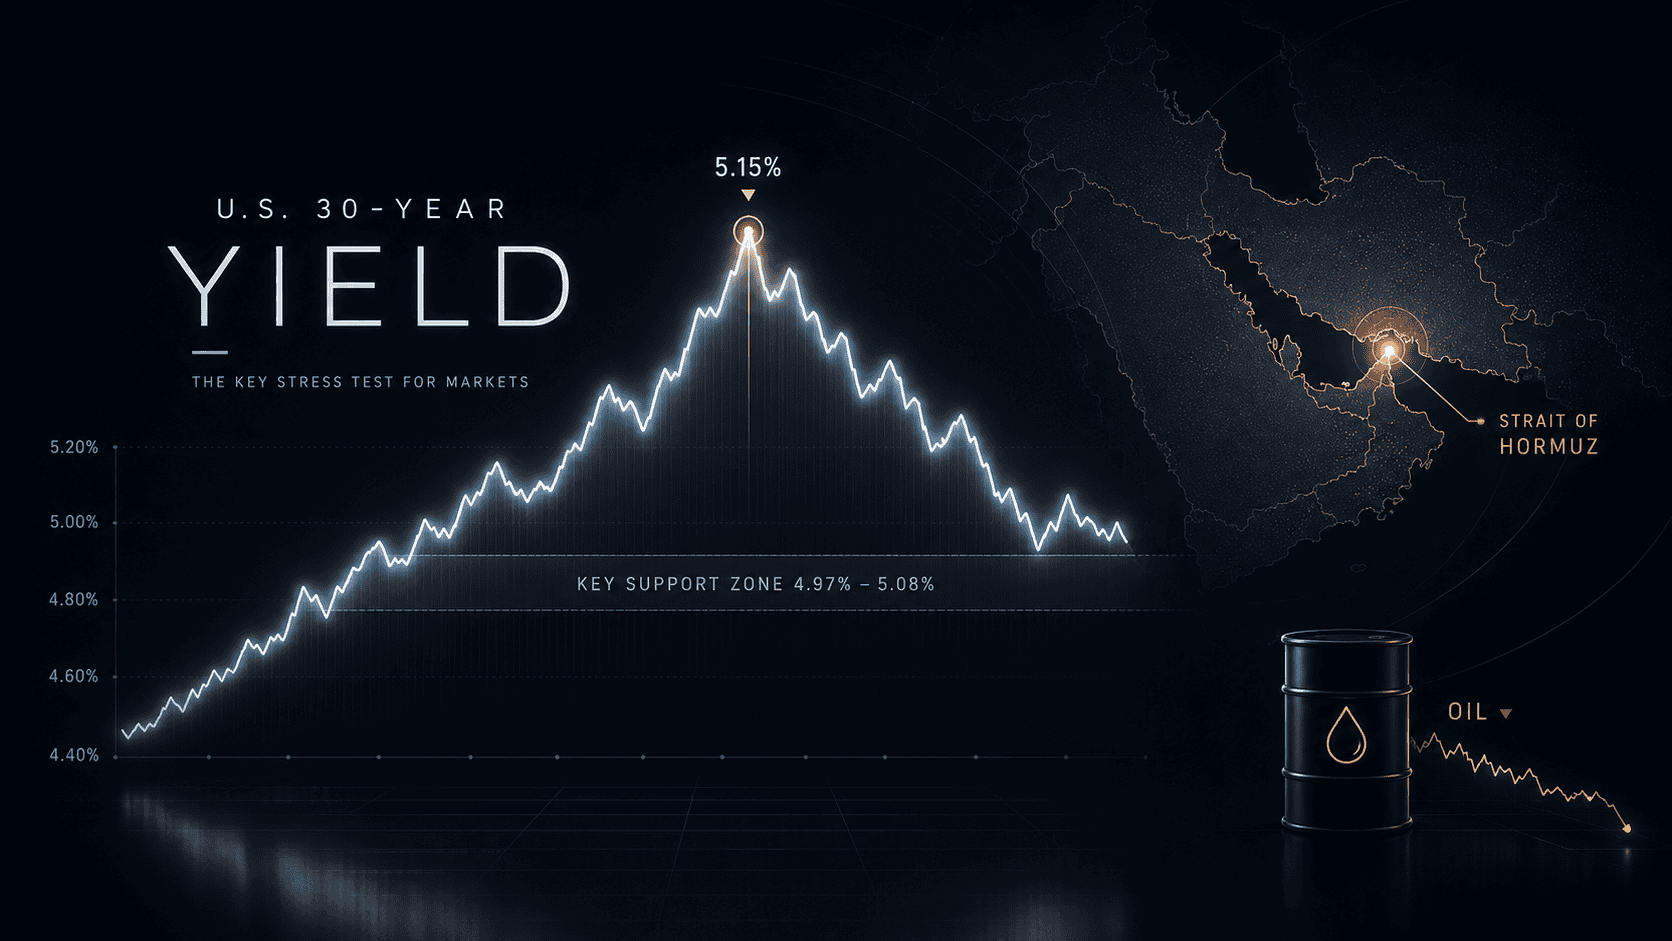
The U.S. 30-year yield has cooled after testing the 5.15% area, giving risk assets some breathing room after the recent pressure. The level to watch now is the 4.97% to 5.08% zone, with 5.05% sitting near the middle of that range.
If the 30Y stays below this area, the equity rally has a better chance of holding. If yields push back toward 5.15%, the market starts looking uncomfortable again.
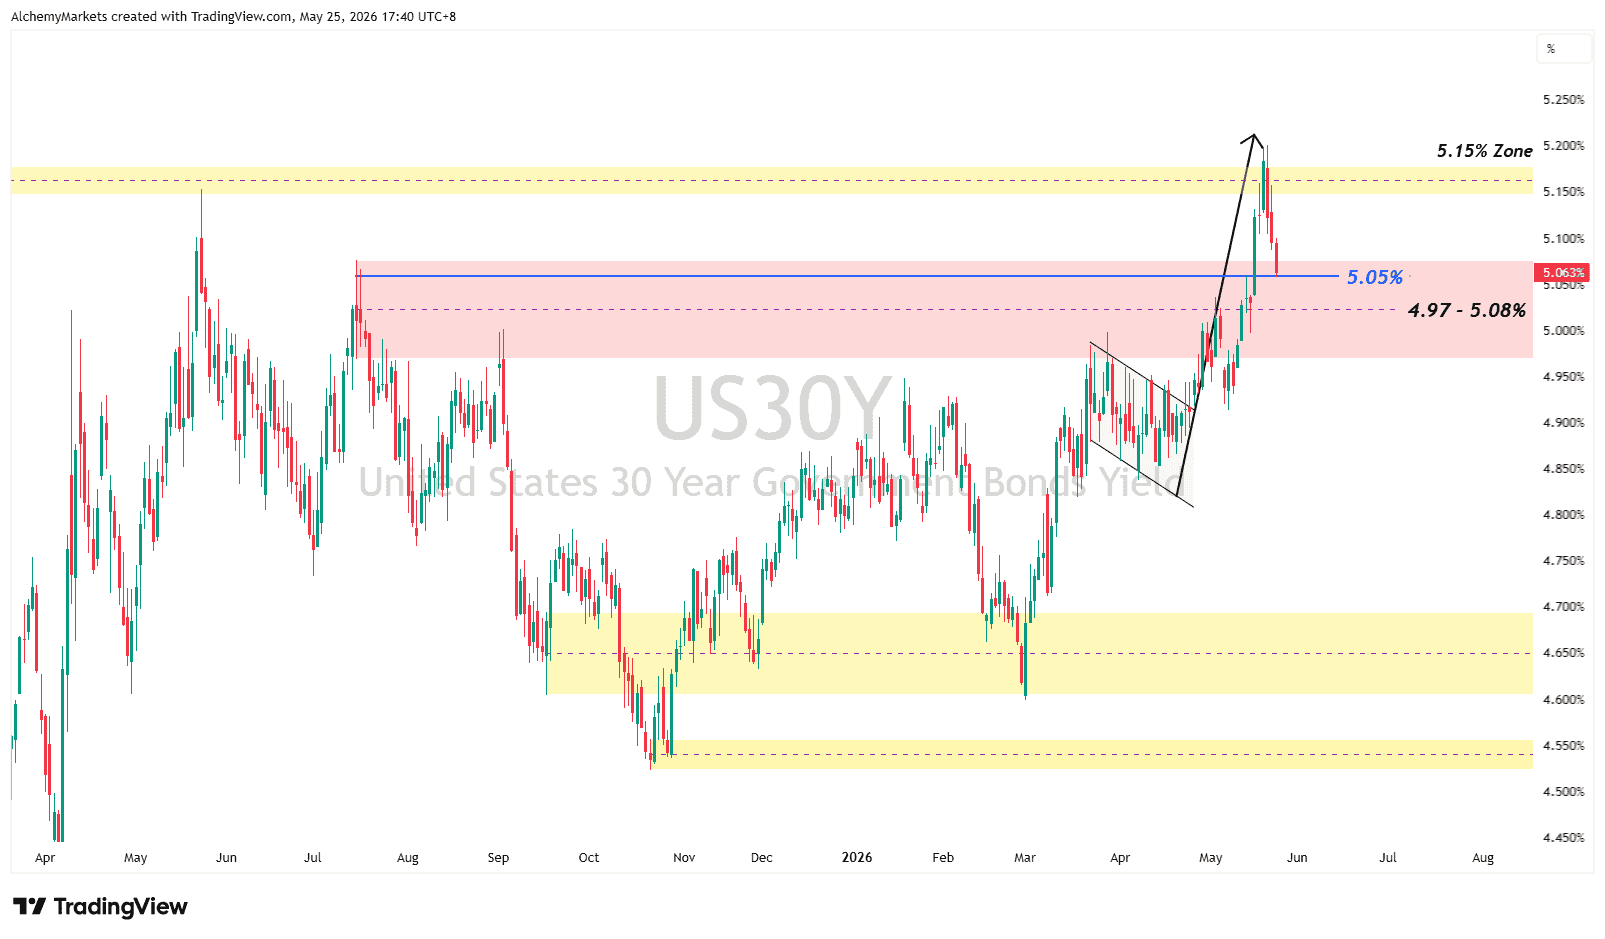
The reason is simple. Lower oil helps the inflation story, but rate-hike risk has not gone away. If long-end yields start rising again, oil relief may not be enough to keep risk sentiment supported.
FedWatch Shows Hike Risk Is Back on the Table
The latest CME FedWatch pricing shown in the rate-probability table points to around a 10% chance of a July hike and a more meaningful 27.9% chance of a September hike.
September is still mostly priced for no change at 72.1%, with 0% odds of easing, but the direction of travel is important.
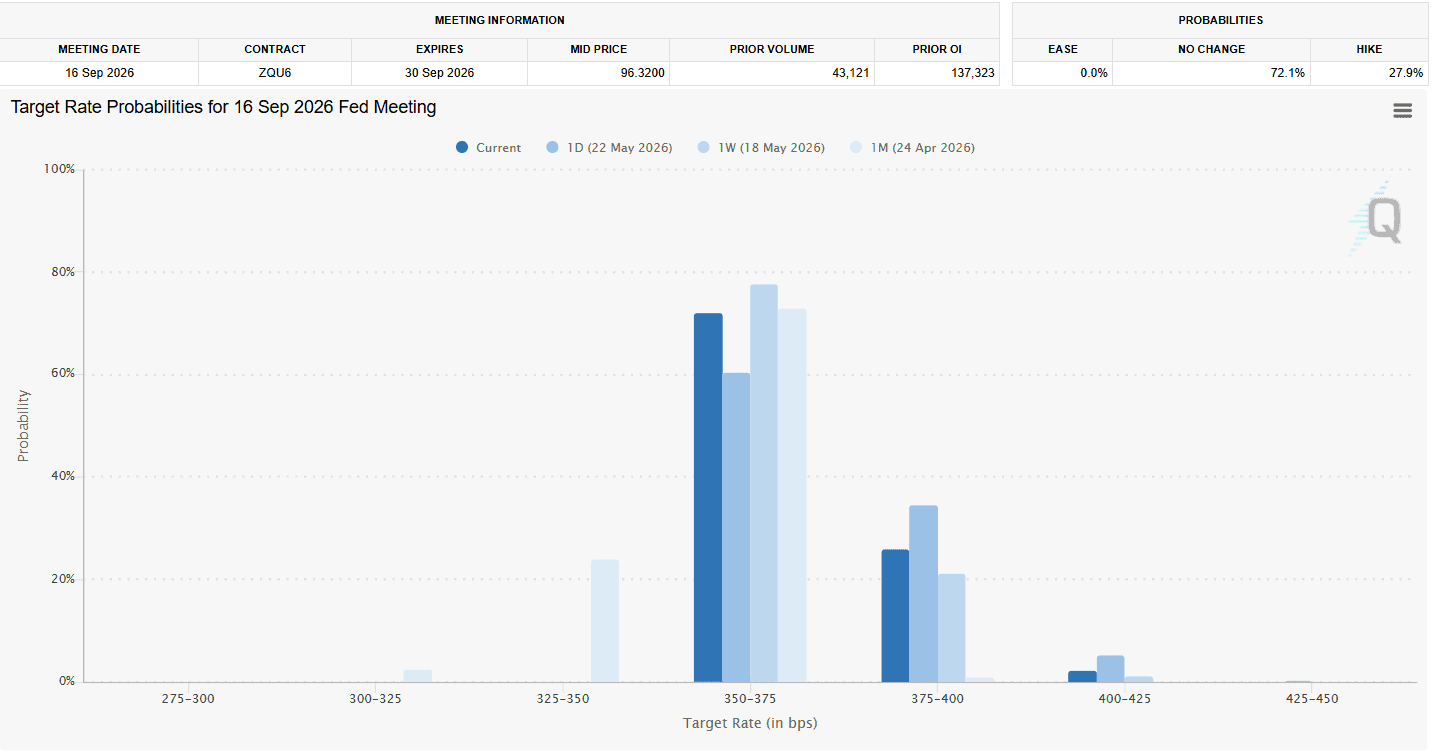
CME FedWatch tracks the probability of Fed rate changes implied by 30-Day Fed Funds futures, so this is market pricing rather than official Fed guidance.
That leaves markets in a slightly awkward position. Oil is cooling, the dollar is softer, and risk sentiment is better. But if traders are starting to price hikes again, US30Y becomes the cleaner stress test.
Consumer Confidence Today, PCE on Thursday
Today’s U.S. consumer data gives traders the first check on whether the economy is still holding up.
A stronger confidence print can support stocks if traders read it as proof the consumer is still resilient.
The catch is that it can also keep yields firm if markets read it as demand-side inflation pressure. A weak print may help yields cool, but it creates a different problem: slowing growth.
| Read: Today’s data is not just “good number equals good market.” How equities react will give insights on whether traders care more about growth or inflation on the day. |
Thursday’s PCE print is the bigger macro test. If PCE cools, the pullback in yields becomes easier to trust. If PCE stays hot, the lower-oil story becomes weaker because it would suggest inflation pressure is still sticking outside energy.
Oil Drops as War Premium Comes Out
Oil is still the reason markets have some relief to work with. Brent and WTI fell sharply as markets priced stronger odds of progress between the U.S. and Iran.
The move is really about Hormuz. If traders believe the supply shock is easing, oil can drop quickly because the market no longer needs to price the same war premium.
That helps risk sentiment. Lower oil reduces inflation pressure, supports equities, and makes it easier for yields to cool. But the peace story is not clean enough to treat this as a full reset.
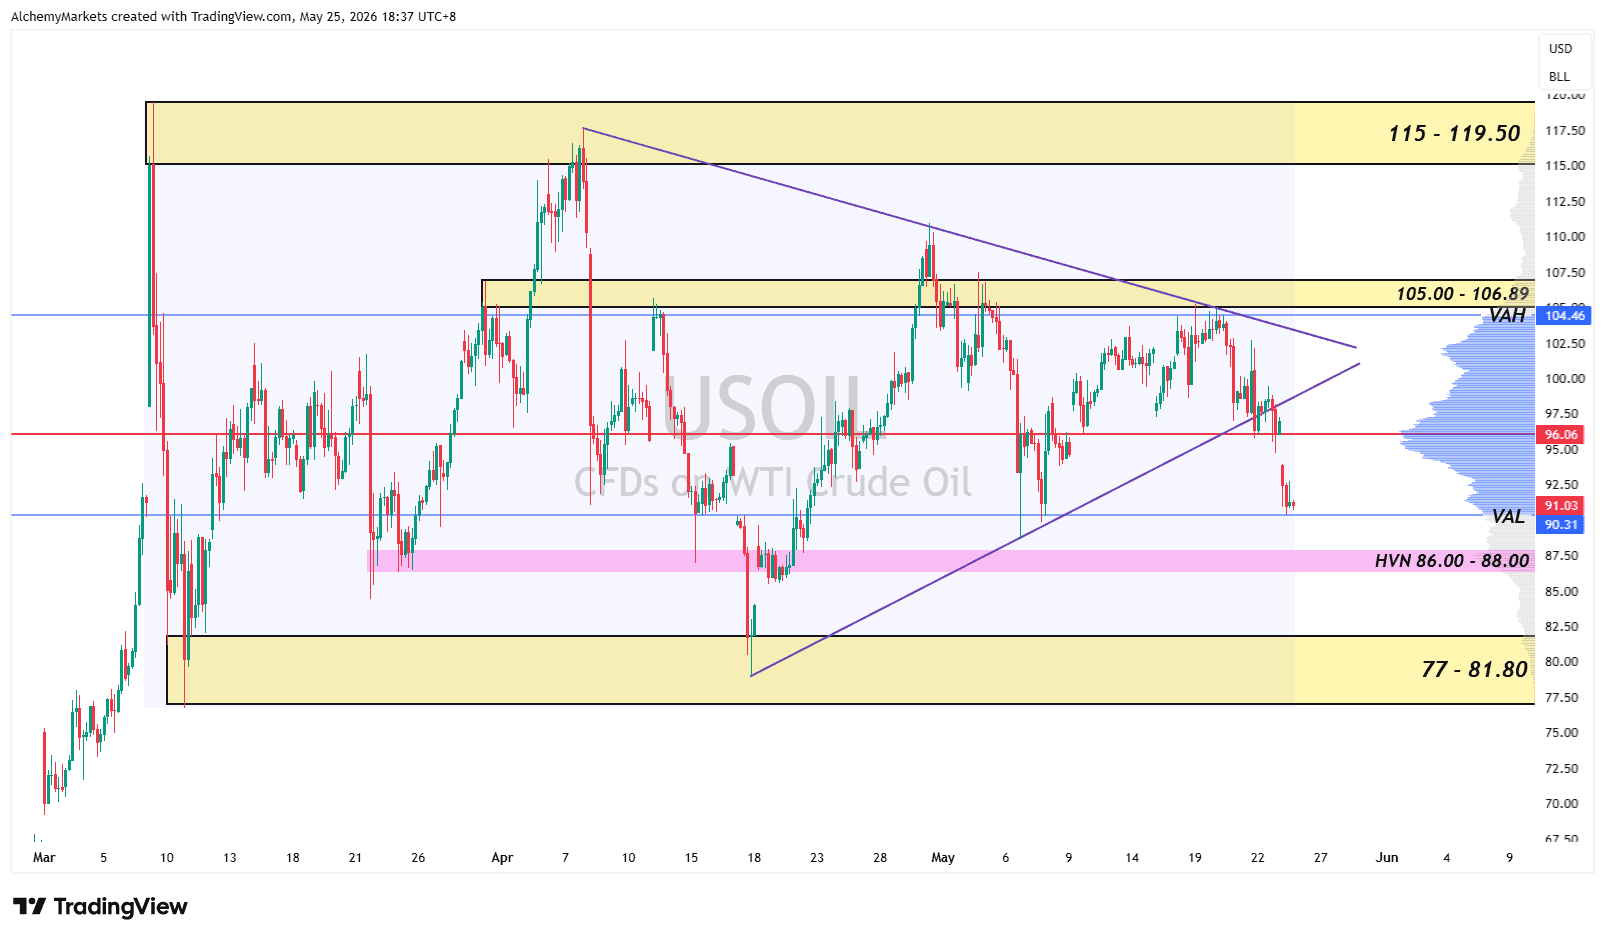
The USOIL chart matches the news flow. Price has broken lower from the 4H triangle and fallen below the 96.06 POC, anchored to the beginning of the largest decline since March 8th.
That means the 96 price zone is now a resistance, and also acts as a potential signal of a triangle breakout.
The next level is 90.31 VAL. If oil stays below 96.06 and loses 90.31, the next major downside area is 86 to 88, a high volume node support. After that, the lows between 77 to 81.80.
For traders using Volume Profile, the message is simple: oil is still trading within its fair value, but has now curved to the lower end of its value area. This could catch a bid, but if the VAL is lost, it’s a sign of weakness.
Dollar Poised For Upside If 100 Clears
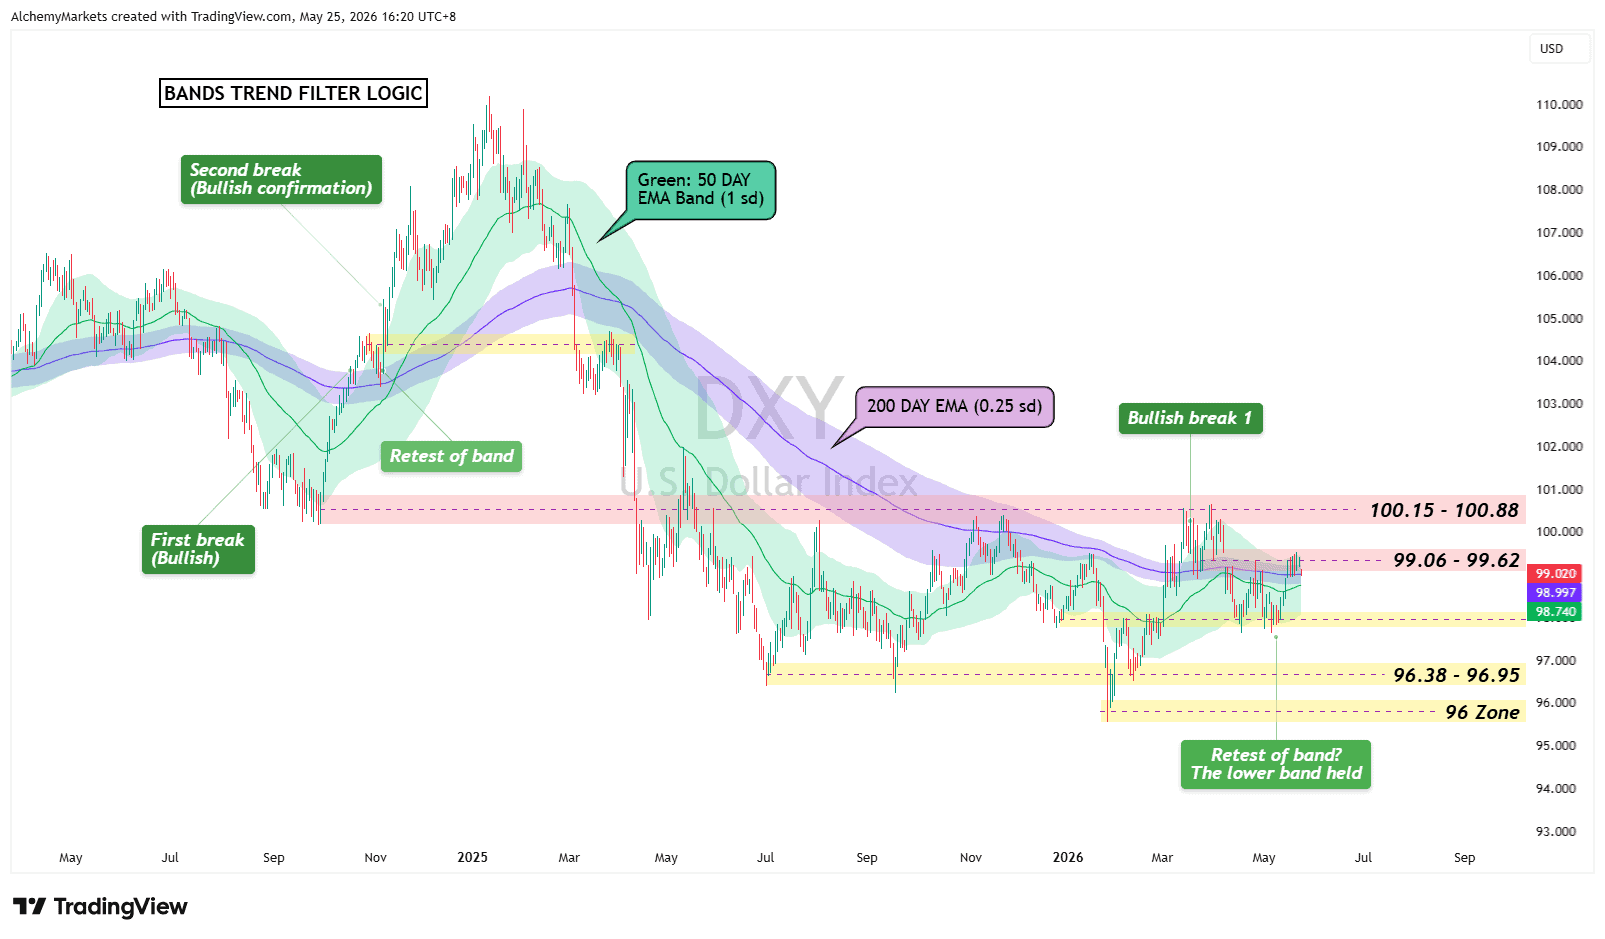
DXY is still helping the risk-on mood for now, but the dollar is not far from a more bullish signal.
Using the trend-filter logic from the Bollinger Bands setup, a break above 99.06 would be the first sign that the dollar is ready to turn higher again. The reason is simple: the 50 EMA band is above the 200 EMA band, and two breaks of the 50 EMA Band typically signals an asset is entering a new trend.
That makes 99.06 to 99.62 the first area to watch. If DXY clears it, the next test is the bigger 100.15 to 100.88 zone. A move through that area would make the dollar recovery look much stronger.
Until then, DXY is still capped. That helps the current risk-on tone, but only while oil and yields keep cooling.
Only when DXY breaks back above 100 while US30Y turns higher, the relief trade becomes much harder to trust.
Bottom Line
Iran optimism has bought markets time by pushing oil and yields lower. That keeps the relief trade alive for now.
The rally can survive if US30Y stays below the 5.05% to 5.15% danger area and PCE does not revive inflation fears. If yields turn back up while FedWatch hike odds keep rising, oil relief may not be enough.