Scritto da:

- Opening Bell
- Luglio 16, 2026
- 7 min di lettura
TSMC Crushed Earnings. So Why Are Chip Stocks Falling?
Taiwan Semiconductor Manufacturing Company delivered the blowout earnings investors had been waiting for. Revenue reached the top of guidance, margins exceeded expectations and the Q3 outlook pointed to another sequential increase. ASML also beat and raised its full-year forecast.
The expected celebration did not follow. TSM fell, while SK Hynix, Samsung and the wider semiconductor market came under heavier pressure. The contradiction offers the clearest update on the AI trade: investors still believe in the demand, but they are becoming less willing to pay as though today’s scarcity and margins will last indefinitely.
| Key takeaway: The market is not pricing an immediate collapse in AI spending. It is beginning to test how long chip scarcity can last, how much new capacity will cost, and whether customers can earn enough from the infrastructure they are buying. |
TSMC’s Q2 Revenue and Gross Margins
TSMC reported Q2 revenue of $40.2 billion, at the top of its $39 billion to $40.2 billion range. Gross margin reached 67.7%, while operating margin rose to 60.3%, above the upper end of guidance.
For Q3, management expects revenue of $44.6 billion to $45.8 billion. The midpoint implies roughly 12% sequential growth, although the 65% to 67% gross-margin range points to some moderation from Q2.
| Q2 revenue | Gross margin | Operating margin | Q3 revenue guide |
| $40.2bn | 67.7% | 60.3% | $44.6bn-$45.8bn |
Part of the profit increase came from a NT$63.2 billion disposal and mark-to-market gain on Vanguard International Semiconductor shares. The operating picture was still strong, with higher utilisation, 12% sequential revenue growth and a 65.4% annual increase in operating income.
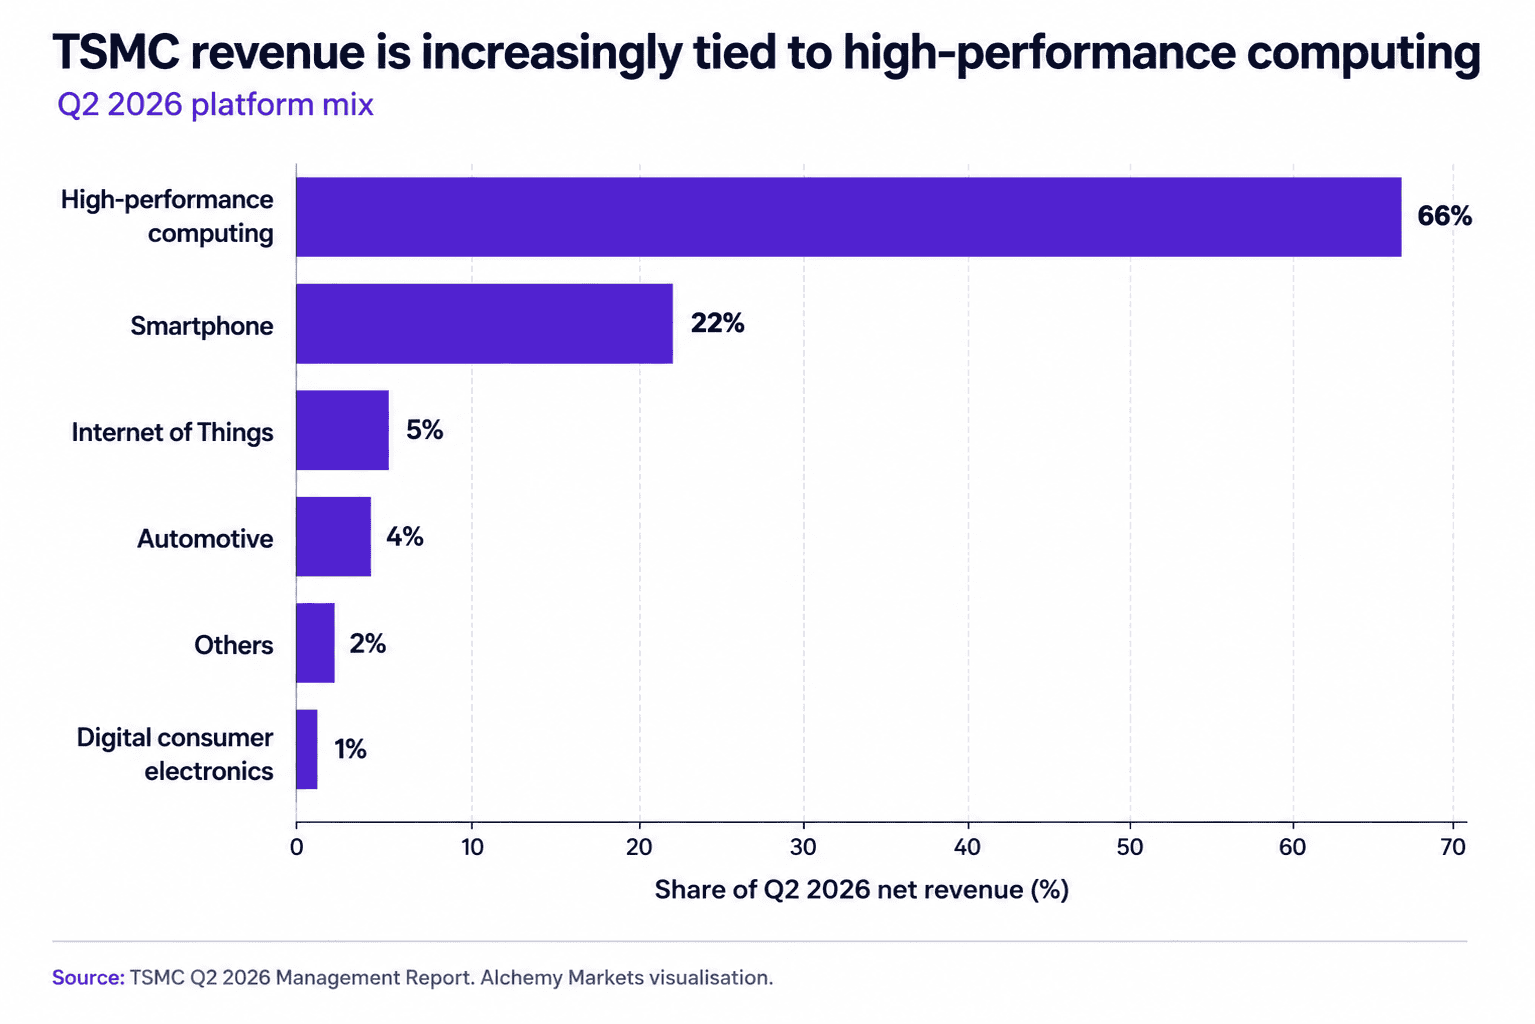
High-performance computing accounted for 66% of revenue, up from 61% in Q1. That concentration makes TSMC a more direct gauge of the AI buildout, but it also ties the valuation more closely to one demanding growth story.
Capital expenditure reached $15.7 billion during Q2 and $26.8 billion in the first half. Capacity is expanding because orders are strong, although free cash flow fell sequentially as investment grew faster than operating cash flow. Investors are therefore looking beyond sales and asking what return each new factory and packaging line will produce.
Sources: TSMC Q2 2026 quarterly results; TSMC Q2 management report; ASML Q2 2026 results.
Why TSMC sits at the Centre of the Chip Market
TSMC is a dedicated foundry. It manufactures processors designed by other companies, which places it between chip designers and the cloud groups buying the finished systems. Its results can therefore confirm demand across much of the semiconductor chain.
| Layer | Examples | Role in the AI chain |
| Design | Nvidia, AMD, Huawei | Creates GPUs, accelerators and custom processors. |
| Foundry | TSMC, SMIC, Hua Hong | Turns designs into physical silicon. |
| Equipment | ASML, Applied Materials | Supplies the machines used to make chips. |
| Memory | SK Hynix, Samsung, Micron | Supplies DRAM, HBM and storage beside processors. |
| Cloud | Meta, Microsoft, Amazon, Alphabet | Funds data centres and attempts to monetise the capacity. |
What does the TSM chart show?
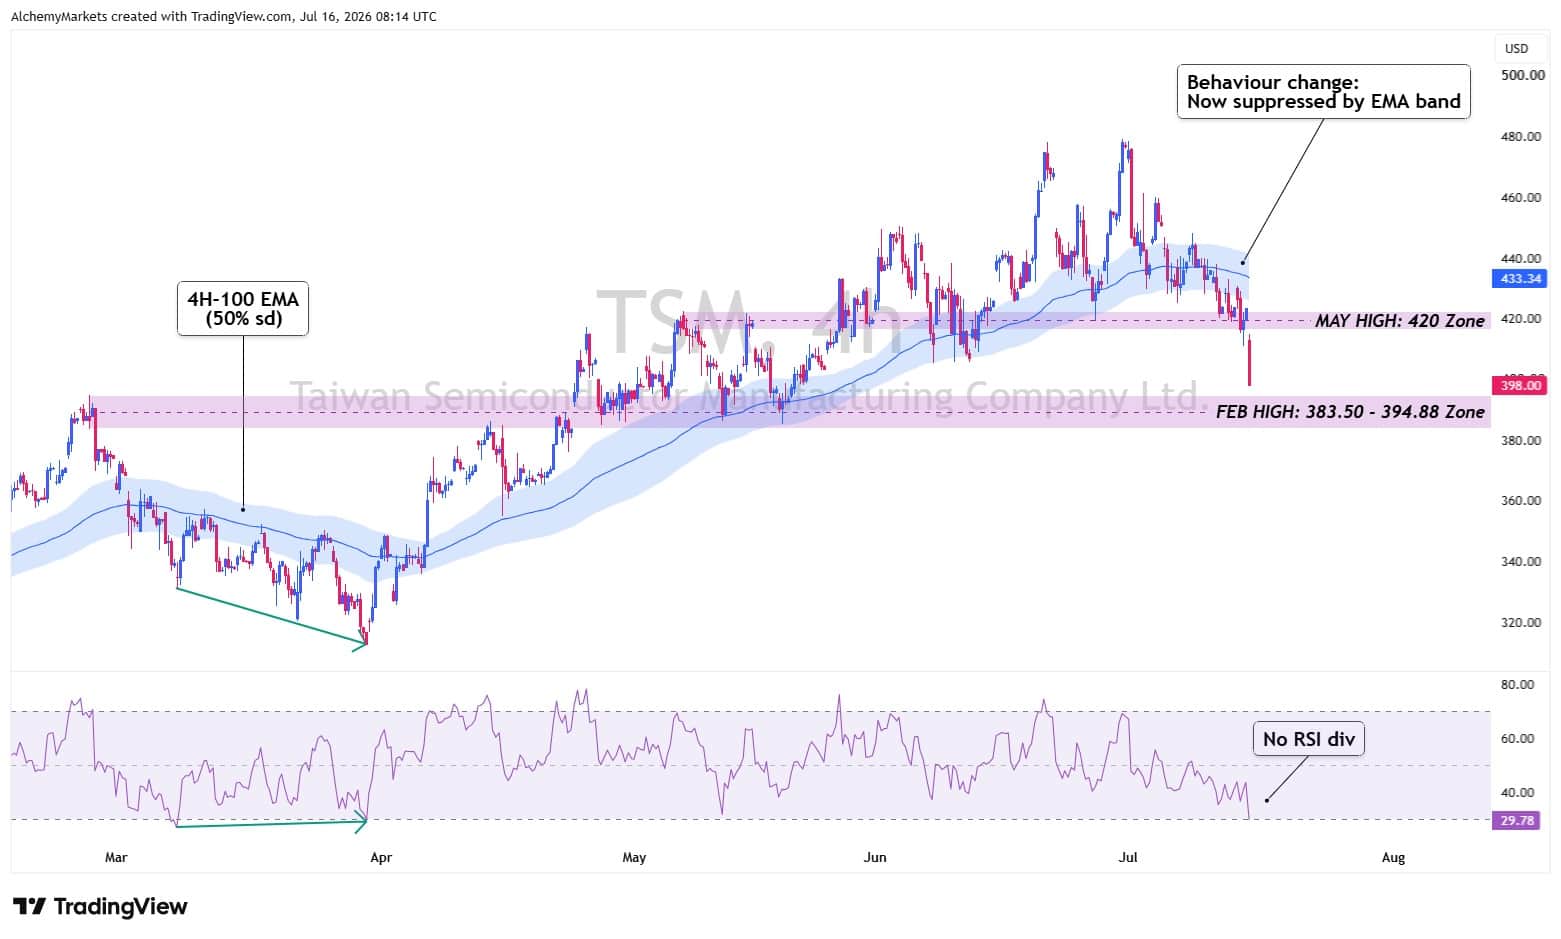
TSM has fallen below its four-hour 100-period exponential moving average band, built using Bollinger Bands with a 0.5 standard-deviation width. The band supported pullbacks from April onwards, but price is now below it near $433 and has also lost the May-high area around $420.
The next major support zone sits at approximately $383.50 to $394.88, based on the February highs. The four-hour Relative Strength Index is oversold, although there is no confirmed bullish RSI divergence similar to the March reversal.
A move back above $420 would ease some of the immediate pressure. Reclaiming the EMA band near $433 would provide stronger evidence that the earlier trend is returning. A break through the February-high zone would leave the correction with less technical support.
Are Semiconductors Under Pressure as a Whole?
Semiconductors earnings remain favourable, and yet, the pullback across TSM, Samsung, SK Hynix, Micron and even Chinese chip companies remain undeniable.
That tells us that even though the fundamentals are strong, the market may have already priced that in, and is now considering the point where increased supply, competition or weaker returns could end the current scarcity premium.
Three developments help explain that shift. Reports that CoreWeave is considering derivatives to protect against a future fall in memory prices show that a large buyer is managing the risk created by long-term contracts and price floors. This is not evidence that demand has disappeared, but it tells investors that customers are preparing for a more normal memory cycle.
China’s CXMT is also raising substantial capital to expand DRAM production and develop more advanced memory. It remains behind SK Hynix, Samsung and Micron in leading HBM, but its share of the wider DRAM market has already increased.
New capacity does not solve the shortage overnight, although the market can reduce the scarcity premium before supply fully catches up.
ASML creates the other side of the same story. Strong orders confirm that manufacturers are expanding, while better lithography tools and higher yields make it possible to produce more advanced chips over time. The same investment that supports equipment earnings today can eventually make memory and foundry capacity less scarce.
DRAM and HBM: Memory Bottleneck behind AI
DRAM, or Dynamic Random Access Memory, is the temporary working memory used by computers, smartphones and servers. It supplies information that a processor needs immediately, and the data disappears when power is removed.
HBM, or High Bandwidth Memory, is an advanced form of DRAM. Several memory dies are stacked vertically and placed close to an AI accelerator, allowing much more data to reach the processor at once. All HBM is DRAM, but most DRAM is not HBM.
AI workloads often run into memory-bandwidth limits. A powerful accelerator cannot reach its full potential when it spends too much time waiting for data, which has made HBM a high-value bottleneck and strengthened SK Hynix’s position in the AI supply chain.
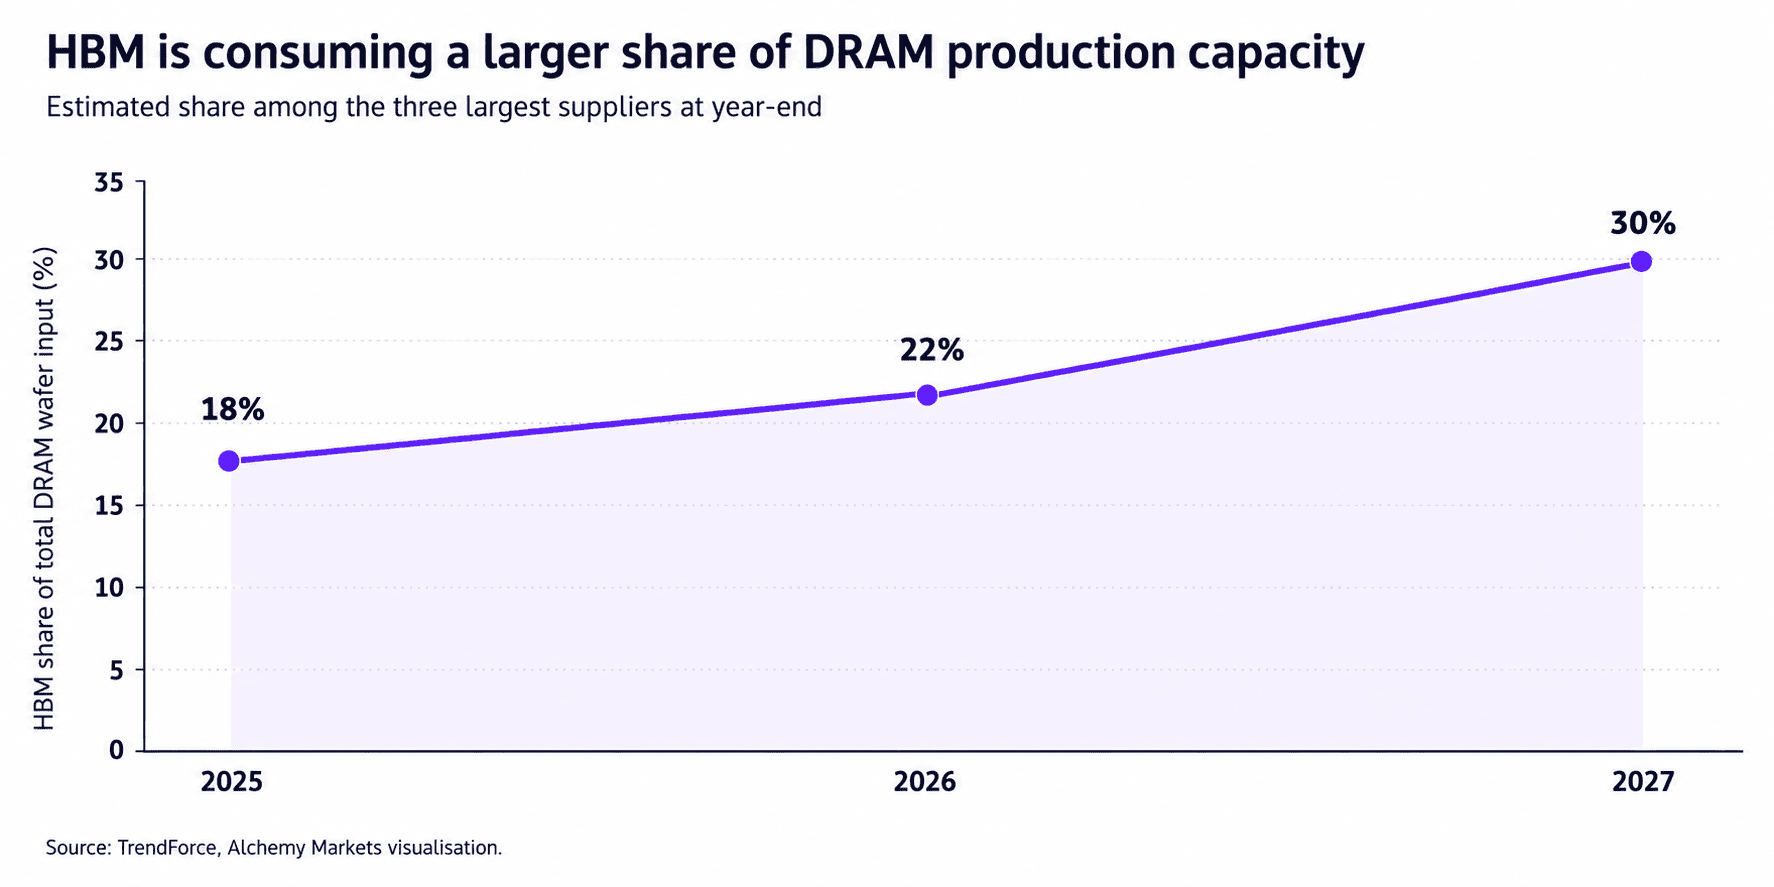
TrendForce estimates that HBM could use 22% of the three largest suppliers’ DRAM wafer input by the end of 2026 and 30% by the end of 2027. Diverting wafers towards larger HBM dies can tighten conventional DRAM supply in the near term, while the investment required to serve HBM demand raises the longer-term risk of more capacity.
SK Hynix is the clearest listed HBM leader, while Samsung combines memory with foundry and consumer-electronics exposure. Their joint sell-off can therefore reflect several concerns at once: HBM valuation, conventional DRAM prices, Korean positioning and the amount of capacity likely to arrive later in the cycle.
CPI and PPI helped rates, but not enough to rescue chips
June CPI fell 0.4% month-on-month and annual inflation slowed to 3.5%. Core CPI was unchanged during the month and eased to 2.6% annually. The detail was favourable for bond yields, although energy fell 5.7% and gasoline fell 9.7%, so part of the improvement depended on a large energy reversal.
The latest PPI breakdown showed a similar pattern. Headline producer prices fell 0.3%, final-demand goods declined 1.4% and services rose 0.2%. Gasoline producer prices fell 12%, leaving the relief sensitive to whether oil remains contained.
That in itself would also tie to geopolitical events, namely war tensions between US, Israel, and Iran. Renewed US-Iran tensions have placed oil back at the centre of the inflation outlook. The semiconductor market is therefore caught between softer recent inflation data and the risk that another energy shock keeps yields elevated.
Softer inflation would normally support highly valued technology shares by lowering rate pressure.
Bottom line
TSMC’s Q2 report still points to strong AI demand. Revenue, utilisation, leading-edge nodes and Q3 guidance all remained firm, while ASML and Samsung reported figures consistent with an active infrastructure cycle.
The market reaction shows that the argument has moved on from whether AI demand exists.
Investors are now judging how long scarcity can last, how quickly new capacity arrives and whether hyperscalers can monetise the hardware fast enough to support current valuations.
For TSM, the $383.50 to $394.88 area is the next technical test. A recovery through $420 and the EMA band near $433 would improve the read. Continued weakness across memory, foundries and equipment after strong earnings would keep the risk of a broader rotation away from the most extended AI hardware trades.