Scritto da:

- Chart of the Day
- Luglio 28, 2025
- 3 min di lettura
EUR/USD Stalls Despite Tariff Relief — What’s Holding It Back?
Despite the bullish tariff news, EUR/USD remains inside a rising wedge pattern on both the weekly and daily timeframes. It is currently stalling beneath a major volume resistance zone.
The recent trade agreement between the US and EU — which reduced previously threatened tariffs to 15% — gave the euro a brief boost. However, price action hasn’t confirmed any true breakout yet.
While the technical structure remains bullish, momentum is visibly waning, and EUR/USD is struggling to push through the top of a rising channel, and a volume resistance zone ($1.178 — $1.194).
The key takeaway from here is this:
- EUR/USD technicals are short term bearish.
- However, fundamentals point to a mid term bullish EUR/USD.
It’ll all come down to the Euro-Dollar asset confirming a direction via price action.
Technical Analysis of EUR/USD (Late July 2025)
Weekly View — Rising Channel and Critical Zones
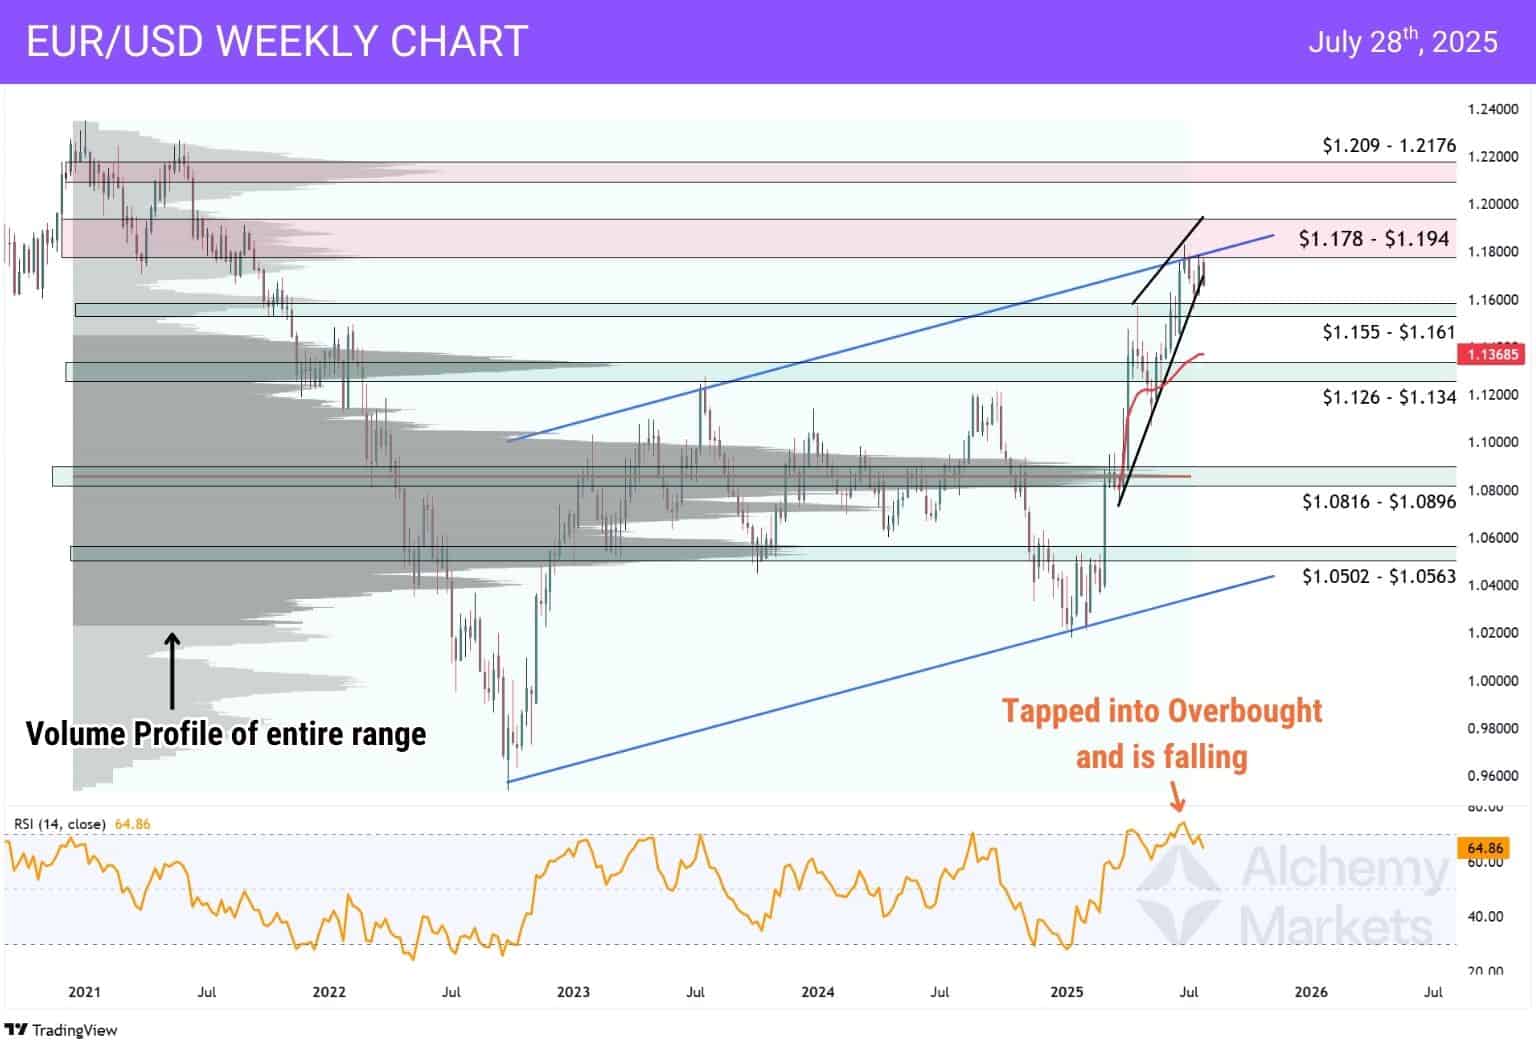
Since the start of 2021, EUR/USD has fallen from the $1.20 region to a low near $0.98, briefly hitting parity in 2022.
But since that bottom, the pair has staged an impressive recovery — climbing back toward the $1.178 area, now just a few cents away from its 4-year high.
That said, price is currently stalling at the $1.178 range, which lines up precisely with the top of a rising channel on the weekly chart. If bulls want to push higher, this zone must be broken convincingly.
Key Volume-Based Zones (Last 4 Years)
- Immediate Resistance: $1.178 – $1.194
- Major Resistance (4-Year High): $1.209 – $1.2176
- Immediate Support: $1.155 – $1.161
- Lower Support: $1.126 – $1.134
- Critical Support (Point of Control): $1.0816 – $1.0896
RSI Context
The RSI has been climbing steadily throughout 2025, reflecting strong bullish momentum — but also signalling the risk of exhaustion. It has now tapped into overbought territory twice this year, with the most recent move forming a bearish RSI failure swing.
That’s often seen as a warning sign for bulls and can precede a retracement.
Daily View — Rising Wedge and Anchored vWAP Support
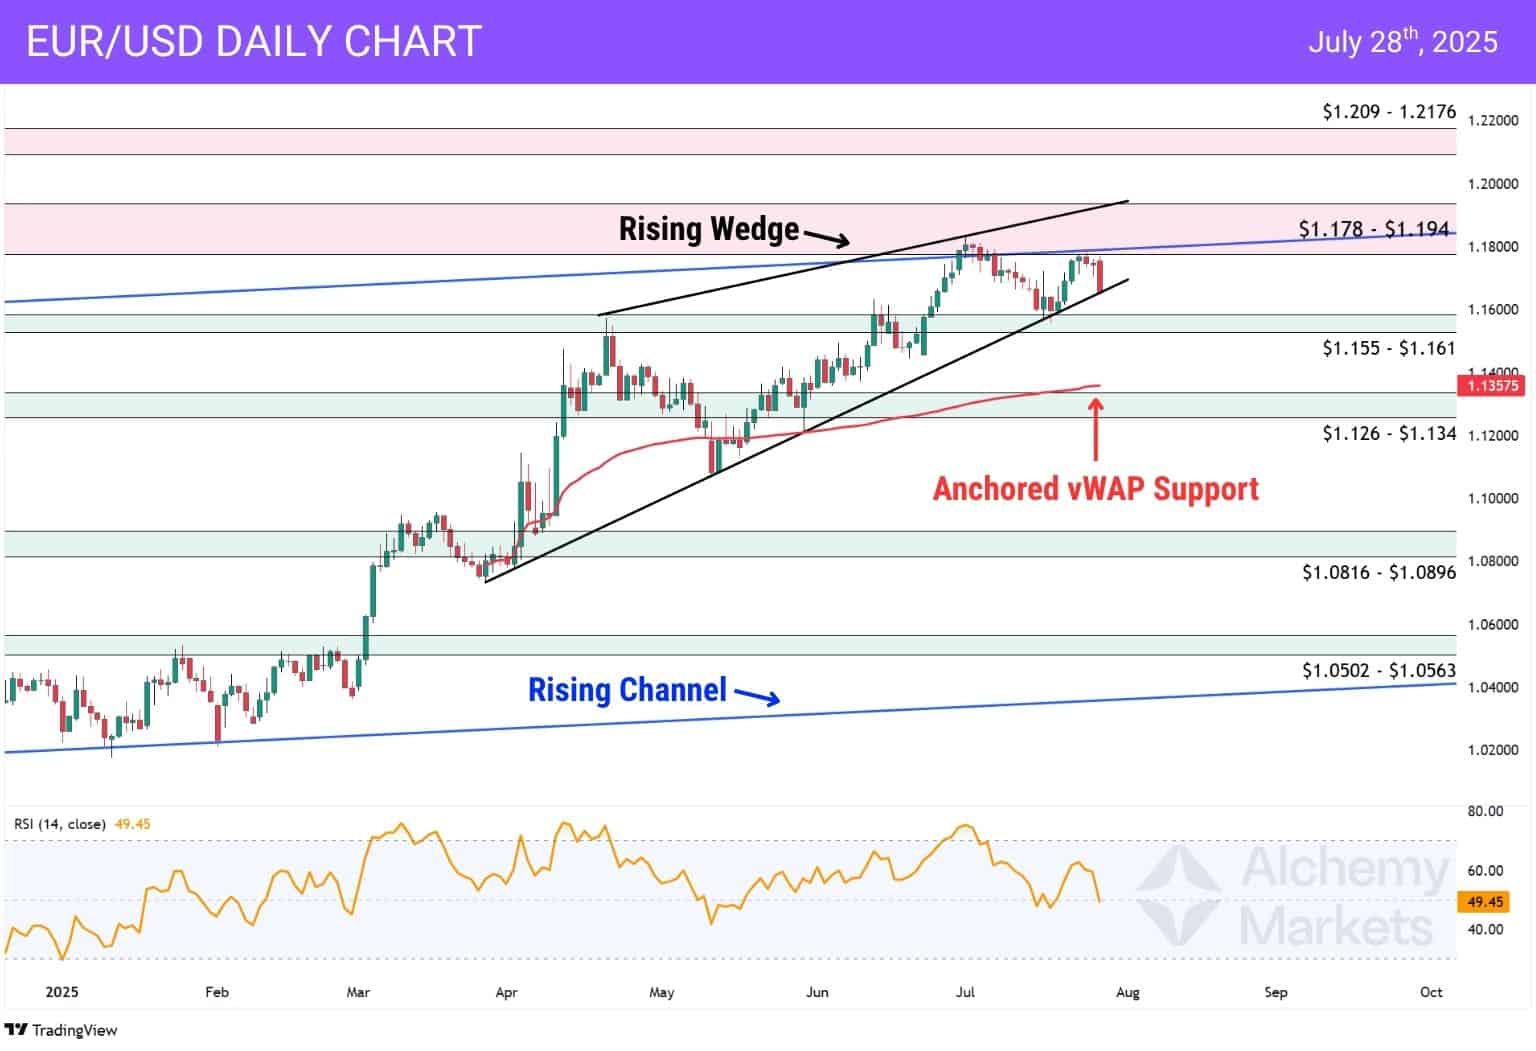
On the daily chart, EUR/USD has rejected the top of a rising channel, giving shape to a rising wedge — a bearish pattern often seen before reversals, especially when price begins compressing like this.
Price is now testing the lower wedge trendline, with $1.155–$1.161 as the first support. If that breaks, watch $1.126–$1.134, a stronger zone that aligns with the anchored vWAP from March 2025 — a key level marking the average price of this rally.
Should this zone give way, the next target is $1.0816–$1.0896, the Point of Control since 2021. That would mark a deeper pullback, approaching parity levels; though this outcome seems less likely for now.
Bottom Line
With the market still pricing in a Fed rate cut in September and midterm fundamentals supporting the euro, this may just be a short-term correction in an overall bullish trend.
- 📉 Technicals: Lean short-term bearish — rising wedge under pressure
- 📈 Fundamentals: Mid-term bullish — driven by easing Fed and trade relief
- 🔁 Conclusion: A retracement seems logical here, but broader continuation still favoured
You may also be interested in: