


Written by:


- Weekly Outlook
- May 10, 2024
- 6 min read
The Week Ahead: US Inflation Takes Center Stage
- US CPI Comes into Focus Following a Bout of Weaker US Jobs Data.
- Asia Pacific Focus Lies on Chinese Inflation and Japanese GDP.
- Can WTI Oil Arrest its Recent Slump and Regain the $80 a Barrel Mark?
Week in Review
Following a week in which softer jobs data from the US-dominated, US inflation will be at the forefront for the week ahead. Having faced some struggles for the majority of the week, the US Dollar finally came to life on Friday ending the week on a high.
US Dollar strength on Friday came about thanks to higher US Treasury yields as well as anticipation of next week’s US inflation report. Inflation has remained sticky of late in the US and global central banks will be keeping a close eye on developments as well.
The ECB minutes released toward the back end of the week showed growing optimism regarding a June rate cut. The reason why US inflation remains a concern for the ECB is historically Euro Area inflation tends to lag behind the US and thus a last-minute rise in Euro Area inflation could scupper the ECBs plans to cut rates in June.
Read the Full ECB Minutes
UK GDP released on Friday indicated the UK economy was in a shallow recession in Q1 but has since returned to growth. The United Kingdom’s 0.6% economic expansion in the three months through March was better than analysts had expected. Despite this the Bank of England (BoE) meeting on Thursday struck a dovish tone and was followed up by US dollar strength on Friday which kept GBPUSD largely on the back foot.
UK GDP DATA
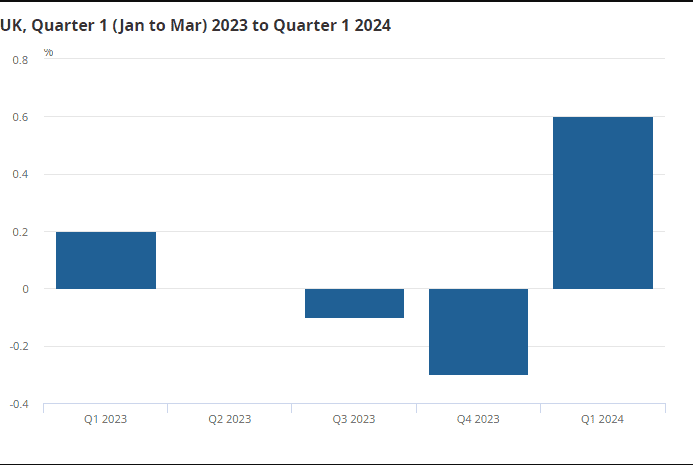
Source: ONS, FinancialJuice
US Equities continued their recovery this week. Surprising given the amount of hawkish Fed rhetoric toward the back end of the week with Federal Reserve Policymaker Bowman stating she doesn’t see rate cuts as warranted this year. Comments such as this only add more intrigue to next week’s inflation print.
The Week Ahead: US and Chinese Inflation Data Likely to Dominate
A massive week ahead for global markets as US inflation data lies ahead. The Dollar has held the high ground of late and another rise in US inflation could spur another rally for the Greenback. A miss to the downside may have the opposite effect with market participants likely to reprice the probability of rate cuts in the second half of 2024.
As things stand central banks continue to diverge on their policy outlook. The ECB looking to cut interest rates in June with the BoE warming up as well. Market participants, however, are pricing in a first-rate cut from the Fed in September. I will be keeping a close eye on how this changes in the week ahead as it could be pivotal to the US Dollars next move.

Source: CME FedWatch Tool
There isn’t much in the way of high-impact data from the Euro Area but we do have the UK jobs report. Following the GDP print this week market participants will be keeping a close eye on the jobs report with slower average earnings likely to bolster optimism for an early rate cut from the BoE. This could lead to some GBP weakness while rising earnings and a steady unemployment rate could have the opposite effect and lead to gains for the GBP.
Looking at Asia Pacific, the biggest data release is likely to be Chinese inflation which has been a problem for the world’s second-largest economy. In complete contrast to the rest of the world which has been suffering with uncomfortably high inflation, the Chinese central bank has been dealing with non-existent inflation which seems to have turned a corner since February. A continual improvement is likely to bolster global growth prospects and could help maintain a positive spin on sentiment.
Economic Calendar for the Week Ahead (UK Time GMT+1)
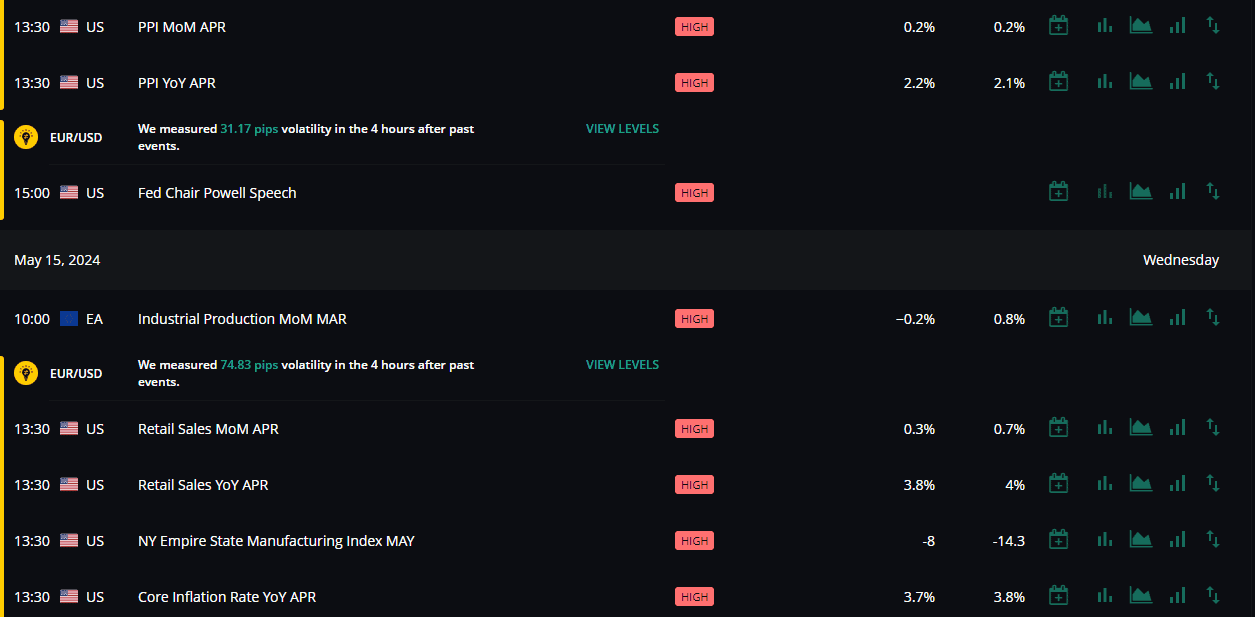
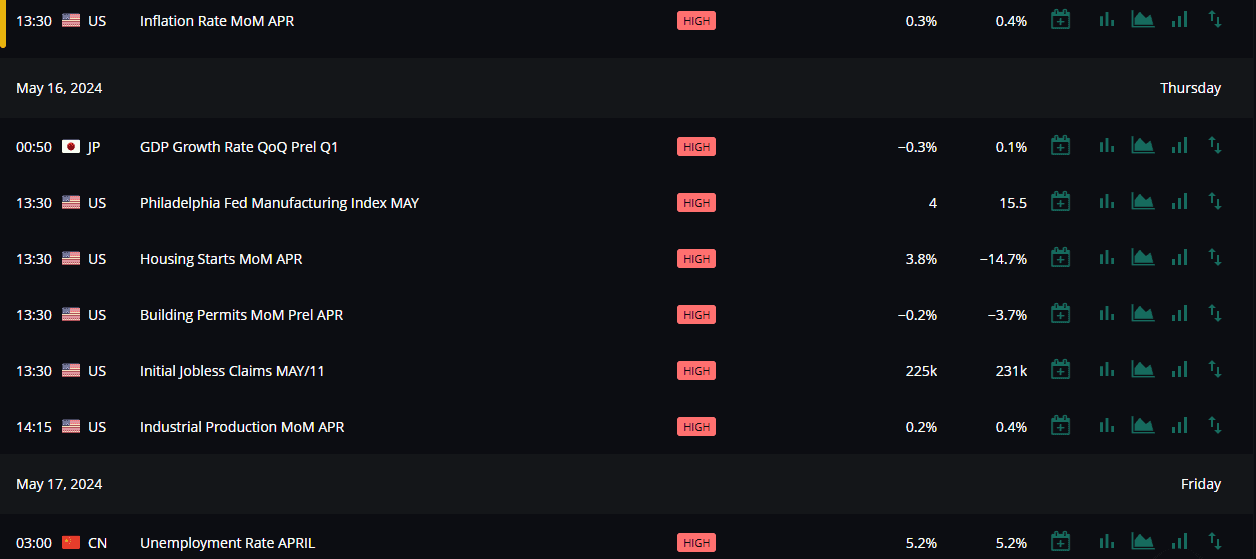
Source: FXIFY
Technical Outlook
FX
Looking at the FX space, both EURUSD and GBPUSD have remained rangebound for the majority of the week. Gains were immediately wiped out the next day as the cloud of central bank policy divergence continued to weigh on market participants.
USDJPY has been a rollercoaster of late with the Bank of Japan intervention seeing the pair push away from the 160.00 psychological level. Since USDJPY has bottomed out at around the 152.00 level before resuming its move higher to end the week just shy of the 156.00 handles. If we do get a rise in US inflation and a renewed rally in the Dollar Index (DXY), it will be interesting to see if USDJPY may be able to break through the 160.00 handle.
USDJPY Daily Chart
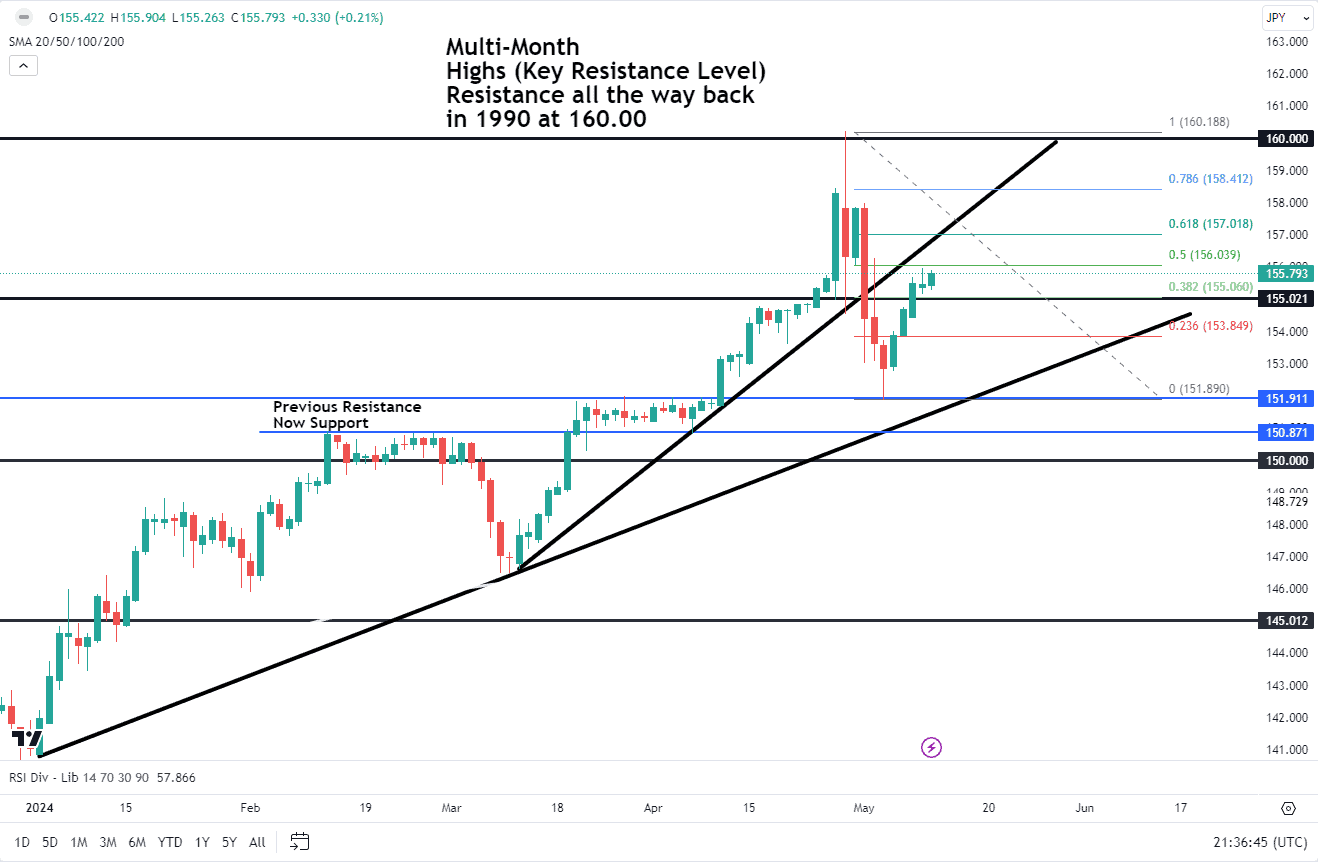
Source: TradingView
The technical outlook for USDJPY remains rather confusing. The bounce-off support at the 152.00 handle keeps the long-term uptrend still in play. However, as you can see chart above I have put in the Fibonacci retracement tool with the pair in a perfect zone for further downside.
USDJPY is approaching the 50% retracement level with the preferred 61.8%-78.6% retracement level resting between the 157.00 and 158.40 levels respectively. I will be keeping a close eye on these levels as a rejection here may be the start of the next leg to the downside.
Commodities
Oil prices have had an up and down week as evidenced by the weekly candle. The indecision is warranted as the price continues to test the ascending trendline. A break of the trendline brings support into play at 76.95 and 75.50. Alternatively, there is also a descending trendline in play with a break of that opening up further upside potential.
WTI Oil Daily Chart
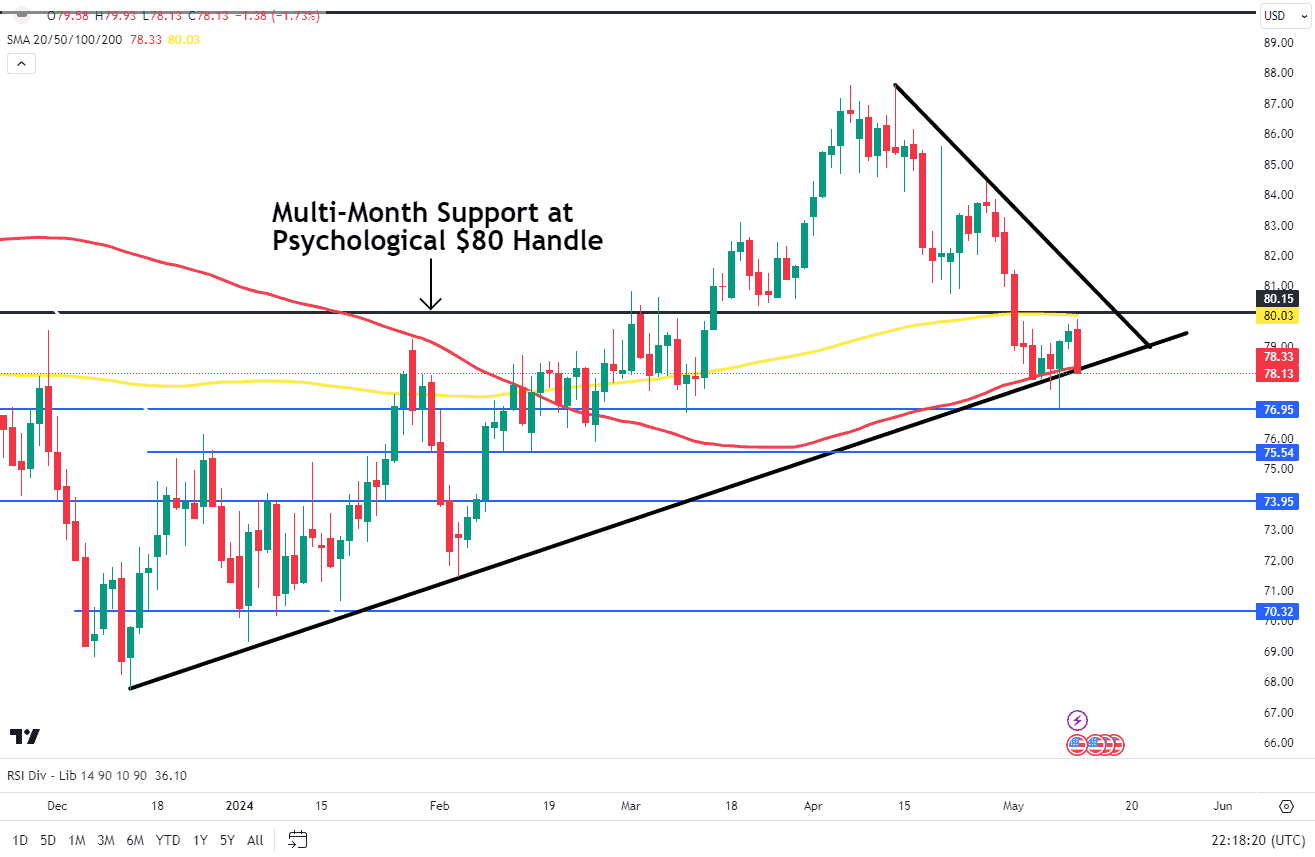
Source: TradingView
Key Levels to Keep an Eye on:
Support Levels
– 76.95
– 75.50
– 73.95
Resistance Levels
– 80.00
– 81.50
– 84.00
Gold has surprised this week pushing back toward its all-time highs. Tensions in the Middle East have somewhat taken a backseat of late but is still a concern. There has been a lot of Gold buying by Central Banks globally this year which has been led by the People Bank of China (PBoC). This could in part explain the resilience owed by the precious metal. I would advise caution however as the precious metal is struggling to rise convincingly above the $2400/oz mark.
Nasdaq 100: 50, 100-Day SMA to Keep Bullsin Control?
The Nasdaq and the SPX have enjoyed a positive week with gains of around 1.28% and 1.64% respectively. This brings both indexes within a whisker of their all-time highs with US inflation data ahead. Surprisingly US indexes have rallied following the last two CPI releases so another rise in CPI may not necessarily lead to a retracement but could see both indexes push on to print fresh highs.
Nasdaq 100/US100 Daily Chart
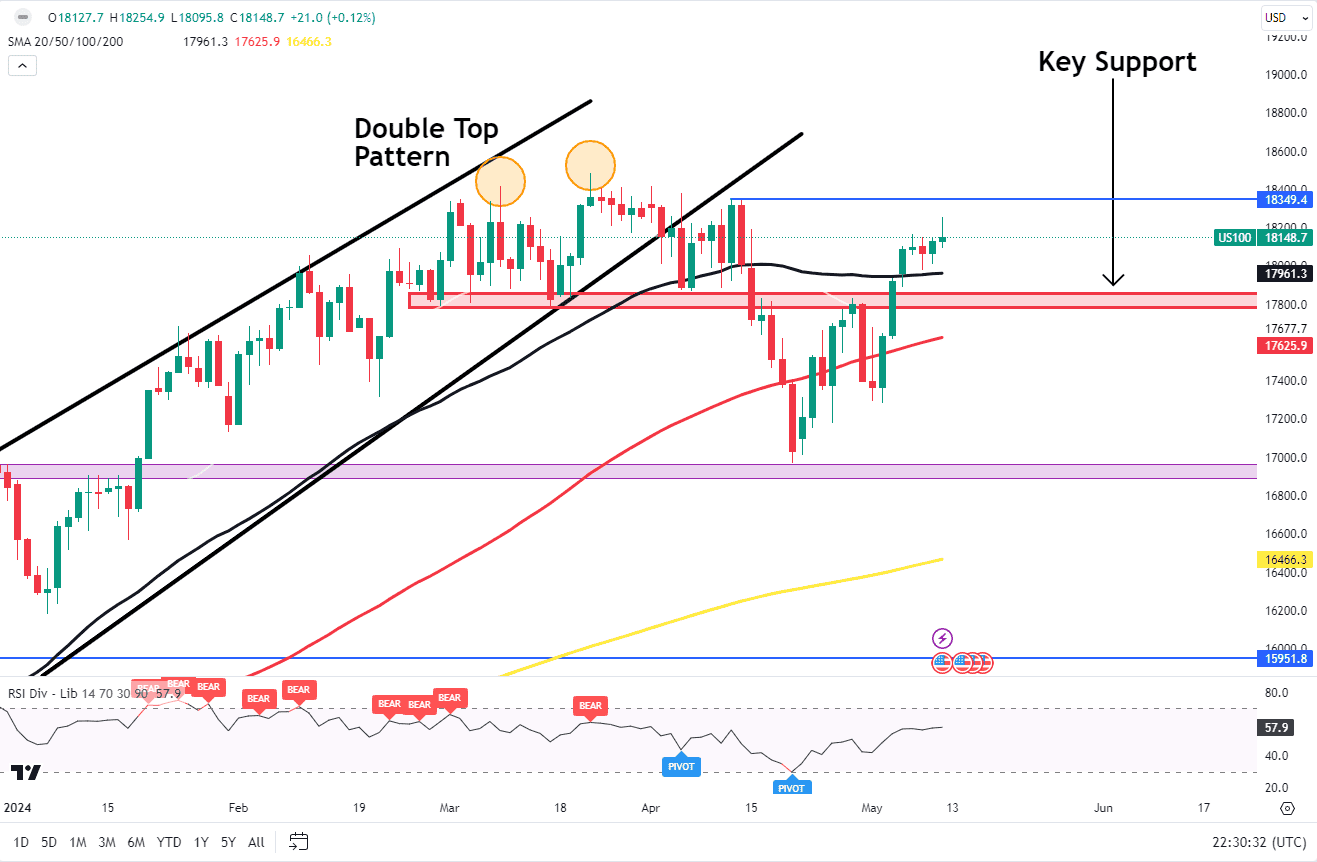
Source: TradingView
As you can see from the chart above the Nasdaq 100 is currently trading between a key area of support and resistance. Immediate resistance rests around the 18349 mark with the all-time high just above at the 18480 mark.
The 50-day MA rests at 17961 and could provide some support before the key support level around the 17800 mark. A break of this level brings the 100-day MA into focus at 17625 before the swing low support at 17300 becomes relevant.


