


Written by:


- Weekly Outlook
- May 29, 2026
- 5 min read
The Strait Reopens — So Why Won’t Crude Sell Off?
The headlines have a familiar ring to them. Washington and Tehran are reportedly close to a deal that would reopen the Strait of Hormuz, and for a market that has spent four months pricing energy disruption, that should be the green light to exhale. The detail underneath is messier — uranium enrichment and sanctions relief remain the same unresolved sticking points they were two months ago — but markets aren’t waiting for the fine print. Equities are at fresh highs, and short-term rate expectations have been falling in lockstep with crude.
The question worth asking is whether the central banks will be as quick to relax as the price action suggests. We don’t think they will, and the reasons are worth laying out.
For one, a deal doesn’t magically refill the tank. Even if barrels start flowing again by mid-summer, the world will have burned through a large chunk of inventory that now has to be rebuilt, and damaged infrastructure doesn’t repair itself overnight. That’s a floor under prices, not a trapdoor. Gas points the same way — Europe is increasingly fighting Asia for LNG cargoes, and the Bank of England has already cautioned that gas pricing looks a little too relaxed about the risks.
Then there’s the difference between what’s coming and what’s already gone. A signed agreement governs future flows; it does nothing about the energy the global economy has already done without. Every additional week of disruption seeps further into supply chains and pricing behaviour, and inflation expectations have been grinding higher the longer this drags on — almost independently of where spot oil trades on any given day. Equity markets get to trade the recovery. Policymakers are stuck managing the damage.
And finally, nobody at the ECB wants to be caught bluffing. Having spent weeks warning they’d respond if the conflict persisted — and it has — backing away now would invite markets to treat every future warning as noise. So expect a hawkish hold pattern in the near term, deal or no deal. The longer-term picture is a different conversation entirely.
The week ahead — three central banks, three different stories
The diary is busy, but the real interest is in how far apart the major central banks now sit.
ECB. A 25bp hike in June looks all but locked in. The nuance is that it’s likely a one-and-done — as much a statement that words have consequences as a genuine tightening cycle. Watch the guidance far more closely than the move itself.
Bank of England. The most interesting of the three. The hawkish case was always weaker here: policy is already restrictive, the labour market is showing cracks, and there’s little evidence that last year’s inflation spike has left a lasting mark. A June move now looks off the table, though July stays open if the Strait situation hasn’t been put to bed by then. Either way, don’t expect Threadneedle Street to sound the all-clear just yet.
Federal Reserve. A Hormuz deal probably doesn’t shift much in the near term. The hawkish tilt at the Fed isn’t only an energy story — six-month payroll growth has firmed up (though it leans heavily on healthcare hiring), and with migration slowing and the workforce ageing, the unemployment rate can stay put even when job creation cools.
The marquee release is Friday’s May jobs report, and the signals going in are contradictory. Survey data is soft — ISM employment is in contraction and online job postings have weakened — which on paper argues for a thin print. But the statistical adjustments the BLS uses to fill sampling gaps have a habit of flattering the headline. Base case is another print around 100k, with unemployment holding at 4.3%.
| Day | Release | Why it matters |
|---|---|---|
| Early week | ISM Manufacturing & Services (US) | Should stay consistent with ~2% growth; watch the employment sub-indices |
| Thursday | ECB rate decision | 25bp near-priced — the guidance is the real event |
| Friday | US May Non-Farm Payrolls | The headline of the week; ~100k expected, U/E at 4.3% |
| Throughout | BoE speakers | No June hike expected, but July hinges on the Strait |
The technicals — US Oil (WTI)
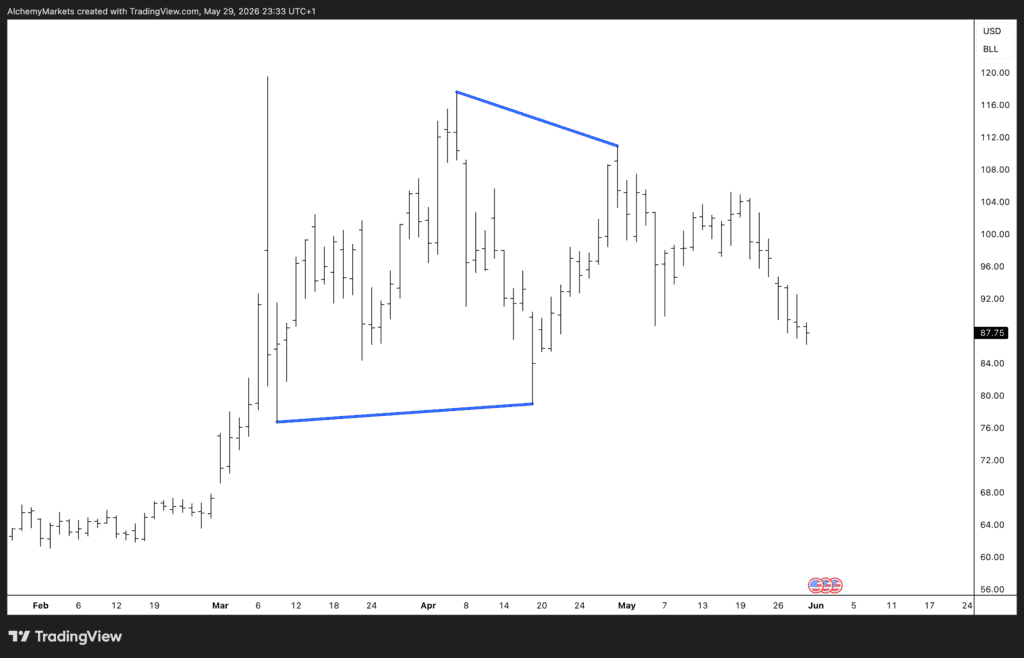
Here’s where it gets interesting, because the chart isn’t reading the deal the way the headlines are.
Crude rallied hard off the late-February base near $67, spiking to roughly $118 in early April before the momentum stalled. What’s followed is two months of tightening range: a descending line of lower highs falling away from that April peak, set against a slowly rising line of higher lows built off the $77 trough. The two are converging — a textbook symmetrical triangle — with price now sitting around $87.75, more or less in the middle of the structure.
The takeaway for the bigger picture is straightforward. Triangles are usually continuation patterns, and the move that led into this one was decisively bullish. So even with the deal narrative dominating sentiment right now, the structure itself still leans toward an upside resolution. A break and close above the descending trendline — broadly the $104–108 area — would reopen the path back toward the prior highs. It would take a clean break of the rising lower line, down near $80, to argue that the market genuinely believes in the relief story.
That’s the whole tension in one chart. The headlines say it’s over. The triangle says wait and see — and so, for now, do the central banks.






