


Written by:


- Weekly Outlook
- July 5, 2024
- 11 min read
Inflation and Its Ripple Effects: NZD/USD to U.S. Inflation
As we look ahead to the forthcoming week, we will be closely monitoring several key economic events.
These include:
1. RBNZ Interest Rate Decision
2. UK GDP (MoM) and (YoY)
3. US Michigan Sentiment Index
4. US Producer Price Index (PPI)
5. US Consumer Price Index (CPI)
In addition, we will be examining NZD/USD chart that illustrates current market trends and potential trading opportunity.
Now, let’s delve into the detailed analysis of each event on the economic calendar for the coming week.
New Zealand
RBNZ Interest Rate Decision
What is the RBNZ Interest Rate Decision?
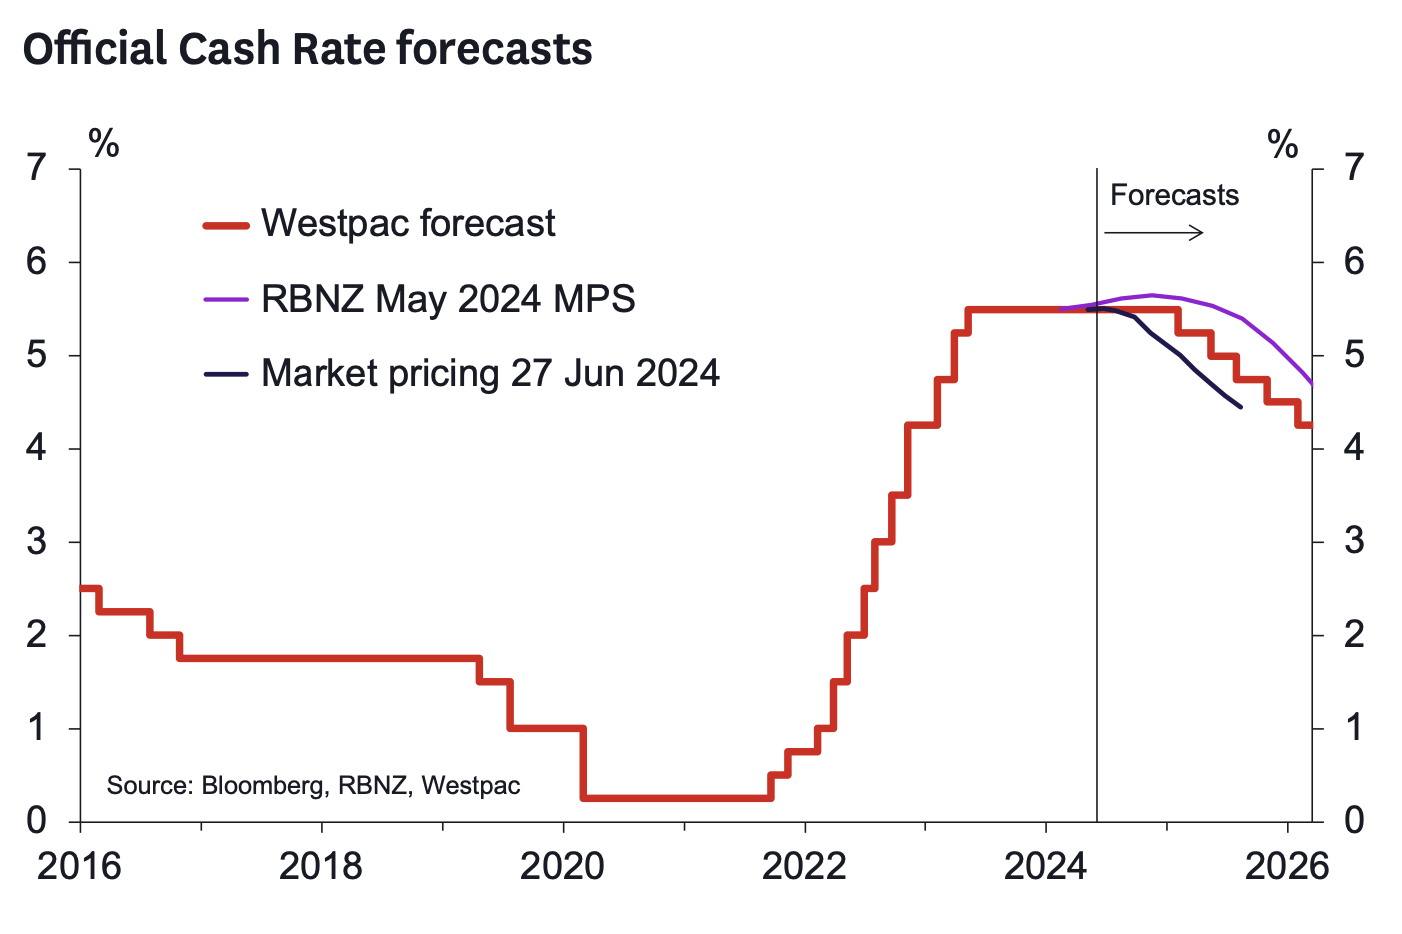
The Reserve Bank of New Zealand (RBNZ) sets the Official Cash Rate (OCR), a crucial tool for managing inflation and stabilising the economy. The OCR influences interest rates across the country’s financial system, impacting borrowing costs, consumer spending, and overall economic activity. The upcoming decision will determine whether the RBNZ adjusts the current rate or maintains it.
Current Economic Context
Since November 2023, the RBNZ has kept the OCR at 5.50%, following aggressive hikes from a record low of 0.25% starting in October 2021. This 16-year high rate reflects efforts to curb persistent inflation, which, although easing, remains above the RBNZ’s target range of 1-3%. The recent drop in annual CPI inflation to 6.7% suggests moderating inflationary pressures, but the RBNZ remains cautious.
Expected Decision
Market consensus anticipates that the RBNZ will hold the OCR steady at 5.50% in its upcoming meeting. This expectation stems from current economic indicators showing that, while inflation is declining, it still presents challenges. Economists believe the RBNZ will maintain a cautious stance, seeking more consistent evidence of declining inflation before considering any rate cuts.
Market Impact
NZD/USD Reaction:
- Hawkish Scenario: If the RBNZ unexpectedly signals a continuation of its tightening bias or raises the OCR, the NZD could strengthen. Investors might see this as a sign of the central bank’s commitment to controlling inflation, leading to increased demand for the NZD due to higher expected returns.
- Dovish Scenario: Conversely, if the RBNZ signals potential rate cuts in the near future, the NZD could weaken. Lower interest rates typically make a currency less attractive to investors seeking higher yields, leading to depreciation.
Inflation and GDP:
- Higher OCR Impact: Maintaining a high OCR supports a restrictive monetary policy, aimed at reducing inflation. This could slow economic activity, as higher borrowing costs dampen consumer spending and investment.
- Lower OCR Impact: Potential future rate cuts could boost economic activity by lowering borrowing costs, encouraging spending and investment. However, this might also delay the complete easing of inflationary pressures.
Overall, the RBNZ’s interest rate decision is a critical factor in shaping the economic outlook for New Zealand. Investors, policymakers, and analysts will closely monitor the central bank’s statements and forward guidance to gauge the future path of monetary policy and its implications for the economy and financial markets.
United Kingdom
UK GDP MoM: July 2024 Outlook
What is GDP MoM?
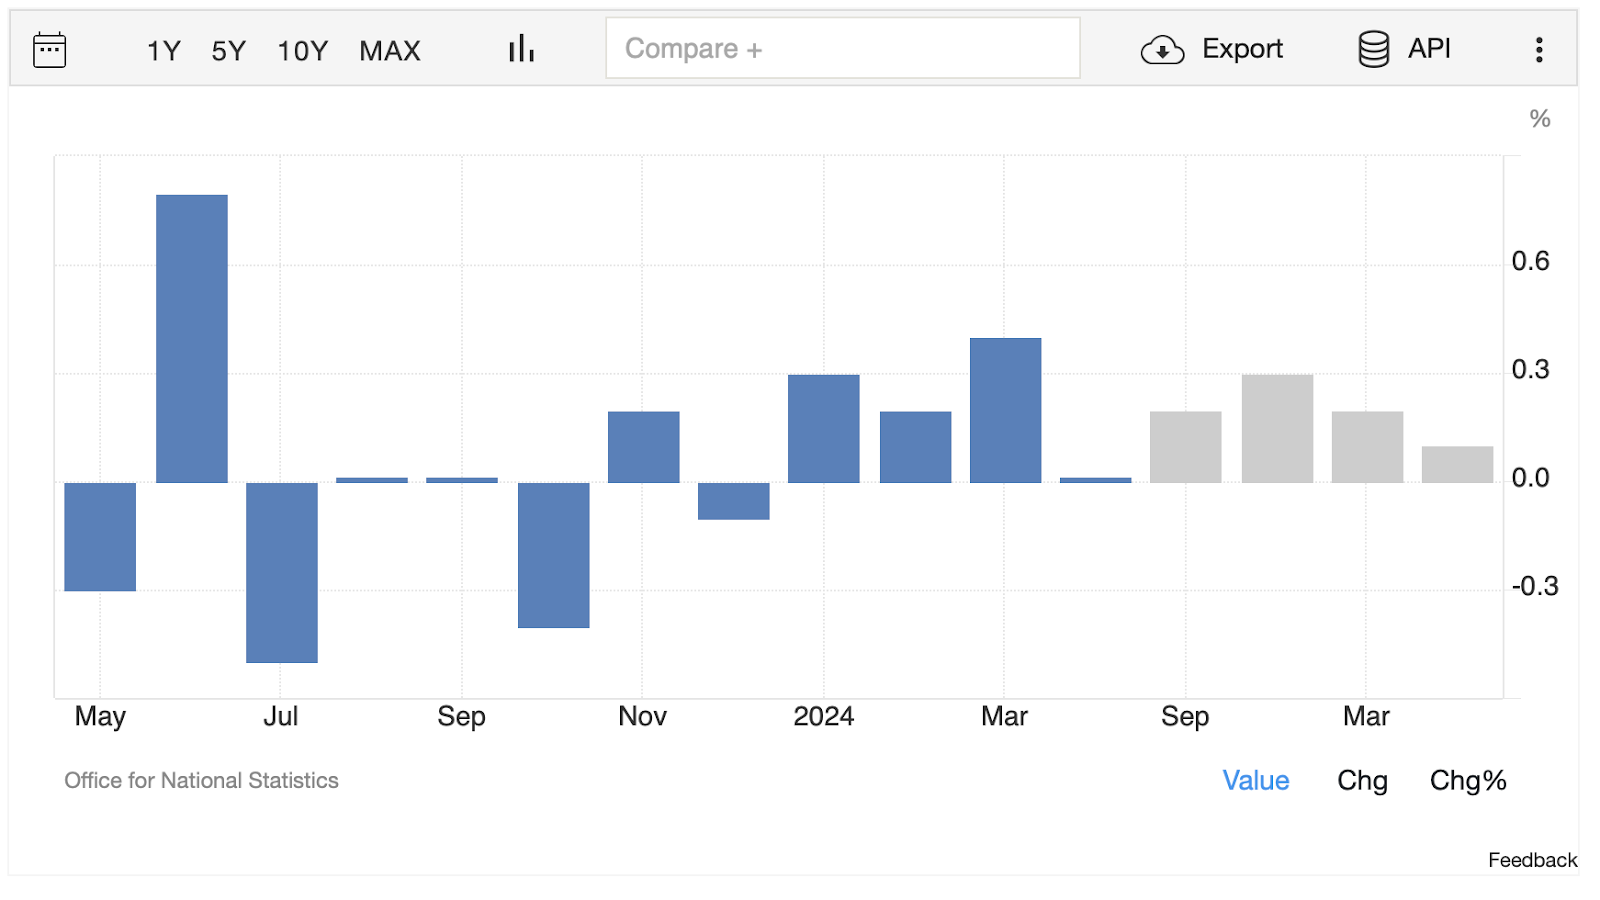
Gross Domestic Product (GDP) Month-on-Month (MoM) measures the economic activity and performance of a country by comparing the GDP of one month to the previous month. It is a crucial indicator of economic health, reflecting changes in production, consumer spending, investment, and government expenditure. The MoM GDP figure provides a more immediate and frequent snapshot of economic performance compared to the quarterly GDP figures.
Indicator Type
The GDP MoM is generally considered a coincident indicator because it reflects the current state of the economy. It moves simultaneously with the overall economic cycle, providing timely information on economic activity. Unlike leading indicators, which predict future trends, or lagging indicators, which confirm past trends, coincident indicators like the GDP MoM offer insights into the current economic environment.
Expected Results
The UK GDP MoM for the upcoming release is anticipated to show a modest increase. According to Trading Economics, the forecast suggests a growth of 0.2% by September 2024. While specific forecasts for the next week’s release are less precise, the expectation of growth is based on recent economic trends and indicators. The previous month’s GDP showed a slight contraction of -0.1%, indicating that any positive growth would be a sign of economic resilience and recovery.
Market Impact
GBP/USD Reaction:
- Positive GDP Growth: If the GDP MoM figure comes in at or above the expected growth of 0.2%, it could bolster the GBP. A stronger GDP figure would suggest that the UK economy is recovering and gaining momentum, which could attract foreign investment and increase demand for the pound. This positive sentiment would likely lead to an appreciation of the GBP/USD pair.
- Negative or Flat GDP Growth: Conversely, if the GDP MoM figure disappoints and shows minimal growth or a contraction, it could weaken the GBP. Investors might view this as a sign of ongoing economic challenges, reducing confidence in the UK’s economic prospects. This could lead to a depreciation of the GBP/USD pair as traders seek safer or more promising currencies.
FTSE 100 Stock Market Reaction:
- Positive GDP Growth: A strong GDP MoM figure would likely have a positive impact on the FTSE 100, the UK’s primary stock market index. Positive economic growth signals improved business conditions and consumer confidence, which can boost corporate earnings and stock prices. Sectors that are closely tied to domestic economic activity, such as retail, banking, and construction, would particularly benefit.
- Negative or Flat GDP Growth: On the other hand, if the GDP MoM figure shows weak growth or contraction, it could weigh on the FTSE 100. Investors might become concerned about the economic outlook and corporate profitability, leading to sell-offs, particularly in sectors sensitive to economic performance. This could increase market volatility and result in lower stock prices.
Overall, the upcoming UK GDP MoM release is a critical data point for assessing the current state of the UK economy. It will provide valuable insights into the economic recovery and its implications for the currency markets and stock market performance. Investors and policymakers will closely monitor this release to gauge the health of the economy and make informed decisions.
United States
U.S. Michigan Sentiment: July 2024 Outlook
What is the Michigan Sentiment Index?
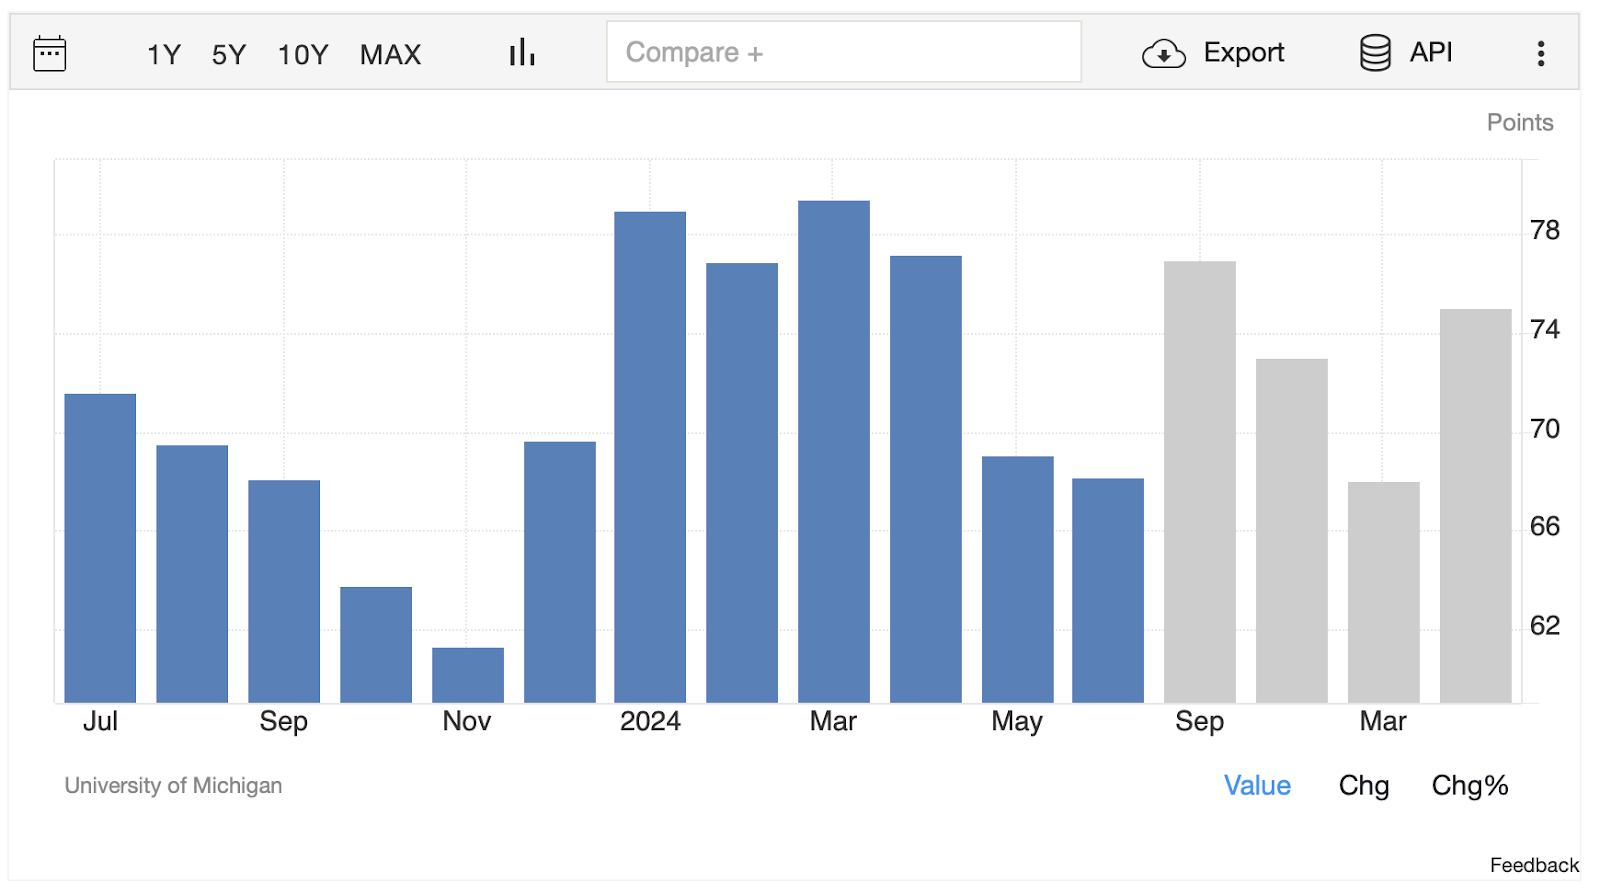
The University of Michigan Consumer Sentiment Index is a leading economic indicator that measures the overall economic confidence of consumers in the United States. It surveys consumers’ attitudes about the economy, personal finances, business conditions, and future expectations. The index is pivotal in predicting consumer spending, which accounts for a significant portion of GDP, and it provides insights into future inflation trends. As a leading indicator, it can signal changes in economic activity and guide policymakers and investors in their decision-making processes.
Expected Rate and Recent Trends
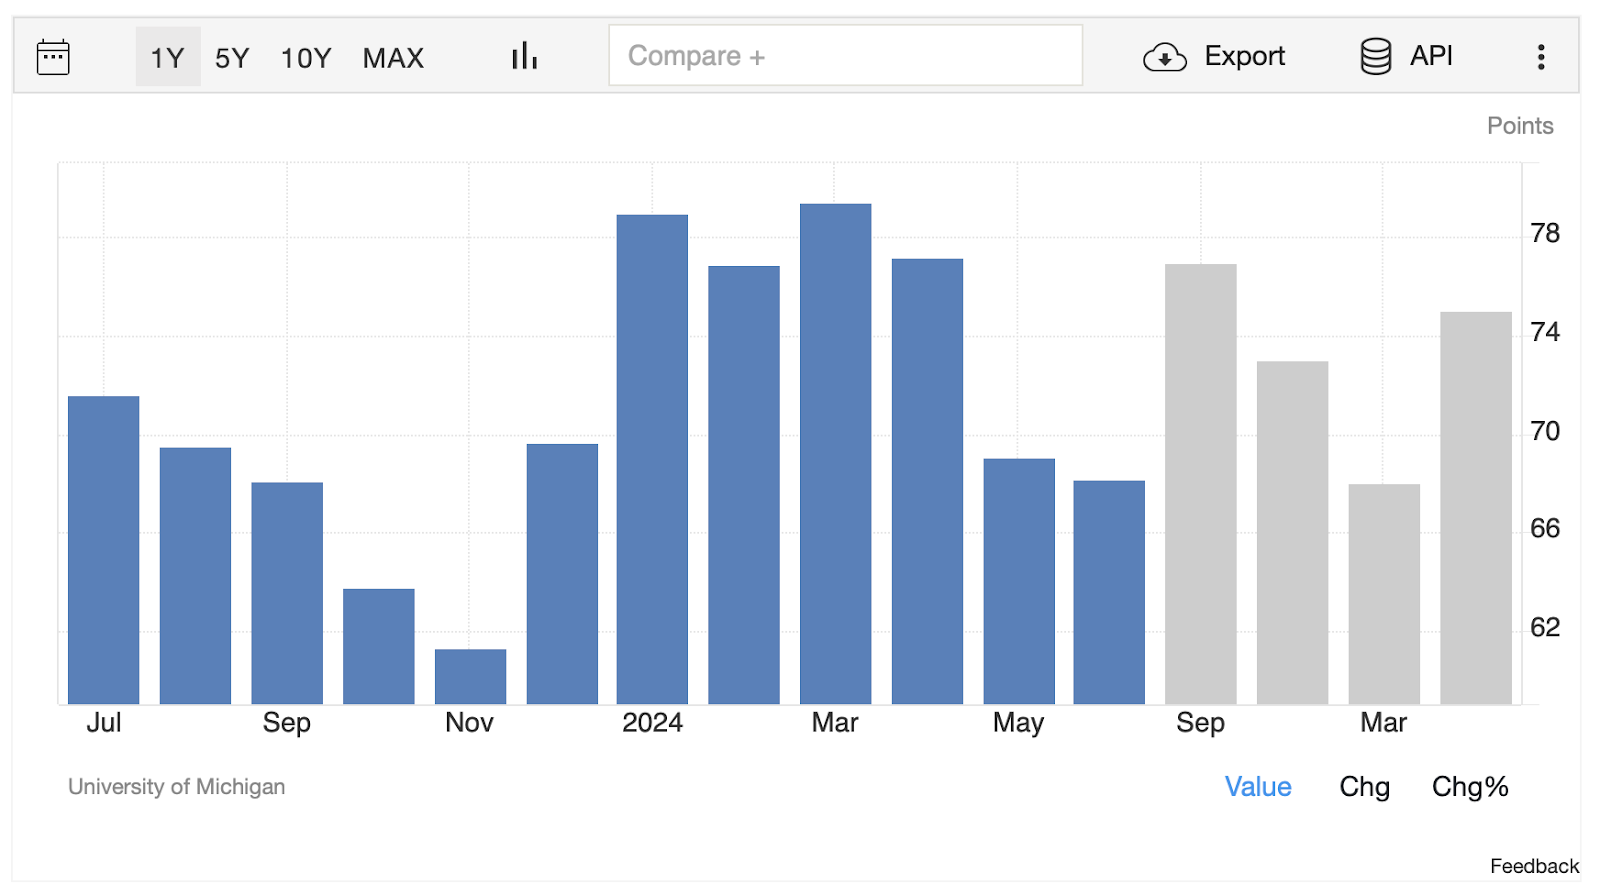
The Michigan Sentiment Index has been on a downtrend throughout 2024, reflecting ongoing economic uncertainties and consumer concerns about inflation and economic stability. The previous reading was 63.0, and the forecast for the upcoming release suggests a slight improvement to 64.5 and 77 by end of this quarter. This anticipated increase indicates a potential shift in consumer confidence, suggesting that consumers might be feeling more optimistic about economic prospects moving forward.
Market Impact
U.S. Michigan Sentiment vs. SPX
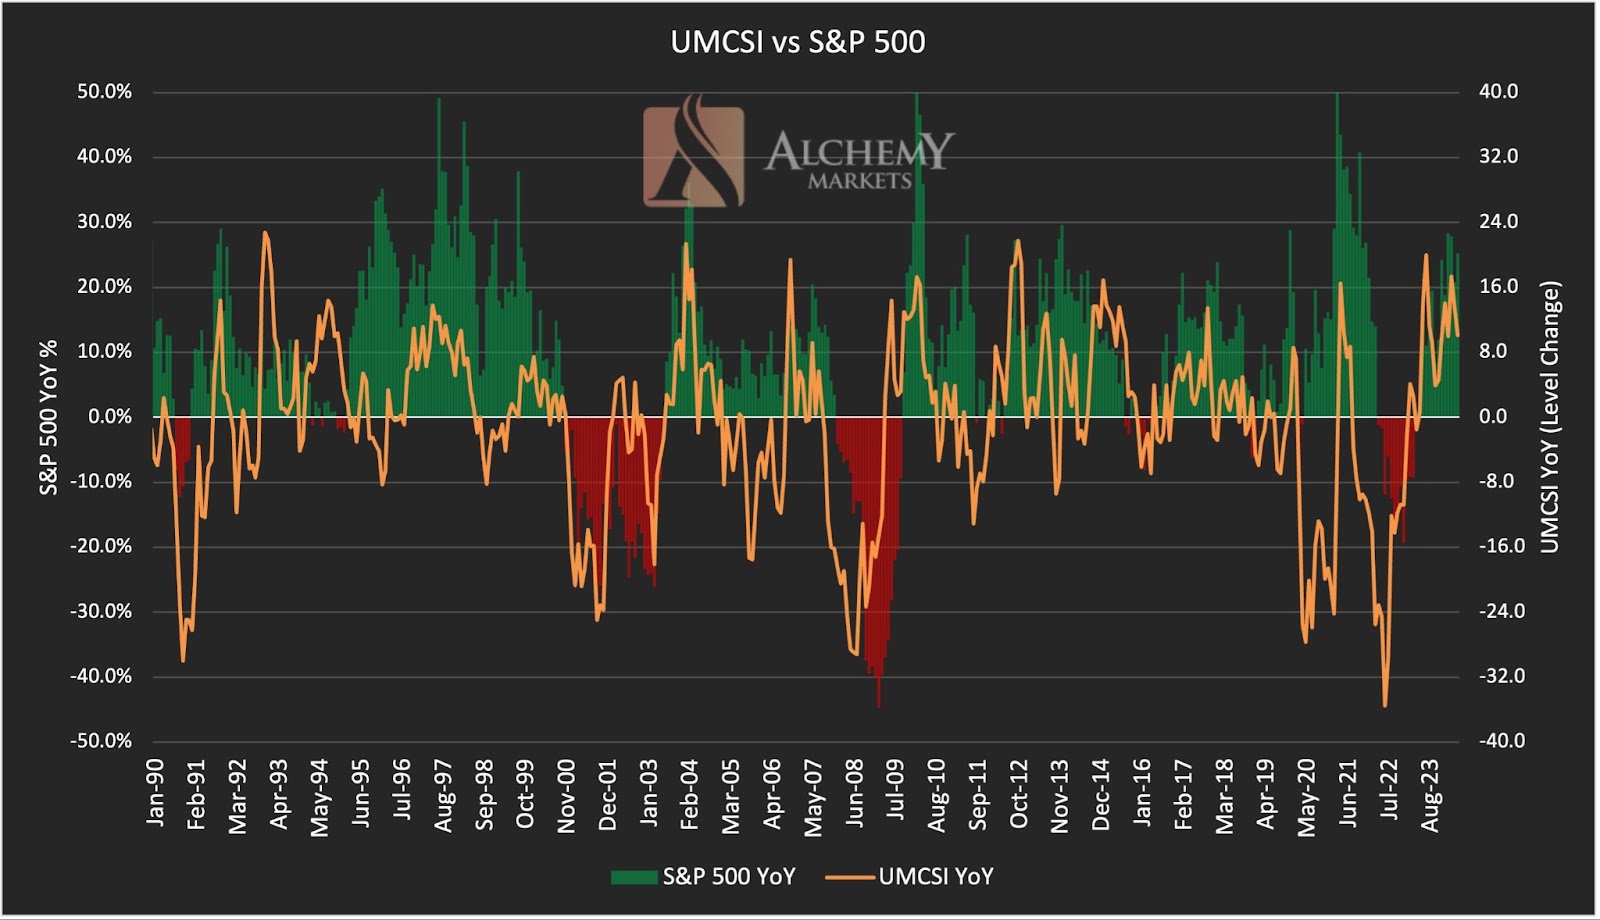
The chart demonstrates a strong correlation between the University of Michigan Consumer Sentiment Index (UMCSI) and the S&P 500 (SPX). Historically, increases in consumer sentiment, indicated by the orange line, tend to coincide with positive performance in the SPX, shown in green. Conversely, declines in sentiment often correlate with negative SPX returns, marked in red. This relationship underscores the importance of consumer confidence as a leading indicator for stock market trends, as higher sentiment typically boosts consumer spending and economic activity, driving up corporate earnings and stock prices.
EUR/USD Reaction
- Positive Sentiment: An increase in the Michigan Sentiment Index could lead to a mixed reaction in the EUR/USD pair. While higher consumer confidence suggests stronger U.S. economic growth, which typically strengthens the USD, it can also promote healthy inflation expectations and potentially more accommodative monetary policy in the longer term. If the market interprets this sentiment improvement as reducing immediate inflation concerns and increasing global risk appetite, the USD might weaken against the EUR, leading to a higher EUR/USD pair.
- Negative Sentiment: A decline in the sentiment index would likely weaken the USD, as it signals potential economic challenges and reduced consumer spending. This could lead to a higher EUR/USD pair, as investors might seek alternative investments in the Eurozone or other currencies perceived as safer or more stable.
U.S. CPI and PPI: July 2024 Outlook
U.S. Consumer Price Index (CPI)
What is CPI?
(CPI vs GDP) CPI in Blue – GDP in Red
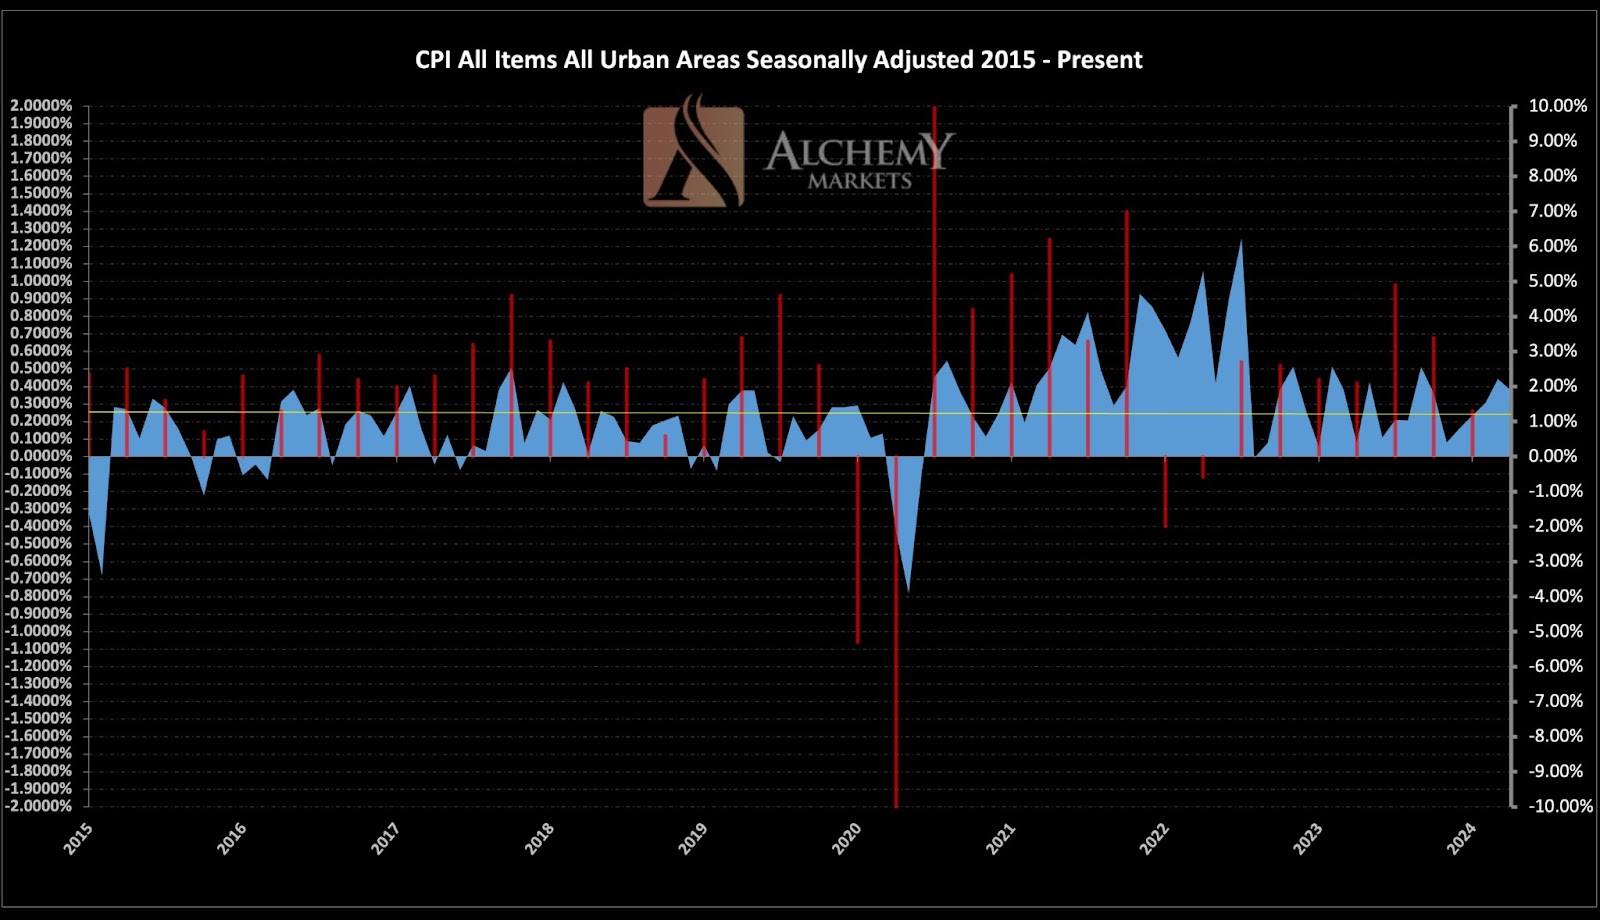
The Consumer Price Index (CPI) measures the average change over time in the prices paid by urban consumers for a market basket of consumer goods and services. It is a critical indicator for assessing inflationary trends and is closely watched by policymakers, investors, and economists.
Expected Results
For July 2024, the forecast for the CPI is an annual increase of 3.3%. The previous month’s CPI was at 3.2%, indicating a modest but steady rise in consumer prices. This slight increase suggests that while inflation remains a concern, it is gradually stabilising.
Market Impact
- Currency (USD): If the CPI meets or exceeds the forecast, it could bolster the USD as higher inflation might prompt the Federal Reserve to maintain or even increase interest rates. This would make USD-denominated assets more attractive to investors.
- Stock Market (SPX): A higher-than-expected CPI might lead to concerns about tighter monetary policy, potentially weighing on the stock market. Conversely, if the CPI comes in lower than expected, it could ease fears of aggressive rate hikes, potentially supporting equity markets.
U.S. Producer Price Index (PPI)
What is PPI?
The Producer Price Index (PPI) measures the average change over time in the selling prices received by domestic producers for their output. It is a leading indicator of consumer price inflation and overall economic health, as changes in producer prices often lead to subsequent changes in consumer prices.
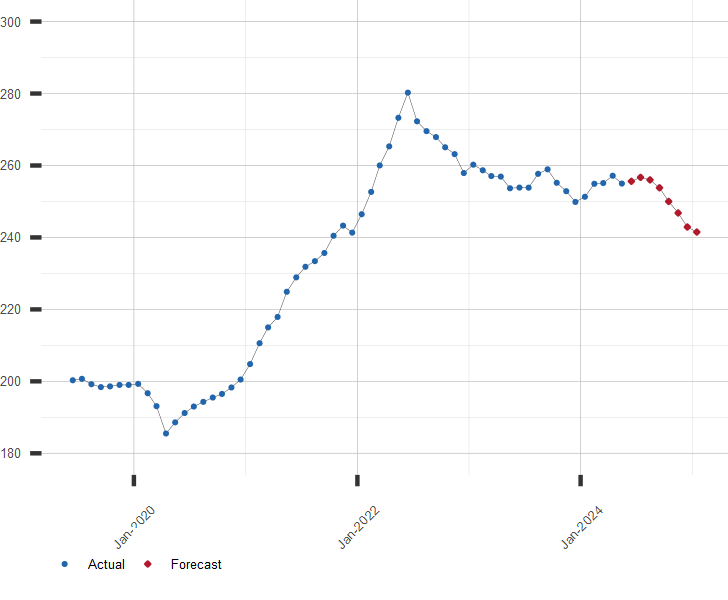
Expected Results
For July 2024, the forecast for the PPI indicates a continued decrease, aligning with the attached chart which shows a downward trend in producer prices. The previous month recorded a PPI of 2.2%, and the forecast for July is an annual increase of 2.5%. This slight acceleration in producer prices indicates rising costs at the production level.
Market Impact
- Currency (USD): A higher PPI could strengthen the USD, as it signals rising costs at the production level, which may translate into higher consumer prices and potential for higher interest rates.
- Stock Market (SPX): If the PPI is higher than expected, it might raise concerns about increasing production costs and their impact on corporate profit margins, potentially leading to a bearish sentiment in the stock market. Conversely, a lower-than-expected PPI could suggest easing inflationary pressures, which might be supportive of equity prices.
Overall, the upcoming releases of the U.S. CPI and PPI will provide crucial insights into the inflationary landscape and economic outlook. Investors and policymakers will closely monitor these indicators to gauge the future path of monetary policy and its implications for the financial markets.
Technical Analysis:
NZD/USD
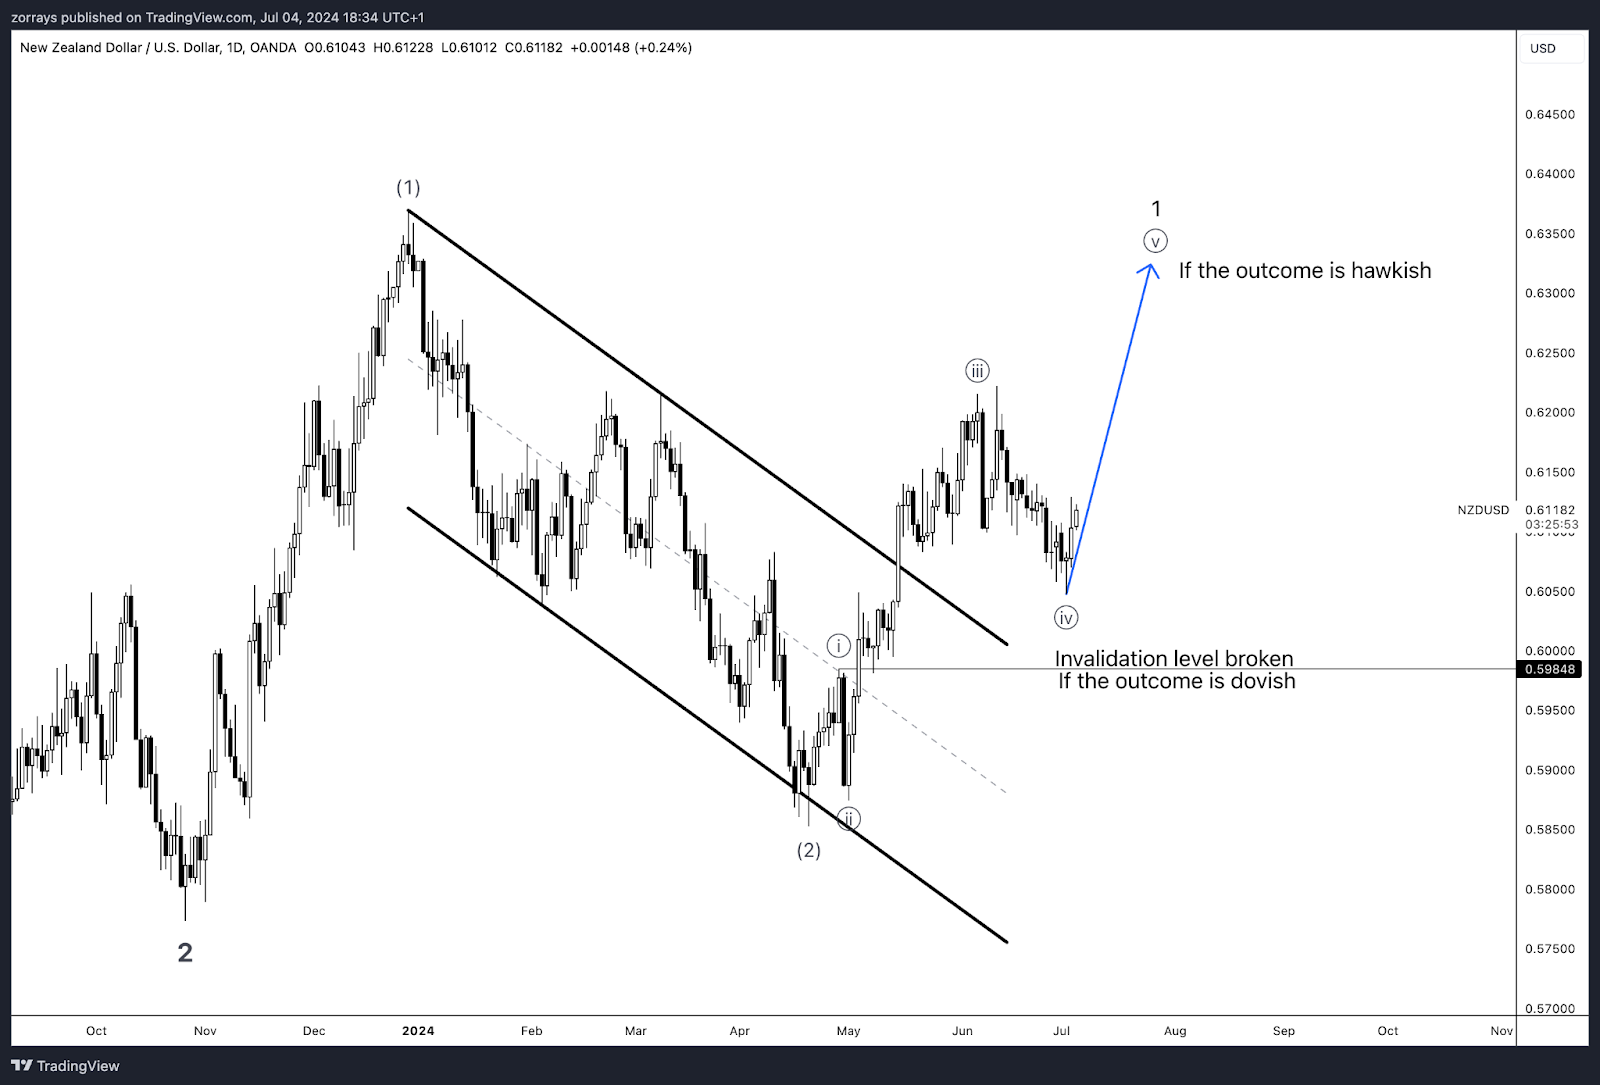
The chart for NZD/USD indicates that New Zealand’s cautious stance on inflation will likely lead the Reserve Bank of New Zealand (RBNZ) to hold its current interest rate. This conservative approach to monetary policy reflects the RBNZ’s efforts to balance inflation control without hampering economic growth. The decision to maintain the interest rate could lead to a positive impact on the NZD due to the interest rate differential.
Technically, we observe that NZD/USD is poised to complete wave ((v)) of 1 to the upside. The chart shows a clear Elliott Wave pattern, with the pair currently in wave ((iv)). If the RBNZ’s decision aligns with market expectations and remains hawkish, we can anticipate an upward movement, completing wave ((v)). The invalidation level for this bullish scenario is at 0.598. Should the price drop below this level, it would invalidate the current wave count, indicating a potential shift in market sentiment.
Overall, the technical and fundamental outlook suggests a favourable environment for NZD/USD to appreciate, provided that the RBNZ maintains its current monetary policy stance. Investors should closely watch the upcoming RBNZ announcement and monitor the 0.598 level as a critical point for confirming the wave structure.


