


Written by:


- Weekly Outlook
- June 7, 2024
- 6 min read
Fed’s Rate Call and UK GDP in Focus
The past week saw significant market movements as investors reacted to mixed economic data and geopolitical developments as we witnessed the anticipated rate cuts from BOC and ECB. As we look ahead, key economic events in Japan, the United Kingdom, and the United States are set to shape the financial markets. This week, we focus on Japan’s GDP release and BOJ interest rate decision, the UK’s GDP data, and the US’s CPI release, Fed interest rate decision, and PPI data. These events will provide critical insights into the economic health of these major economies and influence currency and equity market trends.
United States
Inflation
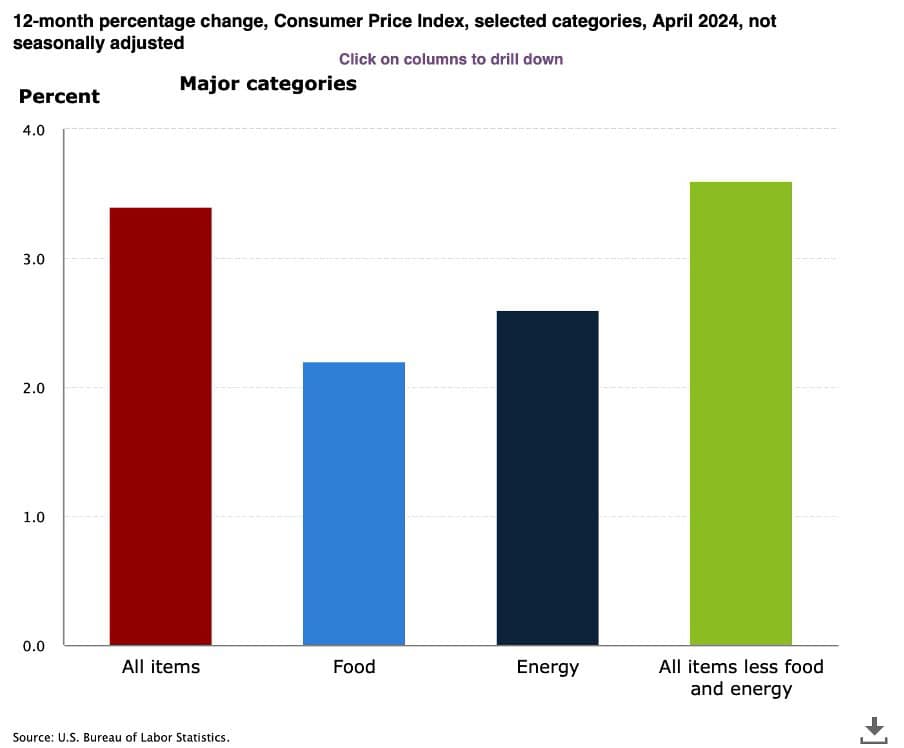
Source: U.S Bureau of Labor Statistics
In the United States, several critical economic indicators are due this week. The CPI data for May 2024 is scheduled for release on June 12, 2024. Inflation remains a key concern, with the previous month’s CPI showing a 3.4% year-over-year increase). The forecast for May is similarly pegged at 3.4%, indicating stable inflation trends. Higher-than-expected CPI data could strengthen the USD as it may prompt the Federal Reserve to consider rate hikes sooner. Conversely, lower CPI data might weaken the USD but support equity markets by reducing the likelihood of immediate monetary tightening.
Fed’s Interest Rate Decision
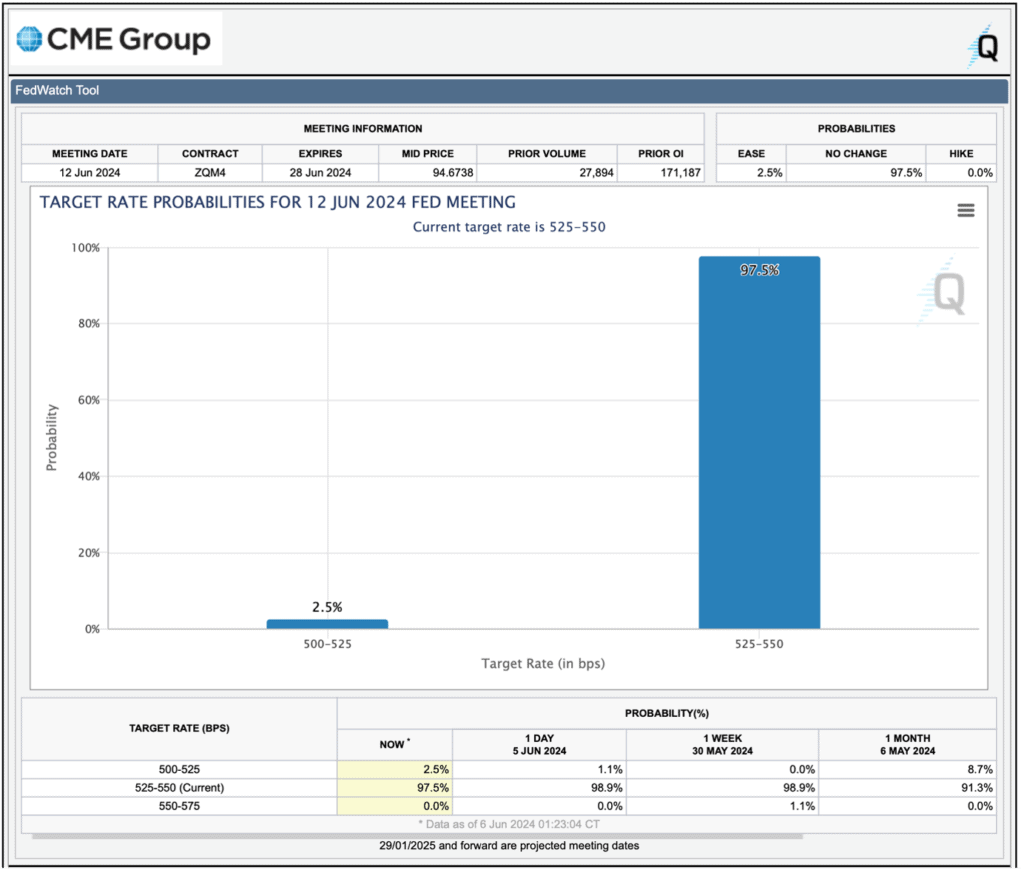
Source: CME Group
The Federal Reserve’s interest rate decision will follow closely on June 14, 2024. The Fed has been balancing inflation control with supporting economic growth and is expected to maintain its current interest rate stance at 5.50%, as per demonstrated on the above chart. However, the Fed’s guidance on future policy moves will be crucial. Any hint of future rate hikes could boost the USD and potentially weigh on the S&P 500, while a dovish outlook might weaken the USD but support equities.
United Kingdom
GDP
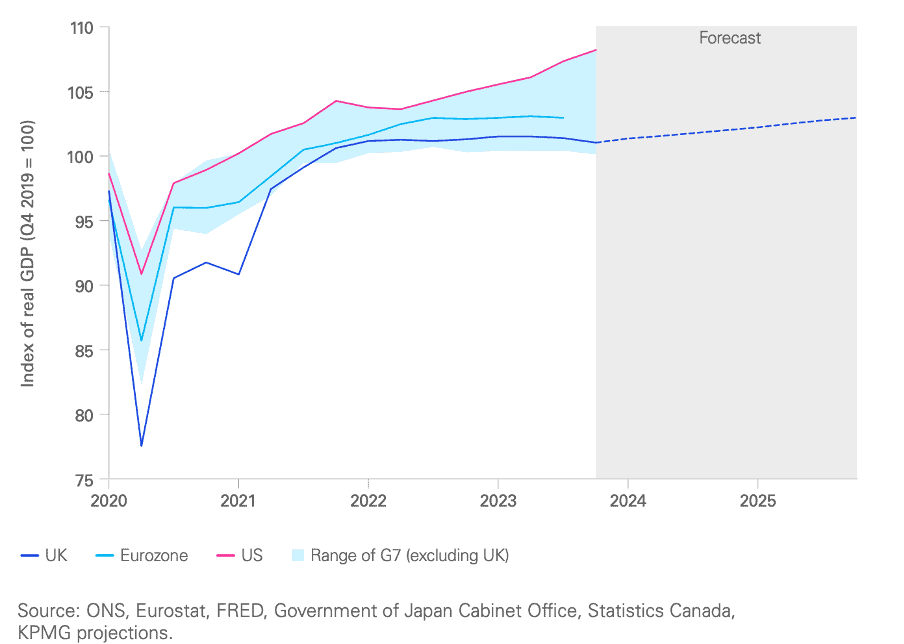
Source: KPMG
The UK’s GDP release for Q2 2024 is highly anticipated, following a 0.6% growth in Q1 2024 driven by a robust services sector. For the second quarter, the market expects growth between 0.4% and 0.5%, reflecting ongoing economic recovery which may span into the next couple of years as per forecasted above. Strong GDP data would likely strengthen the GBP as it signals economic resilience, potentially boosting the FTSE 100 as investor confidence grows. Conversely, weaker-than-expected GDP figures could dampen market sentiment, leading to a softer GBP and potential declines in equities, particularly in sectors sensitive to domestic economic conditions.
Japan
GDP
Japan’s GDP figures for Q2 2024 will be released this week, following a contraction of -0.5% in Q1 2024. This decline was driven by weak consumer spending and sluggish capital expenditure, highlighting persistent economic challenges. For the upcoming release, the market is cautiously forecasting a stagnated number of -0.5%. A better-than-expected GDP figure could strengthen the yen, as investors may perceive improved economic prospects, potentially leading to increased investment flows into Japan. Conversely, if the data disappoints, the yen could weaken, exerting downward pressure on Japanese equities.
BOJ Interest Rate Decision
Simultaneously, the Bank of Japan (BOJ) will announce its interest rate decision. Historically, the BOJ has maintained an ultra-loose monetary policy with a negative interest rate of -0.1% to combat deflation and stimulate growth. However, in a historic shift, the BOJ recently increased the interest rate to 0.1%, marking the first rate hike in 17 years. This move aims to signal a transition towards normalising monetary policy amidst improving economic conditions. If the BOJ signals a future tightening of monetary policy, the yen could see a boost, and market sentiment towards Japanese stocks may improve. However, if the BOJ continues its dovish stance without indicating future rate hikes, the yen might weaken, although equities could benefit from sustained low borrowing costs.
Technical Analysis
Technical Breakdown: Top Charts of the Week
USD/JPY: Breakout Analysis

Source: TradingView
During May 2024, after a significant downward surge, the market started correcting to the upside, forming an ascending channel. This upward correction can be seen as a consolidation phase following the previous sharp decline.
However, on June 4, 2024, this ascending channel was broken to the downside, indicating a potential reversal of the corrective phase and suggesting further bearish momentum. The breakout below the channel highlights increased selling pressure, which may lead to a continued downside move.
As long as the price remains beneath the invalidation level of 157.463, the bearish outlook remains intact. This level acts as a crucial resistance, and only a move back above it would necessitate re-evaluating the bearish bias. If the price climbs back above this invalidation level, it could invalidate the current bearish setup, prompting traders to reconsider their strategies on USD/JPY.
In summary, the breakout of the ascending channel on June 4, 2024, signals potential for further declines in USD/JPY. Traders should watch the 157.463 level closely, as it will determine the validity of this bearish setup. If the price stays below this level, the bearish trend is likely to continue; otherwise, a breach above could indicate a need for a new analysis.
NZD/USD: Resistance Zone Analysis
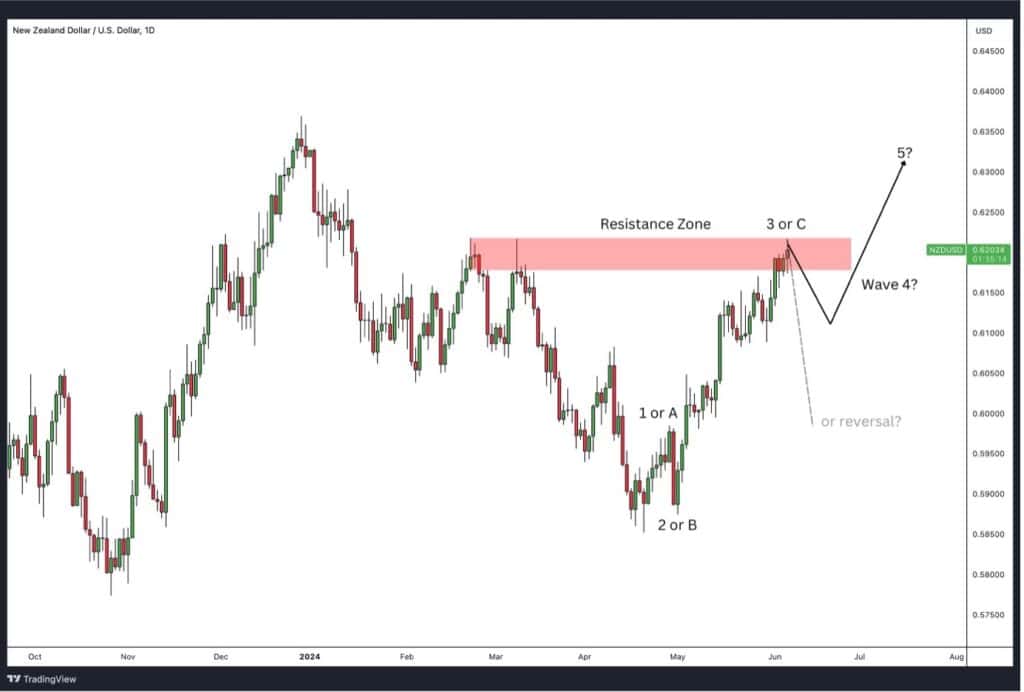
Source: TradingView
Since April 2024, the NZD/USD has been climbing steadily, gaining a total of 363 pips. This bullish movement has been robust, but the pair has now approached a significant resistance zone. This barrier is crucial as it will determine whether the price will reverse or, at best, stall.
The price reaching this resistance zone poses two potential scenarios. The first is a complete reversal, which would mean the current upward movement remains a three-wave sequence in Elliott Wave terms, leading to a downside reversal. The second scenario is a stalling of the current uptrend, which could unfold into a wave 4 corrective sequence, potentially breaking through the resistance zone after a consolidation phase.
In summary, traders should monitor this resistance zone closely. If the price fails to break above and reverses, it will validate the three-wave Elliott sequence, suggesting further downside. However, if the price consolidates and forms a wave 4 pattern, a breakout through the resistance zone may follow, indicating continued bullish momentum.
Apple Inc.: Resistance Zone and Elliott Wave Analysis
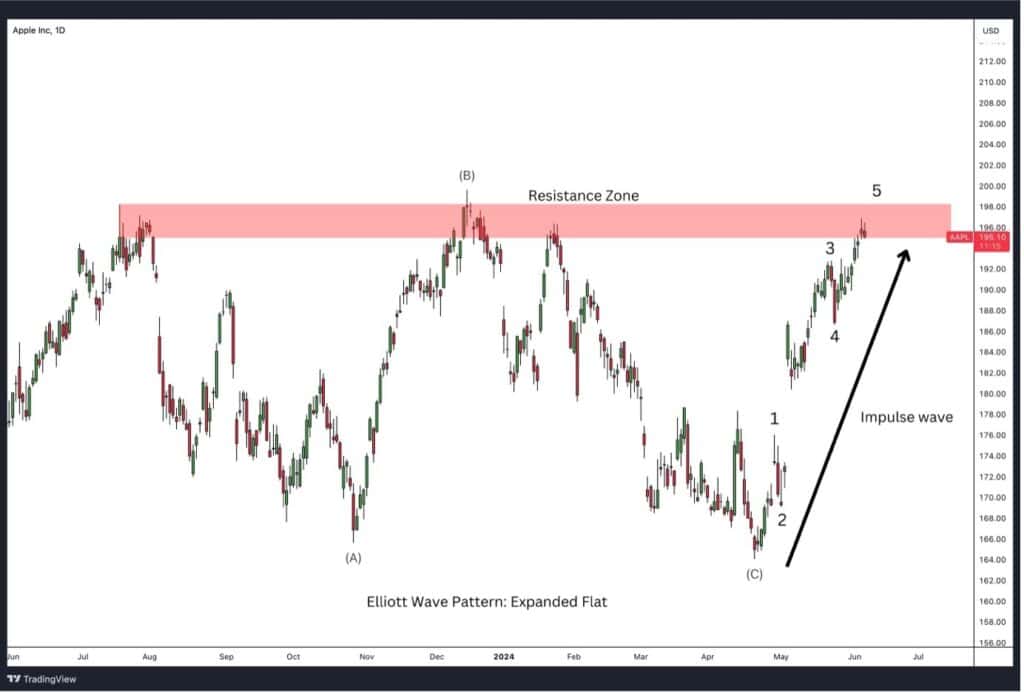
Source: TradingView
Since July 2023, Apple Inc.’s stock price has been ranging between approximately 15% to 17%, forming an Elliott Wave corrective pattern known as an expanded flat. This pattern typically indicates a continuation of the prevailing trend once it is completed. Following the completion of this expanded flat pattern, we have witnessed a strong impulsive move from the lows of April 2024.
Currently, Apple is approaching a significant resistance zone. Given the impulsive nature of the recent upward move, it is likely that this trend will continue, potentially breaking through the resistance zone soon. If the Elliott Wave count is correct, this would signal the resumption of the primary trend and further upward movement in Apple’s stock price.
In summary, Apple has been in a corrective phase but has shown a strong bullish impulse since April 2024. The stock is now facing a critical resistance zone, and a breakthrough would confirm the continuation of the upward trend. Traders should watch this resistance closely as it will provide crucial insights into the stock’s next move.


