Written by:

- Weekly Outlook
- January 9, 2026
- 6 min read
A K-Shaped Economy, Sticky Inflation, and a Bullish EUR/USD Triangle
The Story of a K-Shaped Economy
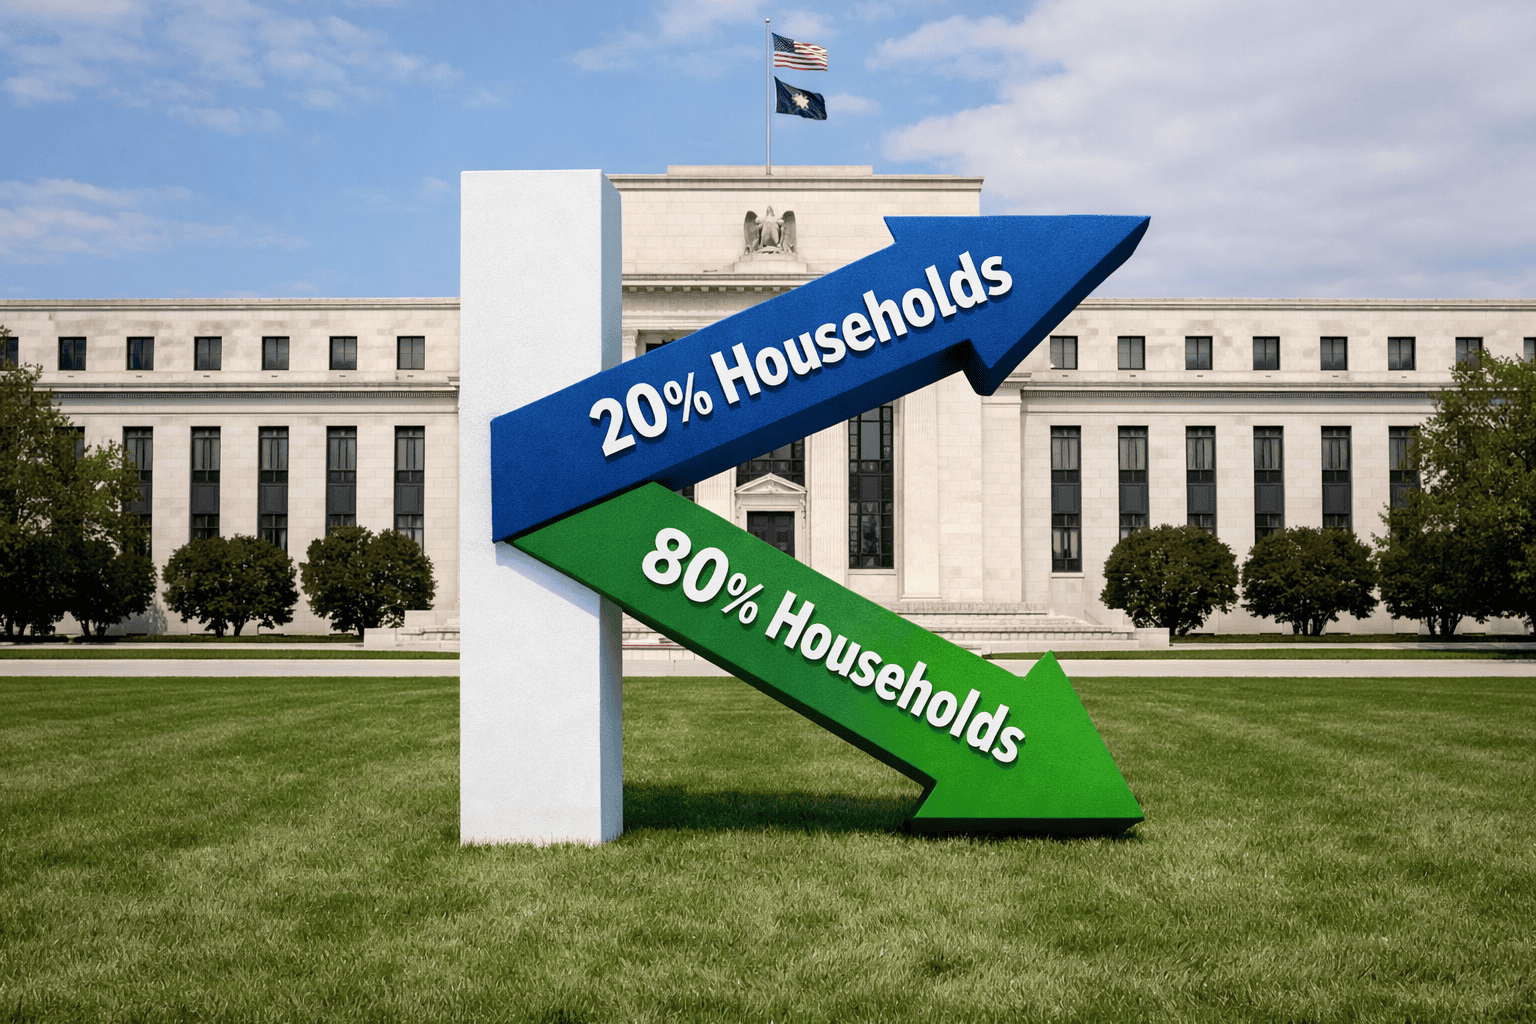
The U.S. economy has entered what economists call a K-shaped recovery — a term used when economic growth diverges sharply between different income groups and sectors.
On one hand, the top 20% of households, who control roughly 70% of the nation’s wealth, continue to spend freely. Equity markets at record highs have boosted their confidence, fueling consumption and investment in high-growth areas like AI, technology, and software.
On the other hand, the bottom 80% — particularly middle- and lower-income households — are feeling the pinch. Confidence levels remain subdued, and many expect unemployment to rise. The labour market is showing early cracks, as job openings narrow and wage pressures ease.
This bifurcation explains how the U.S. can report strong GDP growth alongside softening employment. U.S. growth would have been negative last year if not for investment in software and IT equipment, which alone added 0.8 percentage points to GDP in Q3.
In short: growth is real but concentrated, and that imbalance is likely to persist through 2026. However, this also makes the U.S. economy more vulnerable to a potential tech bubble—a risk markets will continue to price in.
Today’s NFP: A Snapshot of the Labor Market
Today’s Non-Farm Payroll (NFP) report once again highlighted the dual nature of the economy. Job creation slowed compared to previous months, while wage growth remained modest. This supports the narrative that the Fed’s tightening cycle is cooling the labour market but not collapsing it.
Markets reacted cautiously, with Treasury yields pulling back slightly and the dollar softening as traders reinforced expectations of Fed rate cuts later in 2026.
However, the data wasn’t weak enough to justify immediate easing. Instead, it strengthened the case for a “soft landing”— an outcome where inflation continues to fall without a major rise in unemployment.
Forward-looking indicators, such as the ISM Services Employment Index and average weekly hours, suggest labor demand is slowing but stable. That means the Fed can remain patient, monitoring inflation before committing to any major pivot.
The Fed’s Dilemma: Sticky Services, Fading Goods Inflation
Fed Chair Jerome Powell has made it clear: tariffs and goods prices are no longer the main inflation drivers. Indeed, price pressures in tariff-sensitive categories — like appliances and electronics — have cooled.
But the effective tariff rate remains higher than last summer, suggesting a modest inflationary pass-through could still occur. The real story lies in services inflation, driven by rents and wages, which are gradually easing.
Still, data distortions from last year’s government shutdown mean next week’s inflation release could surprise on the upside. A “hot” CPI print would not derail the bigger picture but could prompt markets to push back their rate cut expectations slightly.
The key takeaway: inflation’s path to 2% will be bumpy but achievable, with the Fed likely to start cutting rates around mid-2026.
Looking Ahead: Next Week’s Economic Calendar
United States: December CPI (Tuesday)
All eyes will be on the December CPI report — arguably the most important macro release of the week. November’s data was heavily skewed by collection issues during the government shutdown, which amplified holiday-related discounts and produced an artificially low inflation reading.
Consensus expects core CPI to rise 0.3% MoM, but forecast is slightly higher at 0.4%, lifting the annual rate to 2.8%.
Even if inflation ticks higher, it’s unlikely to alter the market’s view that two 25bp rate cuts are coming later this year. Powell has already suggested tariff-related inflation will peak in Q1 before subsiding as energy prices and rents fall further.
Market Implication: A slightly hotter CPI print could trigger short-term dollar strength, but broader disinflation trends support the case for gradual Fed easing.
United Kingdom: November GDP (Thursday)
The UK’s economy continues to show a pattern of first-half resilience and second-half weakness — a trend that’s persisted since 2022. November GDP is expected to rebound modestly after October’s contraction, but the bigger picture remains one of stagnation rather than recovery.
Uncertainty around fiscal policy and lackluster consumer spending continue to weigh on growth, although seasonal adjustment quirks may be exaggerating the downturn.
Market Implication: GBP/USD could remain range-bound as traders await clearer signals on Bank of England rate cuts, likely to follow the Fed’s lead later in 2026.
EUR/USD Technical Outlook: Elliott Wave Triangle Near Completion
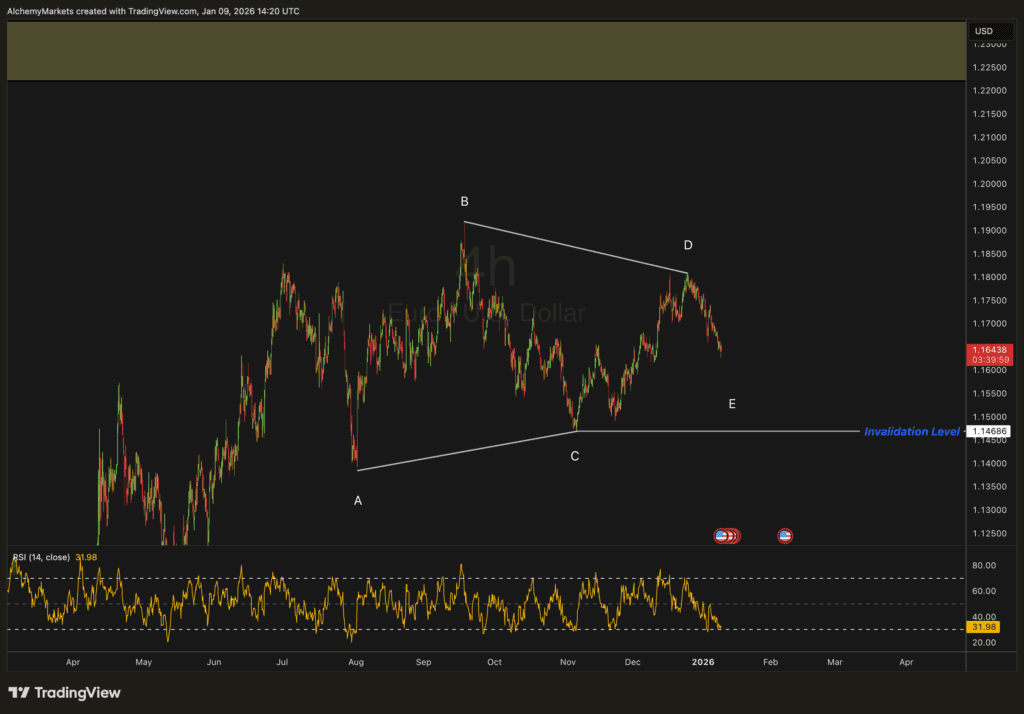
Now, turning to the EUR/USD technical picture, the 4-hour chart (see attached) beautifully illustrates a contracting Elliott Wave triangle labeled A-B-C-D-E.
Price action has respected the structure’s boundaries, with wave D recently topping near 1.19 and the pair now moving lower toward wave E support around 1.1460, which also coincides with the invalidation level.
From an Elliott Wave perspective, triangles typically form in wave 4 positions and are followed by a sharp directional breakout — often in the direction of the prior trend. Given that the preceding move was bullish, the expectation is for an upside breakout once wave E completes.
The RSI near 31 further supports the idea that EUR/USD is approaching oversold territory, increasing the probability of a bullish reversal in the coming sessions.
Quarterly Forecast Implication: This aligns perfectly with our FX quarterly outlook, which anticipates a EUR/USD rally toward 1.20–1.22 in Q1 2026 as U.S. rate cut expectations gain traction and the dollar softens.
Final Thoughts
The global economy is clearly divided — a K-shaped landscape where prosperity and pain coexist. While the U.S. remains the engine of growth, that engine is running on selective cylinders, heavily reliant on tech and wealthier consumers.
Next week’s CPI and UK GDP data will offer important clues about how sustainable this divergence is — and whether inflation’s path back to 2% can continue without a policy misstep.
Technically, EUR/USD is setting up for a major bullish move, with the Elliott Wave triangle nearing completion. If the E-leg holds above 1.1460, traders may soon witness a breakout that confirms the start of the next leg higher.
FAQs
1. What does a K-shaped economy mean?
It describes an uneven recovery where wealthier households and certain sectors (like tech) thrive while others struggle.
2. How did today’s NFP impact market expectations?
The softer jobs print reinforced expectations for Fed rate cuts later in 2026 but didn’t signal an immediate easing cycle.
3. Why is next week’s CPI report so important?
It will clarify whether the recent inflation slowdown was genuine or distorted by data collection issues during the government shutdown.
4. Will a hot CPI derail the Fed’s plans?
Unlikely. The Fed views any near-term inflation bumps as temporary, especially with wages and rents cooling.
5. What’s the outlook for the UK economy?
Growth remains weak but stable, with a mild rebound expected in November GDP after October’s decline.
6. Is EUR/USD heading higher?
Yes, the Elliott Wave triangle suggests an upside breakout is likely once wave E completes, potentially targeting 1.20–1.22.