Written by:


- Quarterly Forecast
- October 2, 2026
- 13 min read
Q4 2026 Forex Forecast: Yen Bites Back as Dollar Stalls
Towards the end of Q3, the US Dollar has been rallying throughout the entirety of September.
But, this behaviour is somewhat befuddling.
The rally occurred on the backdrop of Scott Bessent’s tripled bond buybacks, BOJ Forex intervention, and weakening oil prices.
All of which are factors which should theoretically contribute to the US Dollar’s weakening.
So this begs the question… Why? And what’s next in Q4?
At first glance, this seems like the US bonds market revolting, with yields spending Q3 ripping higher. The 10-year is above 5%, and the 30-year is back around levels last seen more than two decades ago.
On the yen side, USDJPY has already lost the weekly behaviour that carried it higher while JXY sits at support. The US is also no longer the only market with yields pushing higher.
Meanwhile, the DXY is currently at resistance, with JXY, EURUSD, GBPUSD, NZDUSD and AUDUSD all sitting at support.
With everything lining up together, our Q4 bias is recovery for non-US currencies, unless a sustained breakout occurs on the DXY due to rising yields.
First: How I Am Using the EMA Bands
In this piece, I’m using the Bollinger bands® as a gauge for trend health, which I refer to as an “EMA band”. Reaching the edge of one does not automatically make the price expensive or cheap.
Whenever the price of an asset breaks an EMA band, our bias is set to the side of the breakout. All returns to the EMA band are treated as retests, until a reversal break happens.
Our primary EMA band used is the 20 EMA band, set to 1 standard deviation, as it usually represents the smoothest, recent trend conditions.
However, sometimes priority is given to:
- 20 EMA, 1 standard deviation (Primary read)
- 50 EMA, 1 standard deviation
- 100 EMA, 0.5 standard deviation
- Or the 200, 0.25 standard deviation.
Depending on which band is providing the smoothest trending conditions, relative to recency.
So effectively: Macrofundamentals determine the longer term bias, while the bands provide assistance on the timing of reversals or trend continuation.
DXY Reaches the Q4 Decision Zone
The daily chart is why a rollover is worth watching in the first place.
DXY has rallied back into 100.82 to 101.92 resistance. Momentum on the Stoch RSI is stretched, which posits the greenback for a reversal or retracement.
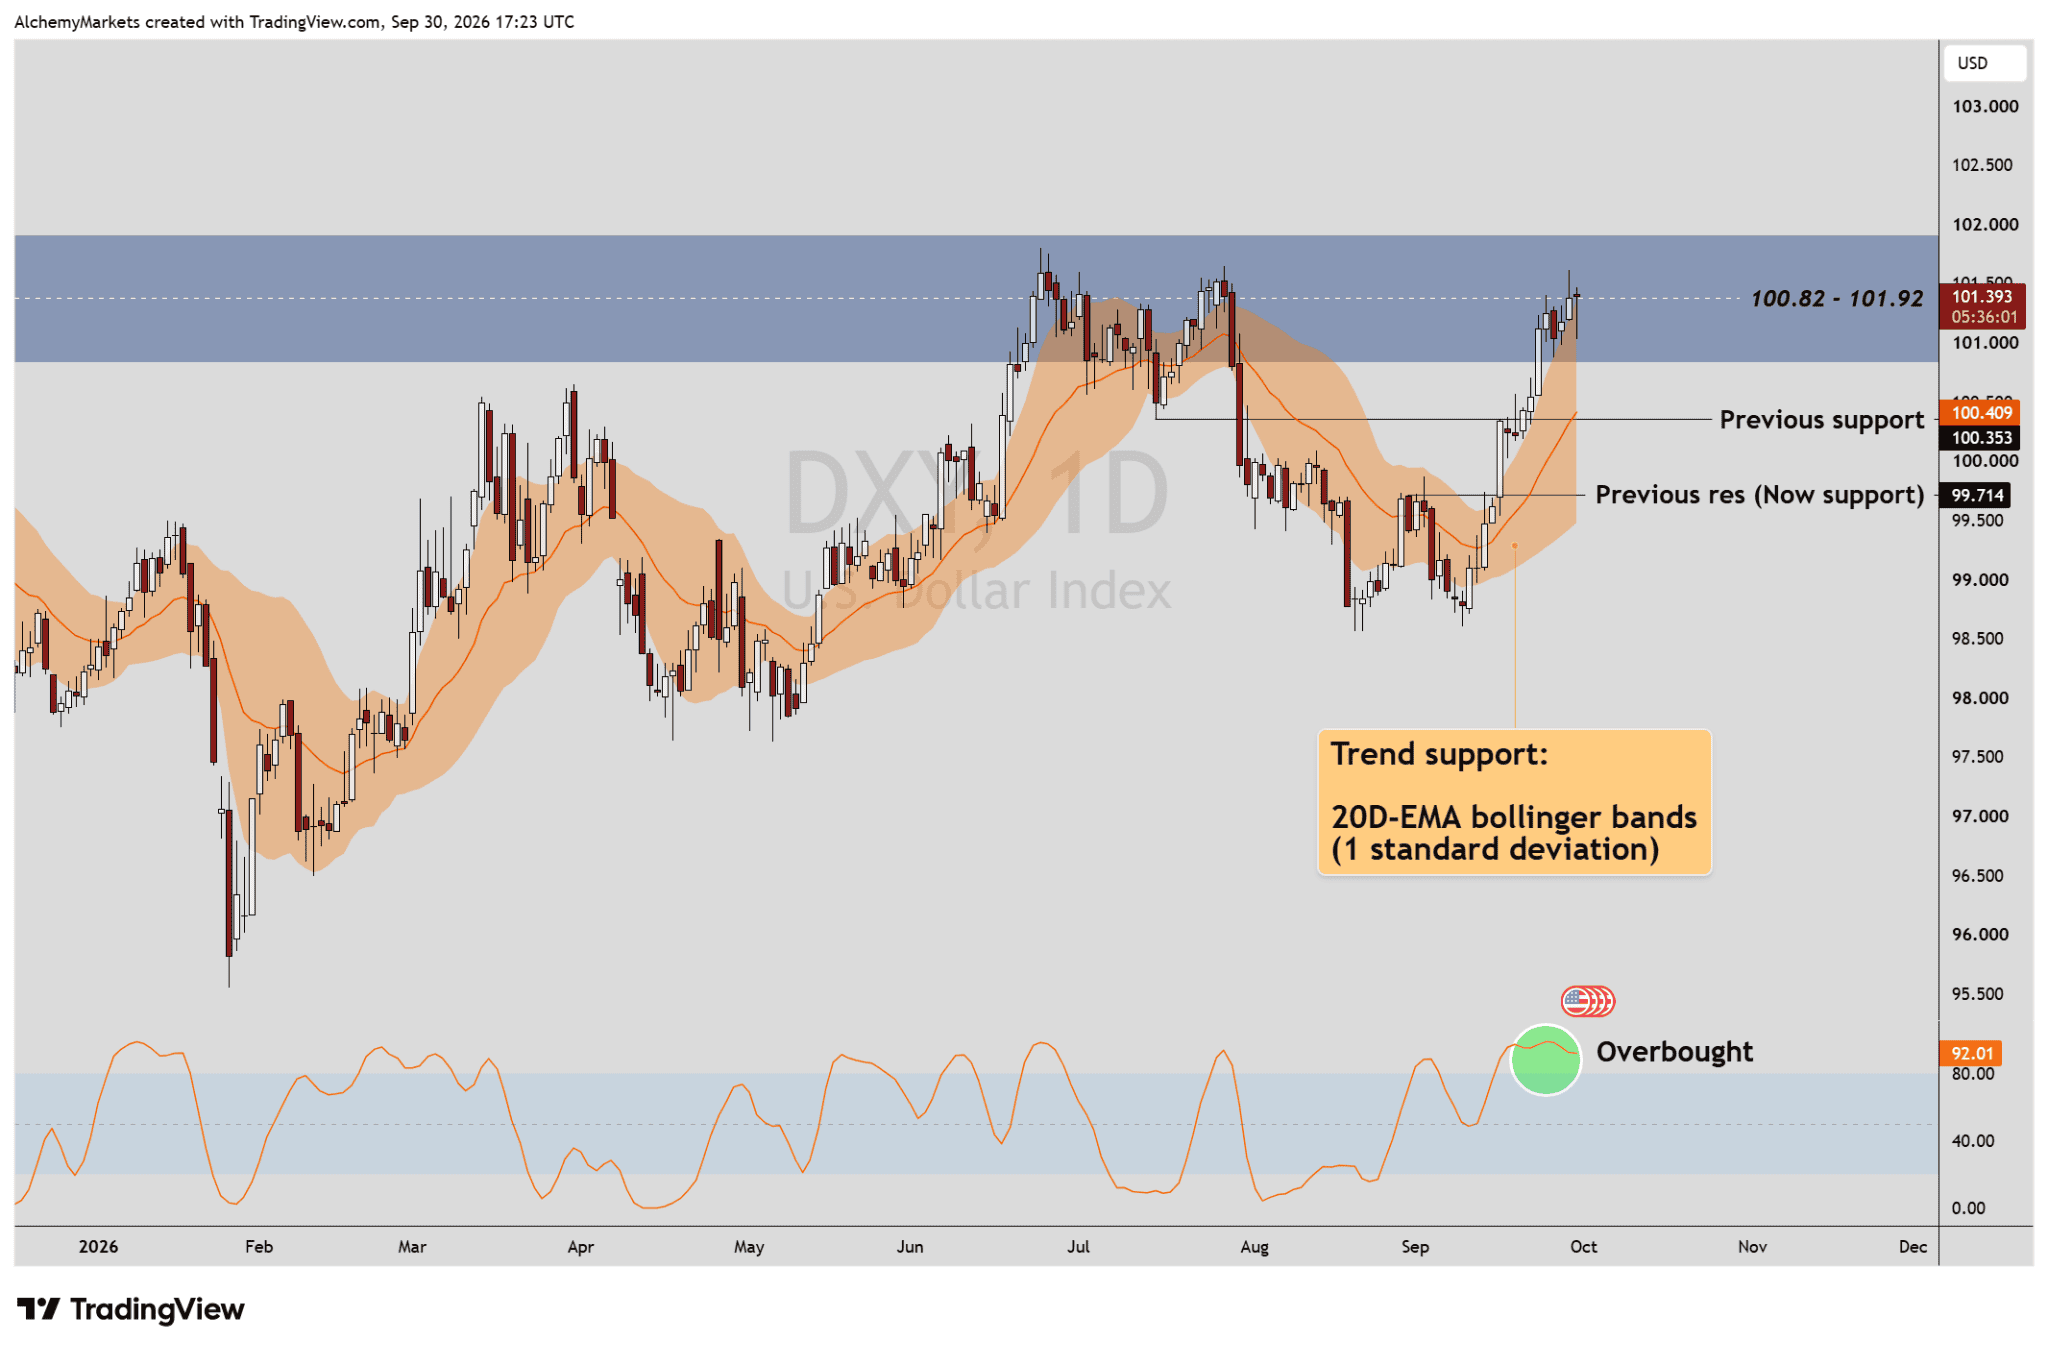
| DXY daily. Price is at the 100.82 to 101.92 resistance zone, but the daily trend has not broken. The 20-day EMA band is still acting as trend support. Chart: Alchemy Markets / TradingView. |
However, since the DXY is still above its 20D-EMA band, it’ll be tricky to time when a retracement will occur.
In this case, observe the 4H chart. The first sign of weakness appears when DXY breaks the 4H-20 EMA band.
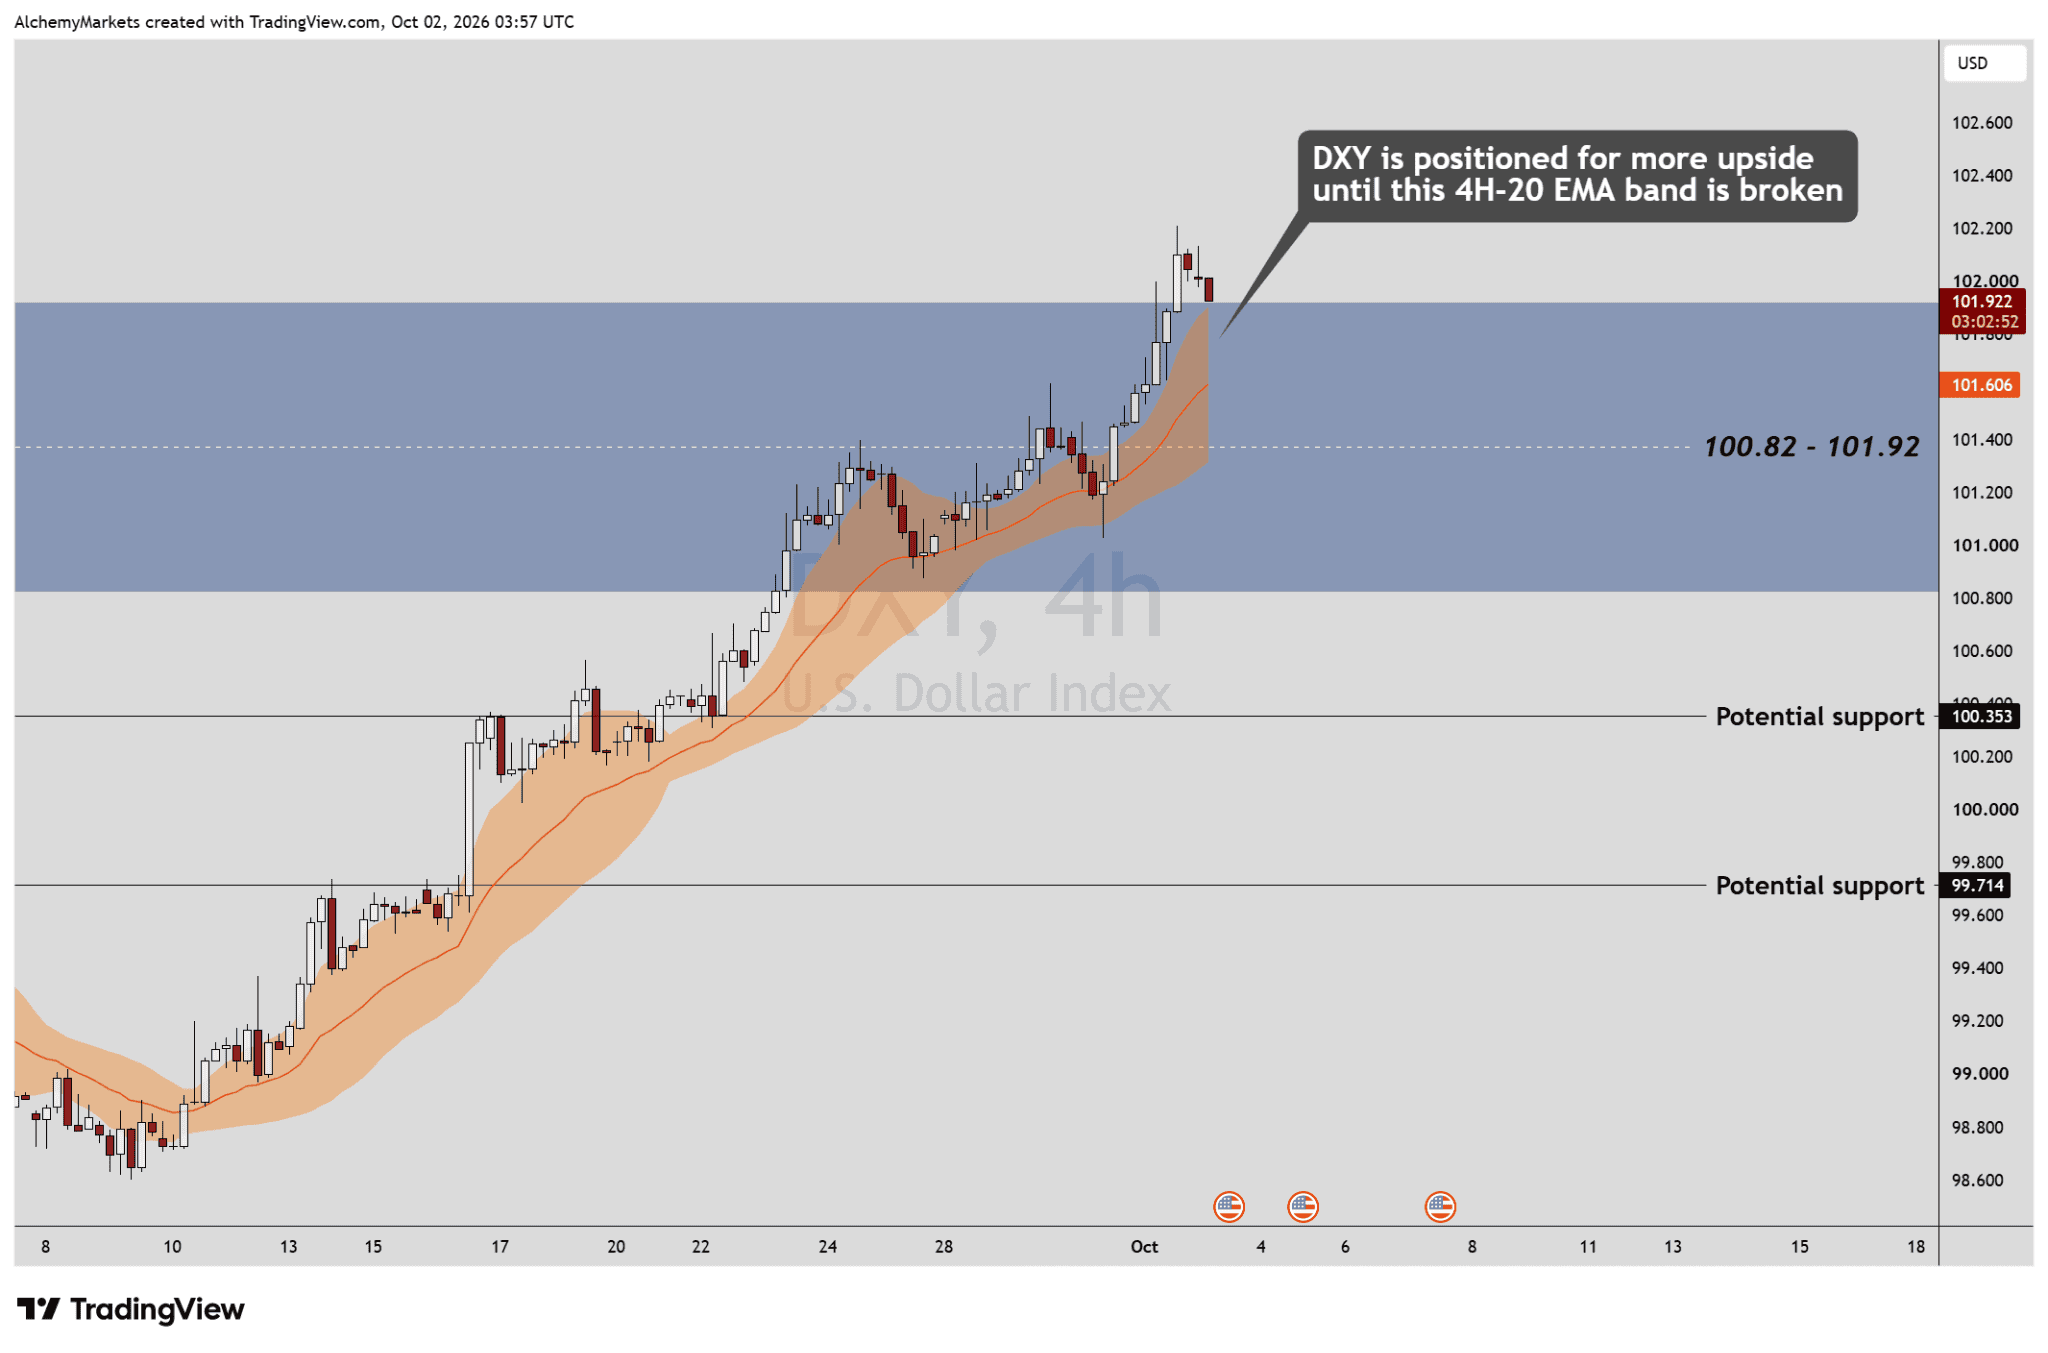
| DXY 4H. A break through the opposite side of the 20 EMA band would be the first rollover signal. Below it, 100.353 and 99.714 become the next support areas. Chart: Alchemy Markets / TradingView. |
As of October 2nd, the dollar’s short-term uptrend still deserves respect.
If the 4H band breaks and the retest fails from below, that is when the broader retracement case starts to look real.
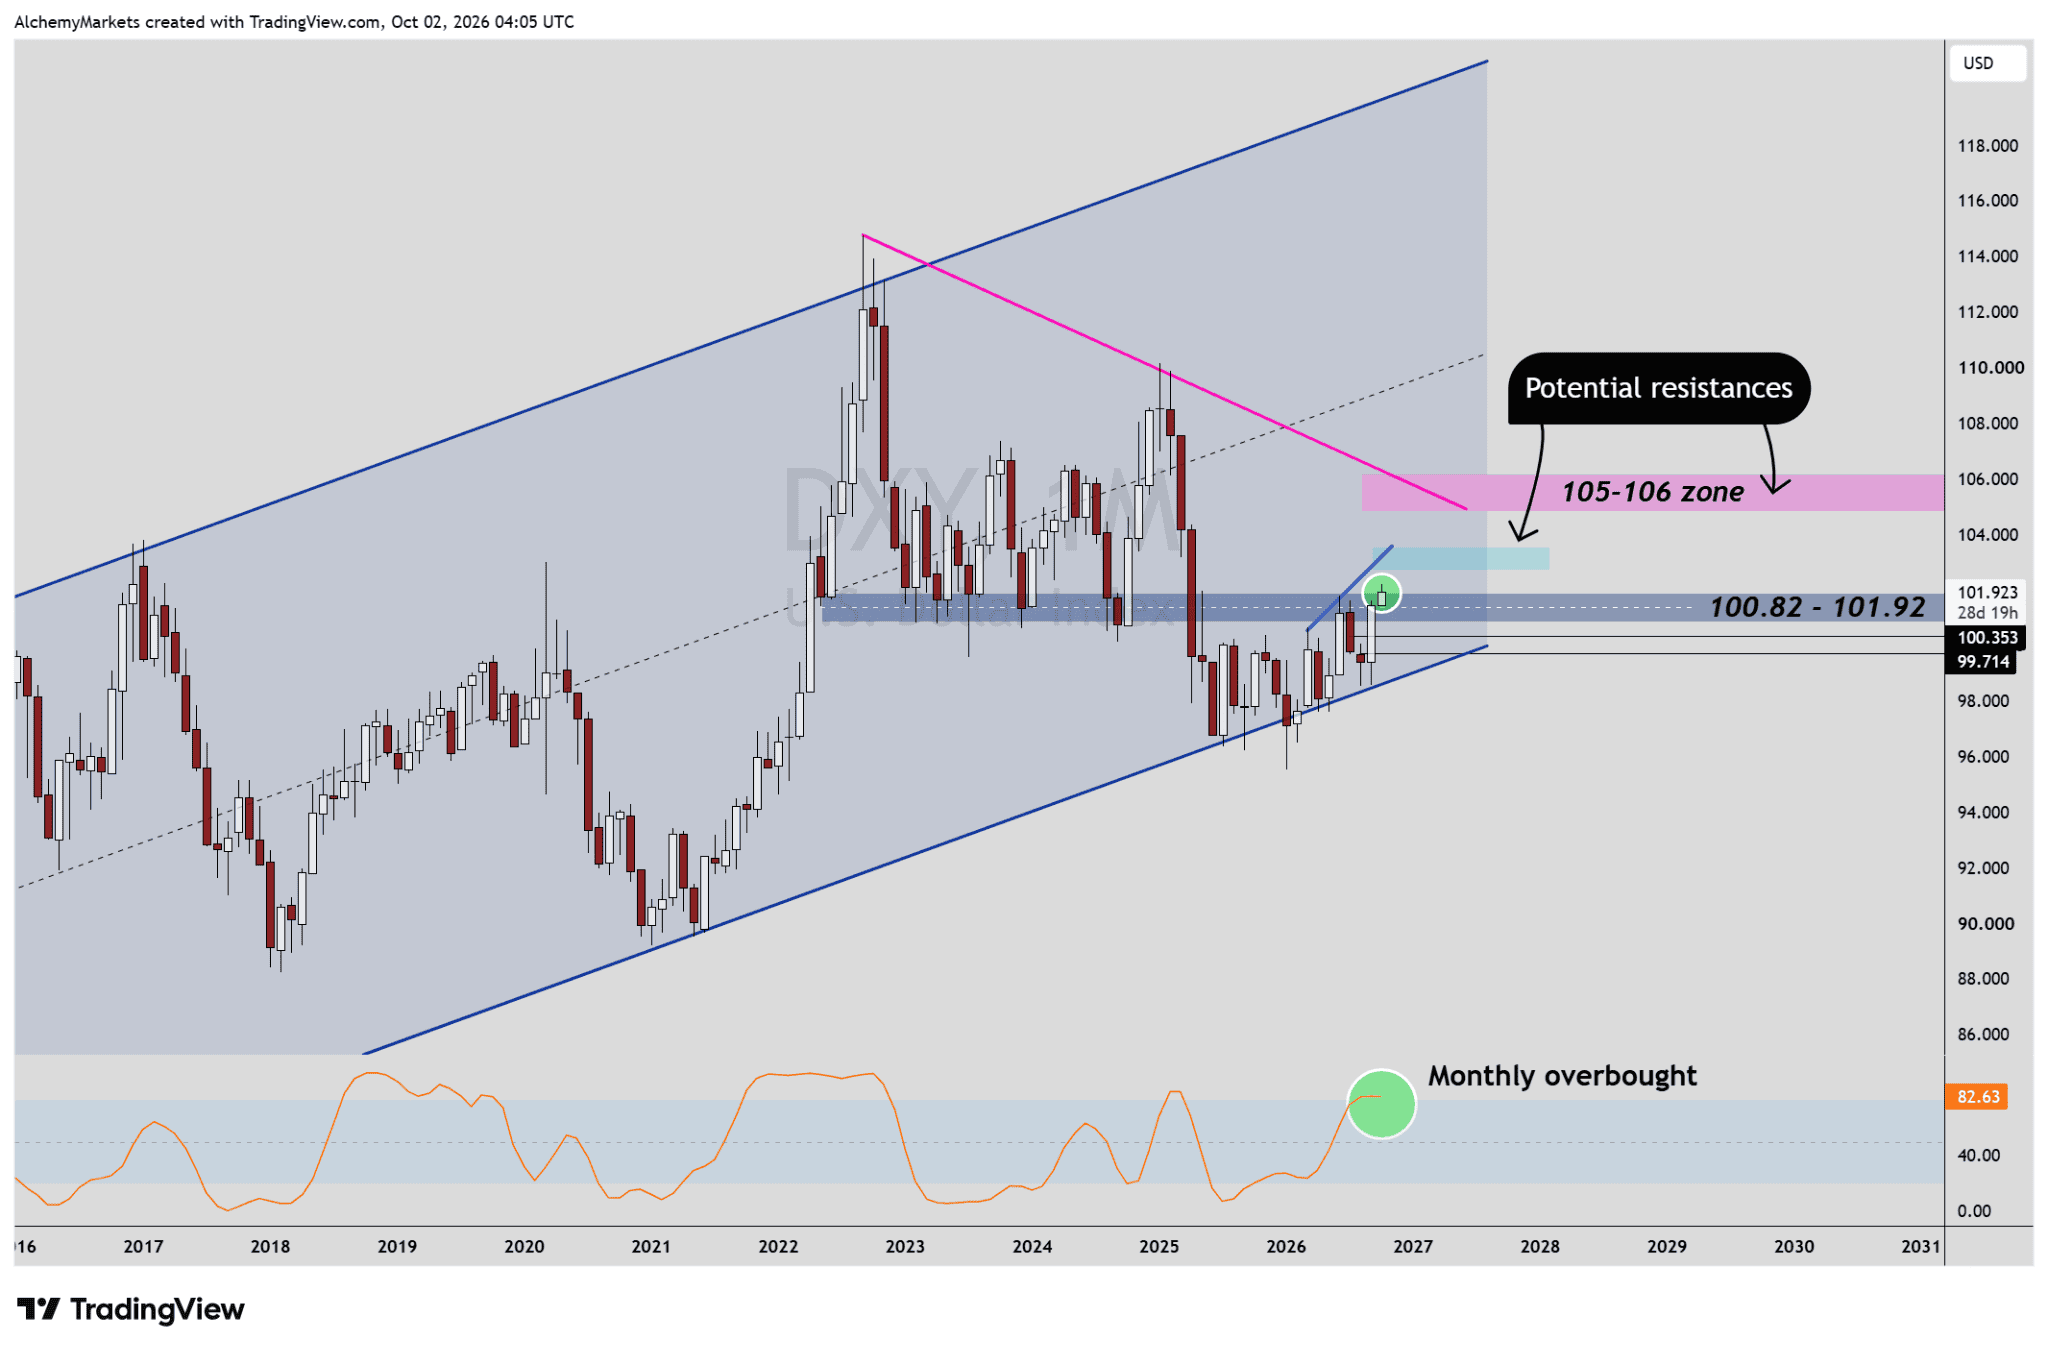
| DXY Monthly. Trendlines reveal 102-103, and 105-106 as zones the DXY could experience resistance, should the index rally. Chart: Alchemy Markets / TradingView. |
If resistance breaks instead, the higher-timeframe structure still leaves room for a grind towards 102 to 103, then 105 to 106.
DXY is apparently overbought on the monthly timeframe, so technically that is a lean towards a retracement soon (note time of writing this is early October).
But until the 4H band says otherwise, chasing the reversal on Dollar early does not make much sense.
Global Yields Surge, but USD Stops Confirming
The bond market is where the DXY story gets more interesting.
The whole US curve has been moving higher. From the 2-year out to the 30-year, yields have spent recent weeks respecting rising daily bands.
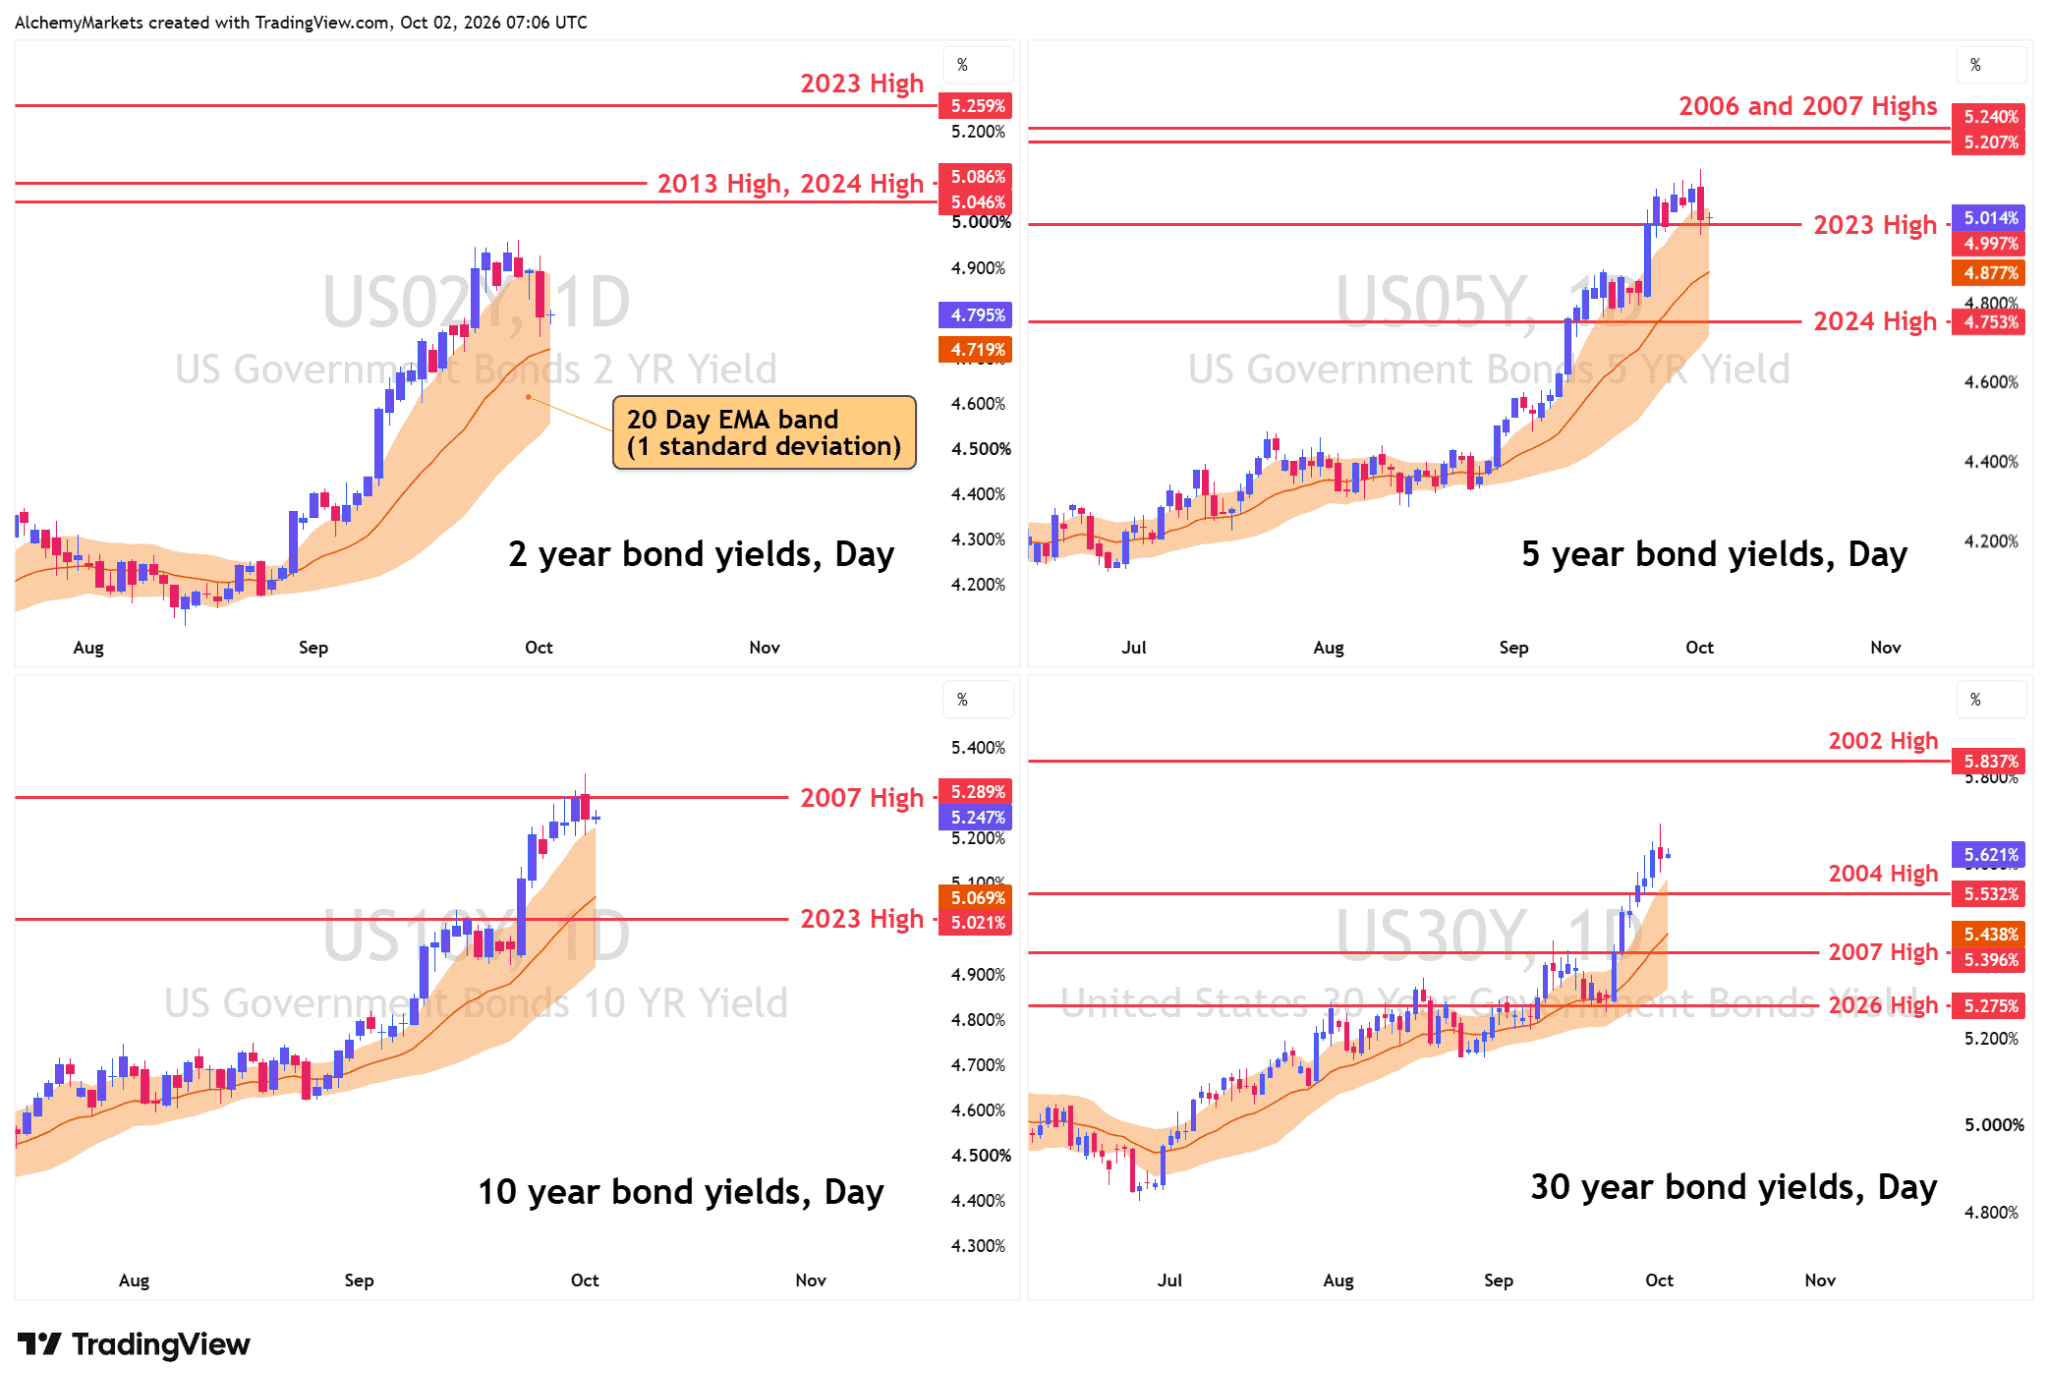
| US Treasury yields. The curve has been trending higher, but the front end is now becoming more sensitive to softer Fed expectations while the long end remains elevated. Chart: Alchemy Markets / TradingView. |
The split is starting at the front end.
August PCE came in softer than expected, while Fed president John Williams said there was no urgency for another hike.
The 2-year moved lower and October hike pricing cooled. The 10-year and 30-year barely played along.
GDP keeps the other side of the argument alive. Q2 growth was revised to 2.2% from 1.5%, while consumer spending was revised to 3.8% from 3.4%.
There is still enough activity here for the Fed to wait rather than rush into a cut.
The labour side is where Q4 can swing.
ADP accelerated to 90,000 private jobs, which is 20,000 above expectations in September. Meanwhile, job openings have softened and layoffs remain low.
NFP now becomes the cleaner test. A firm payroll print with sticky wages would give the front end a reason to reprice higher again. A weak print, especially with softer revisions or a higher unemployment rate, would push the other way.
Revisions still deserve attention. The latest preliminary BLS benchmark adjustment was only -79,000 jobs, or -0.1%, smaller than the average absolute benchmark revision over the past decade. So I would rather watch the actual revision path than assume the payroll data is hiding a much weaker economy.
| Practical read: NFP matters because it can decide whether the front end joins the long end again. If US02Y turns back up after the NFP release, the dollar still has macro support. If US02Y rolls over while DXY loses the 4H band, the weaker-dollar case gets a much cleaner confirmation. |
The long end is harder to calm because the pressure is no longer only just American, but rather, a global crisis.
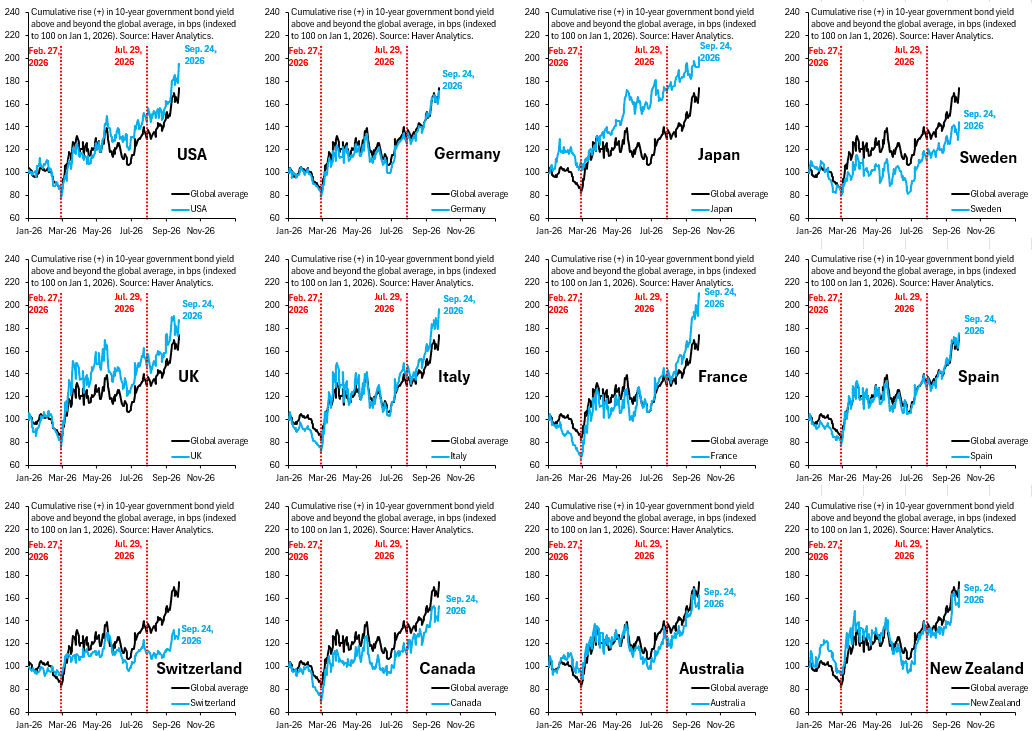
| Global sovereign yields. Borrowing costs are rising across major markets, so higher US yields are no longer a uniquely American signal. Source: Haver Analytics. |
Treasury expects another $628 billion in privately held net marketable borrowing during Q4. Even if the Fed side cools, supply can keep long-term yields uncomfortable.
Can yields keep going higher? Yes. As long as the 10-year and 30-year keep trailing their daily 20-EMA bands (1sd), there is no technical reason to call the move finished.
The more interesting change would be the long end breaking its band after US02Y has already rolled over. At that point, both the policy and duration sides would finally be easing together.
Weaker Dollar typically occurs after Midterm Elections
Midterm seasonality is worth watching in the background. Since 1930, the S&P 500 has risen during Q4 in roughly 83% of completed midterm years, averaging a 5.6% gain, according to Nasdaq Dorsey Wright.
Much of this appears to be attributed to political uncertainty going away after the midterm elections, which points us to an interesting, historically observed path:
- Dollar acts as a safe haven asset before the midterms, due to the political uncertainty.
- After the elections are over, political uncertainty fades, and higher beta, higher risk assets are preferred again.
That’s the typical formula – which translates into USD strength before midterms, and then weakness after. However, things may be different this time around because of the stress building across bonds and credit:
- If Treasury yields remain elevated, another Fed hike stays on the table in December.
- Or, junk-bond spreads continue widening, and thus typical risk-on rotation after midterms could be delayed.
That gives us a simple Q4 test: falling yields alongside calmer credit conditions would strengthen the case for post-election dollar weakness
But, persistently high yields or worsening credit stress would favour a stronger dollar for longer.
USDJPY Shows the First Real Break
USDJPY is where the macro and the technicals are closest to agreeing.
The previous behaviour was clean. Pullbacks kept finding support around the 20-week EMA band, then the pair resumed higher.
The latest sequence no longer fits that pattern.
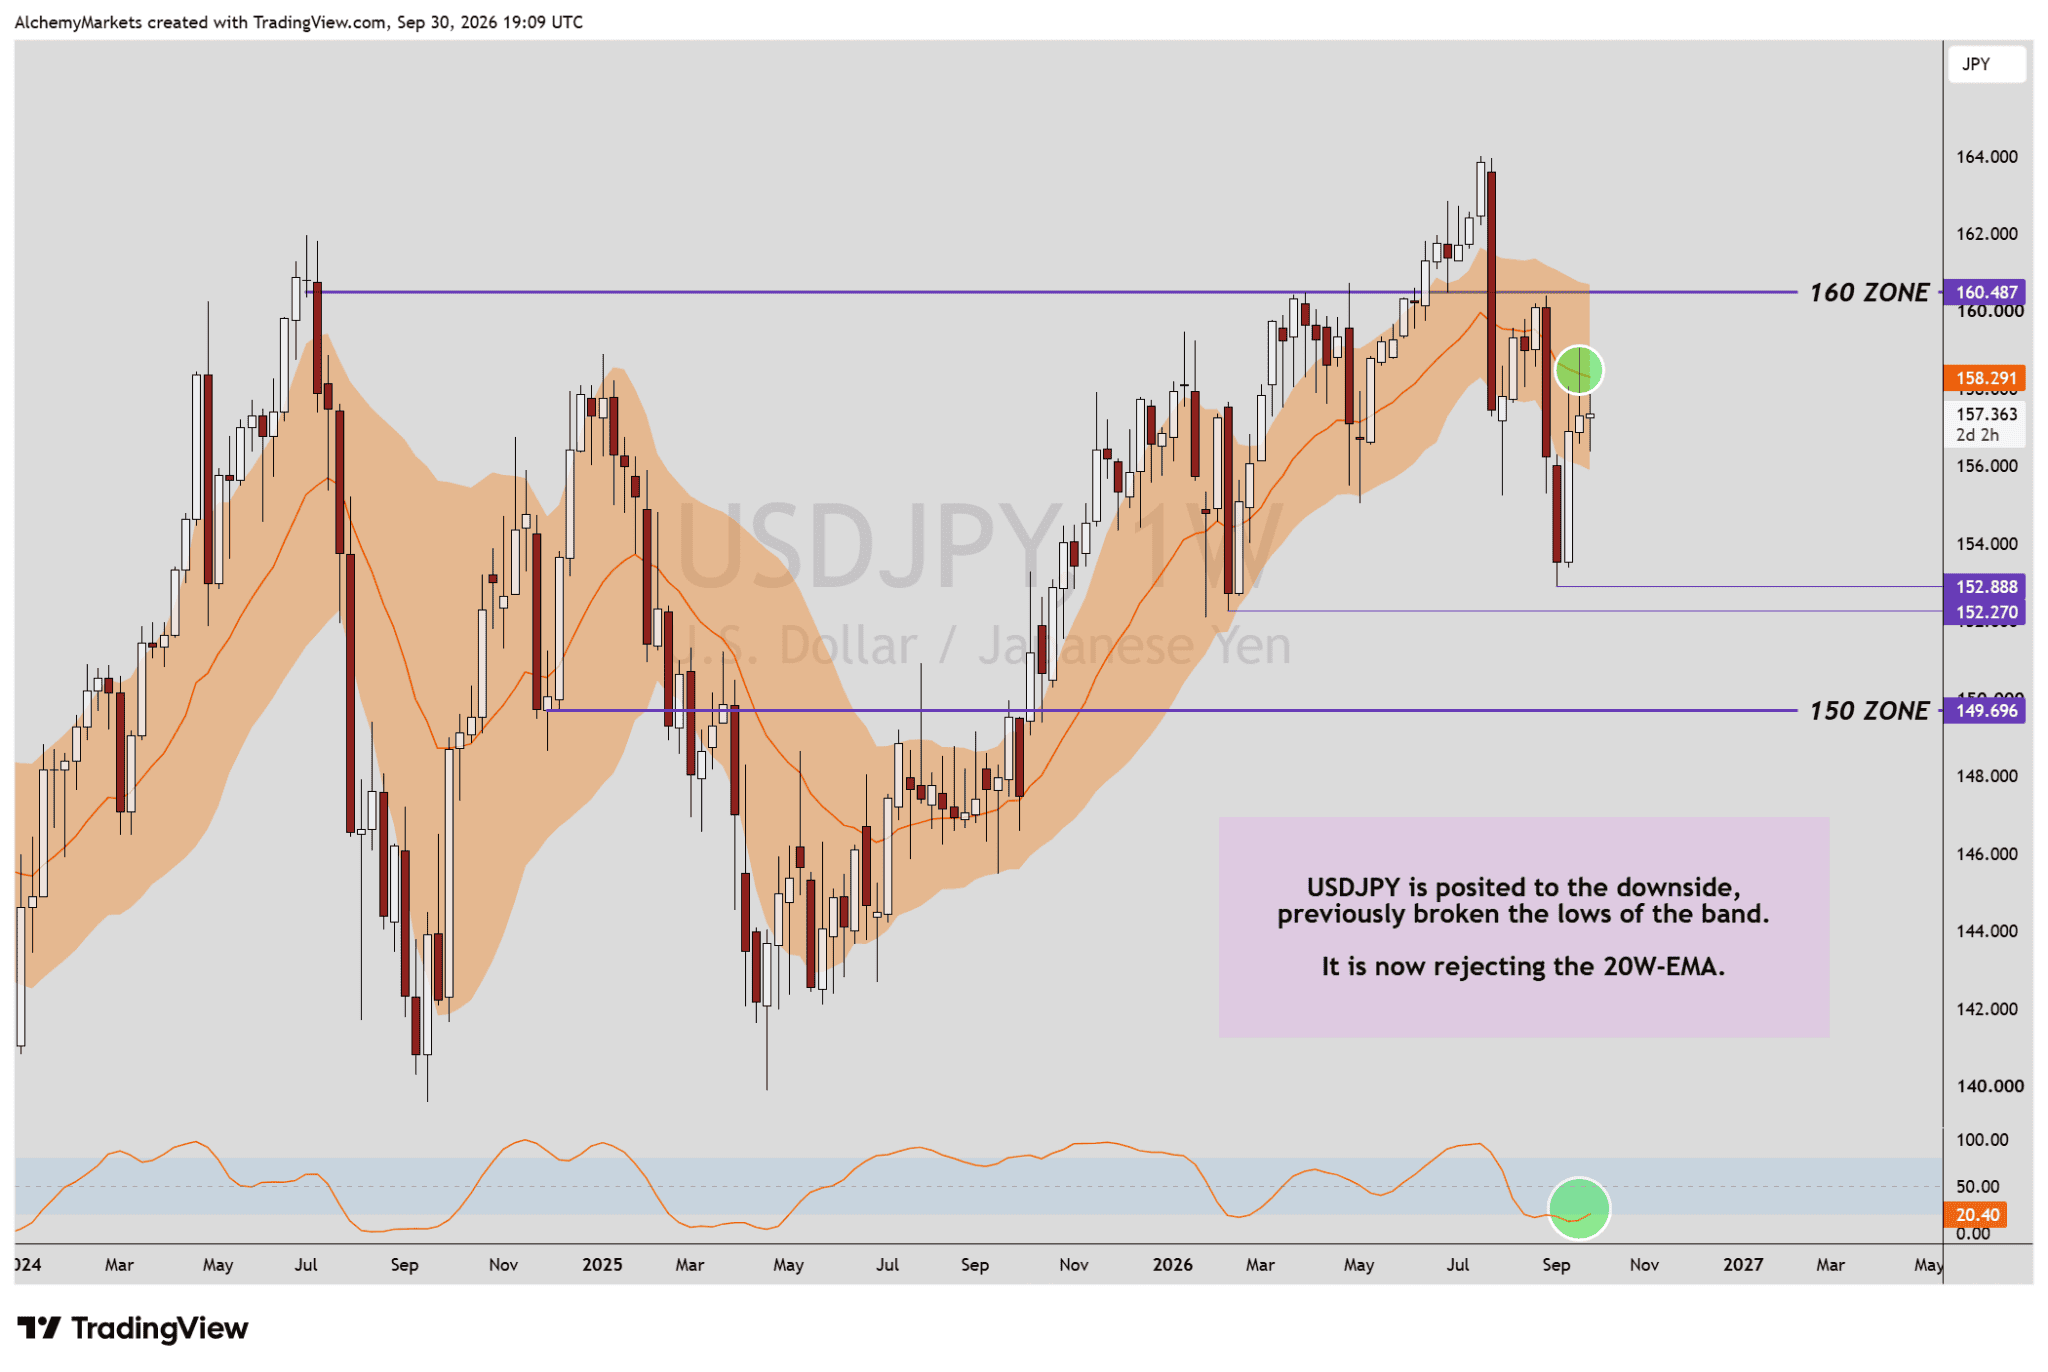
| USDJPY weekly. Price broke the 20-week EMA band. The retest from below then failed, making this the cleanest behavioural break among the major USD pairs. Chart: Alchemy Markets / TradingView. |
Japan is also giving the yen more fundamental help than it had earlier in the year. The BoJ has taken its policy rate to 1.25%, and policymakers are discussing a faster hiking path if inflation stays persistent.
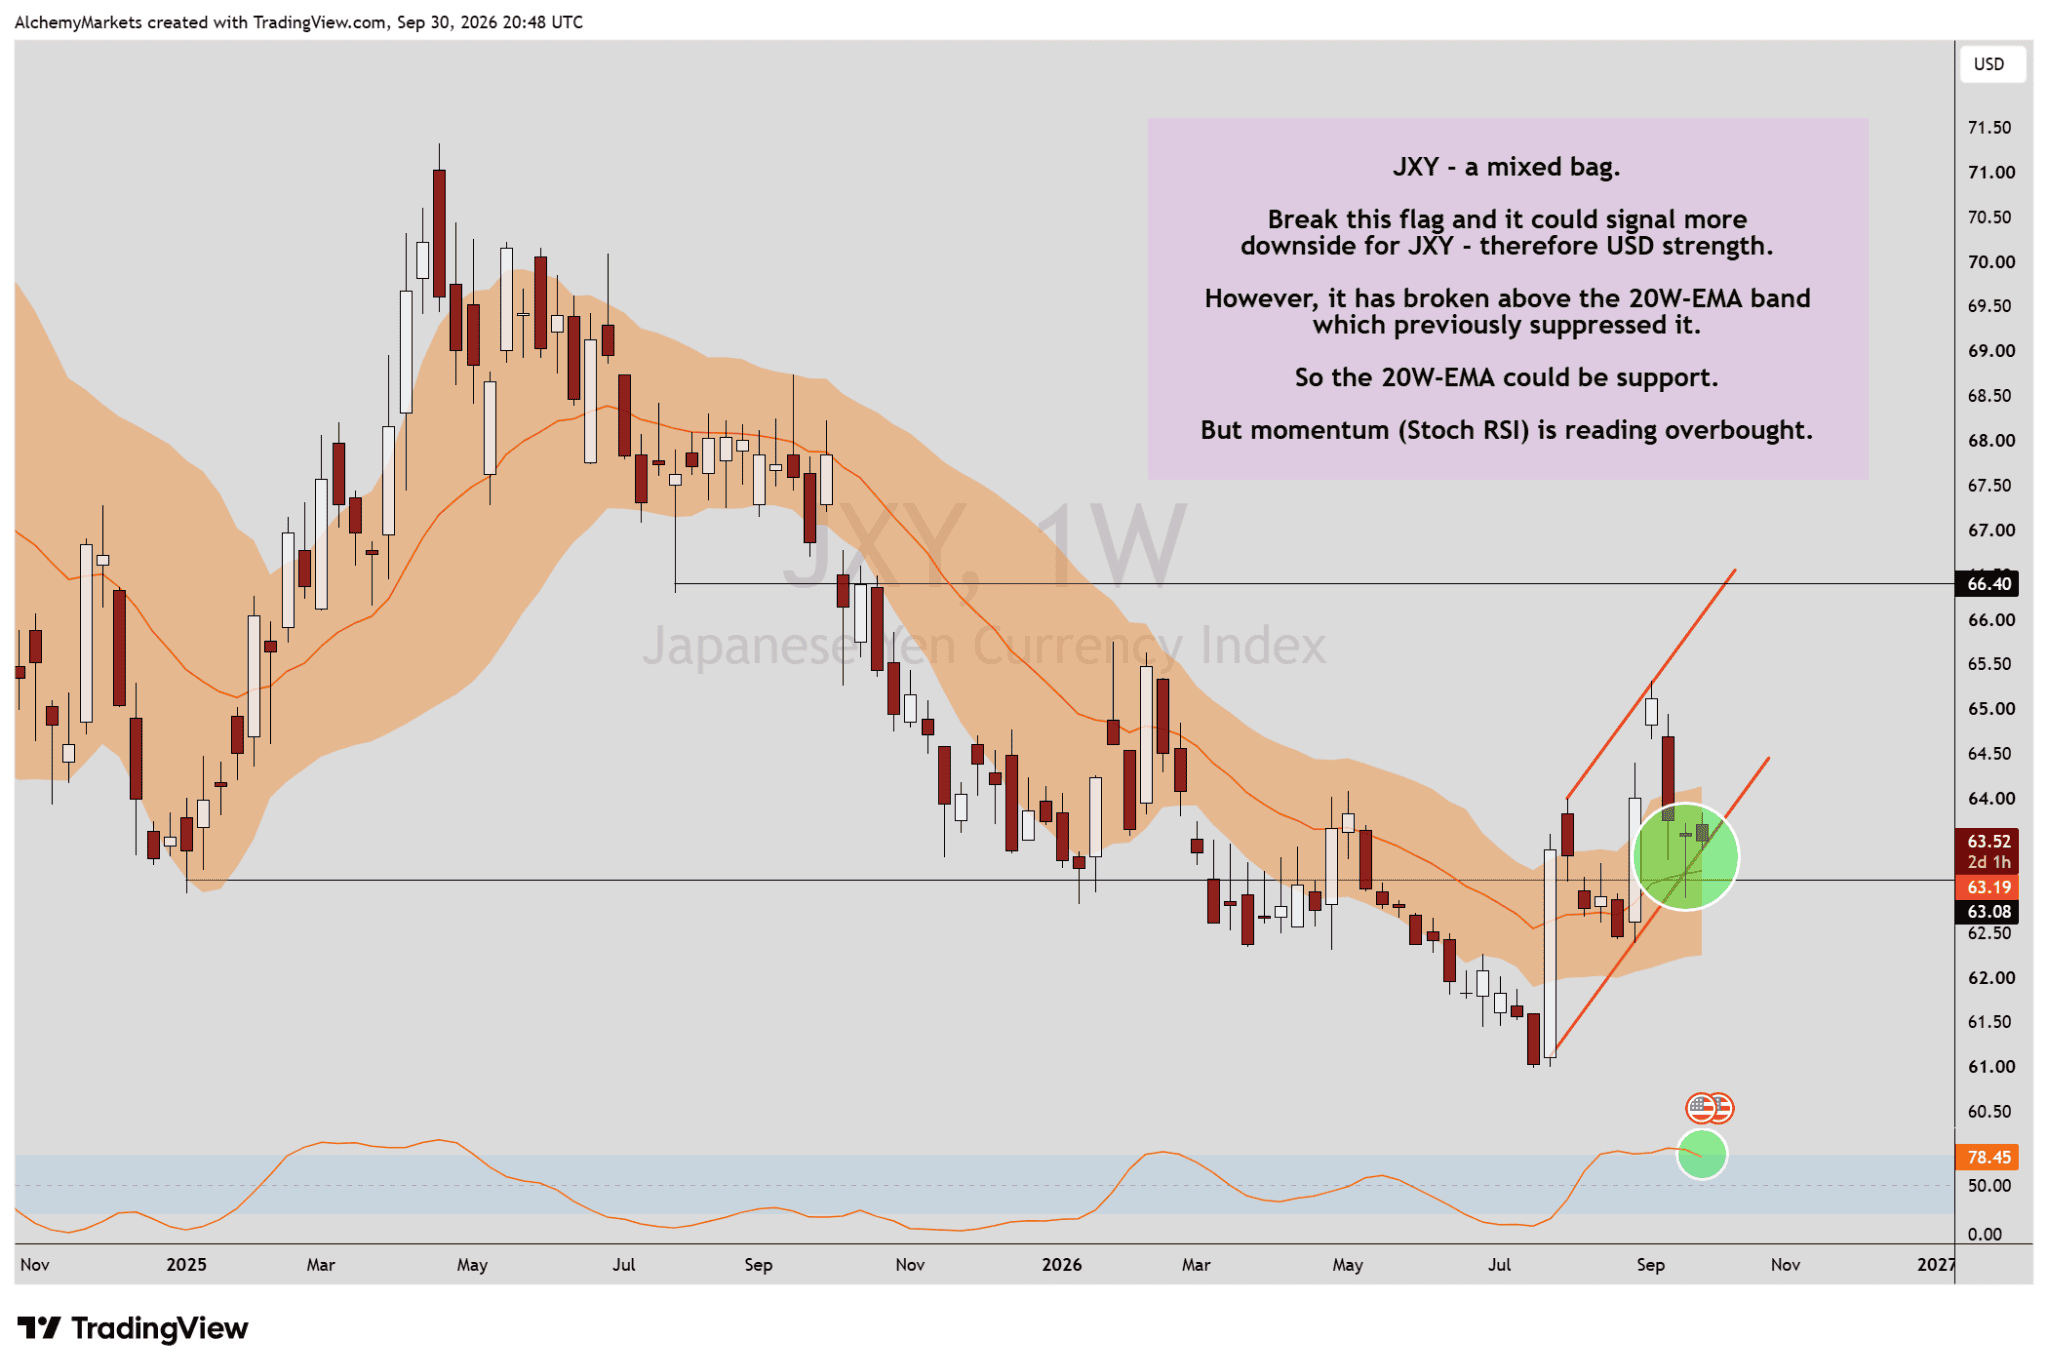
| JXY. The yen index is sitting near support, giving the USDJPY downside case an independent cross-check. Chart: Alchemy Markets / TradingView. |
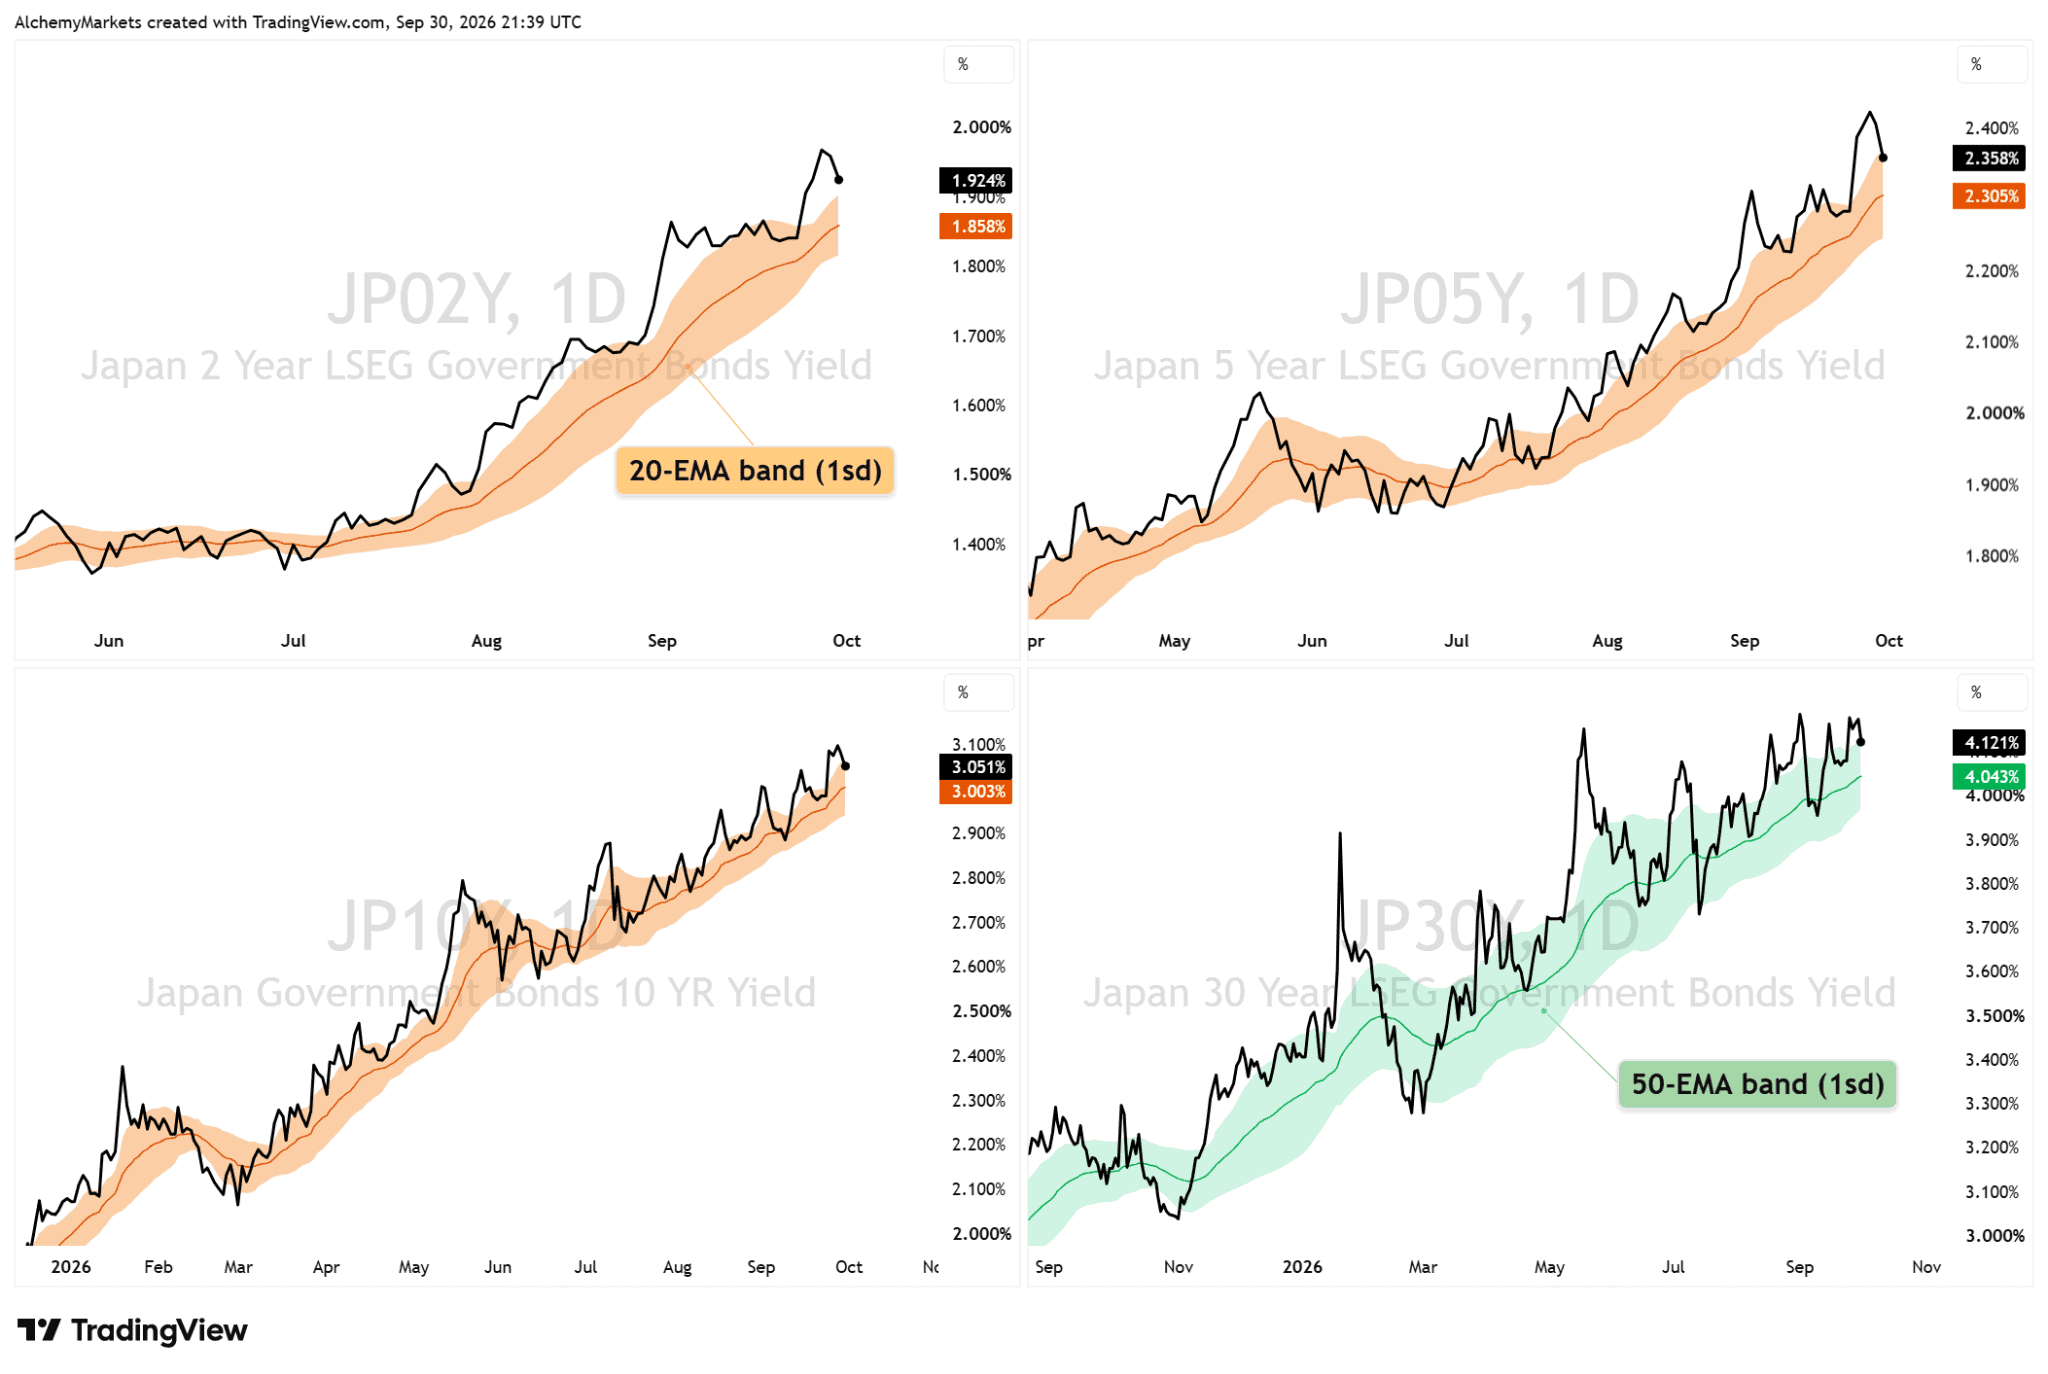
| Japan yields. The local bond market is repricing higher across the curve, which makes the old one-way yen carry trade less comfortable. Chart: Alchemy Markets / TradingView. |
For me, this is the cleanest reversal setup in the pack. The fundamentals are improving for the yen, and price has already started behaving differently.
Actionable: Another break through the lower side of the weekly band would strengthen the downside case. A clean reclaim of the band would tell me the trend change failed.
AUD Has the Cleaner Rate Story
Australia is one of the cleaner non-USD cases because local rates can do some of the work.
Australian yields are already competitive with US yields, and domestic inflation is still strong enough to keep the RBA tight. AUD therefore has some support of its own.
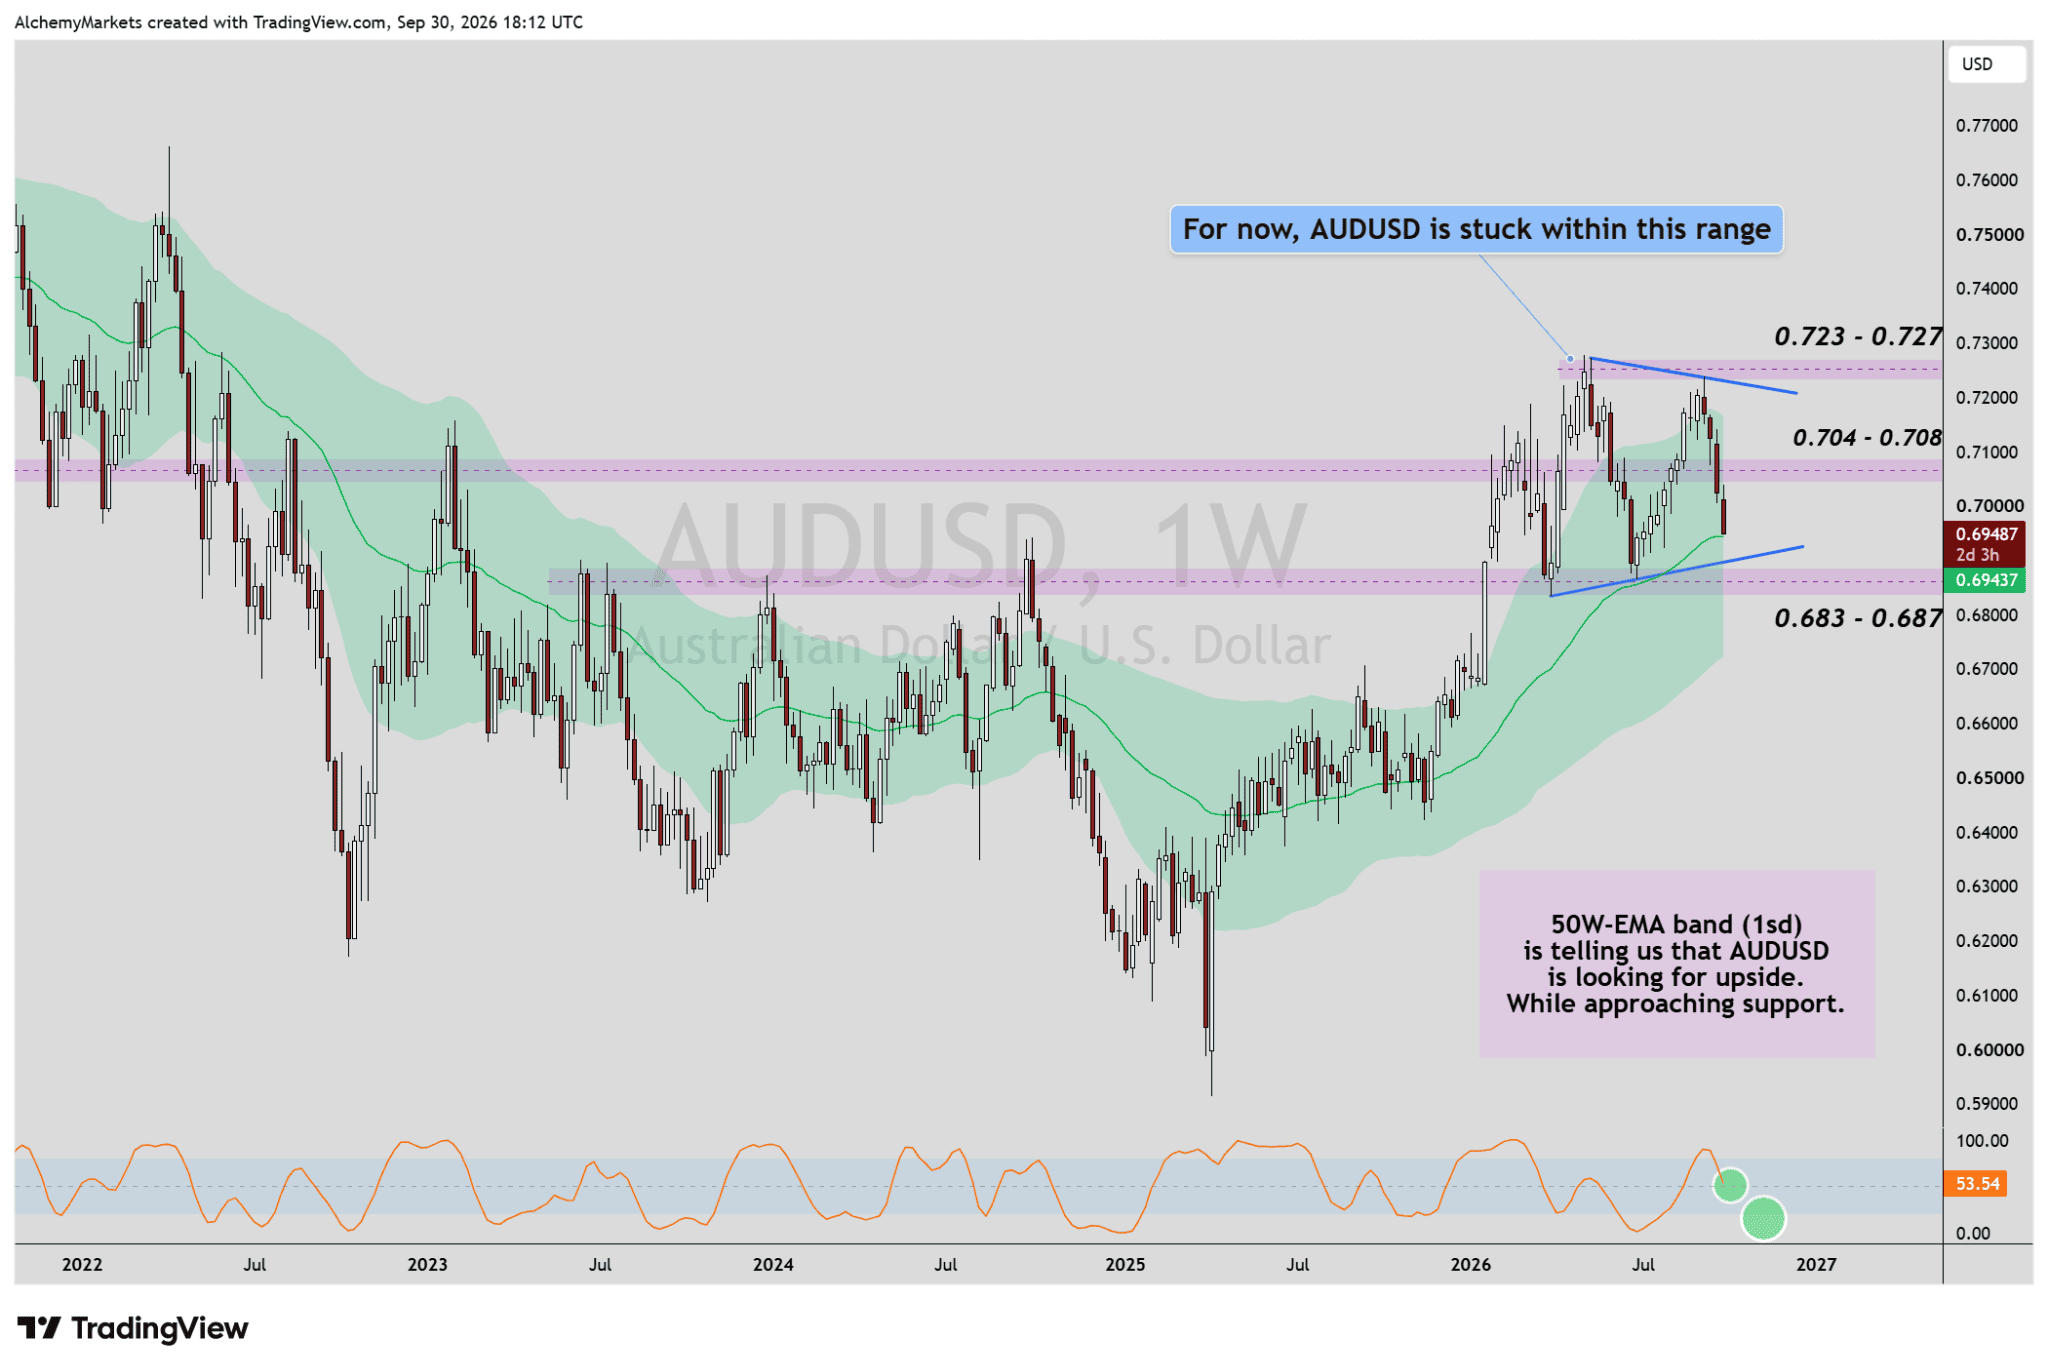
| AUDUSD weekly. Price is still rangebound between roughly 0.683 and 0.723. The 50-week EMA band gives the cleaner structural read. Chart: Alchemy Markets / TradingView. |
AUDUSD itself has not done enough yet. Momentum is still soft, so the range and the band need to prove the trade is ready.
AUDNZD tells us whether the strength is genuinely Australian.
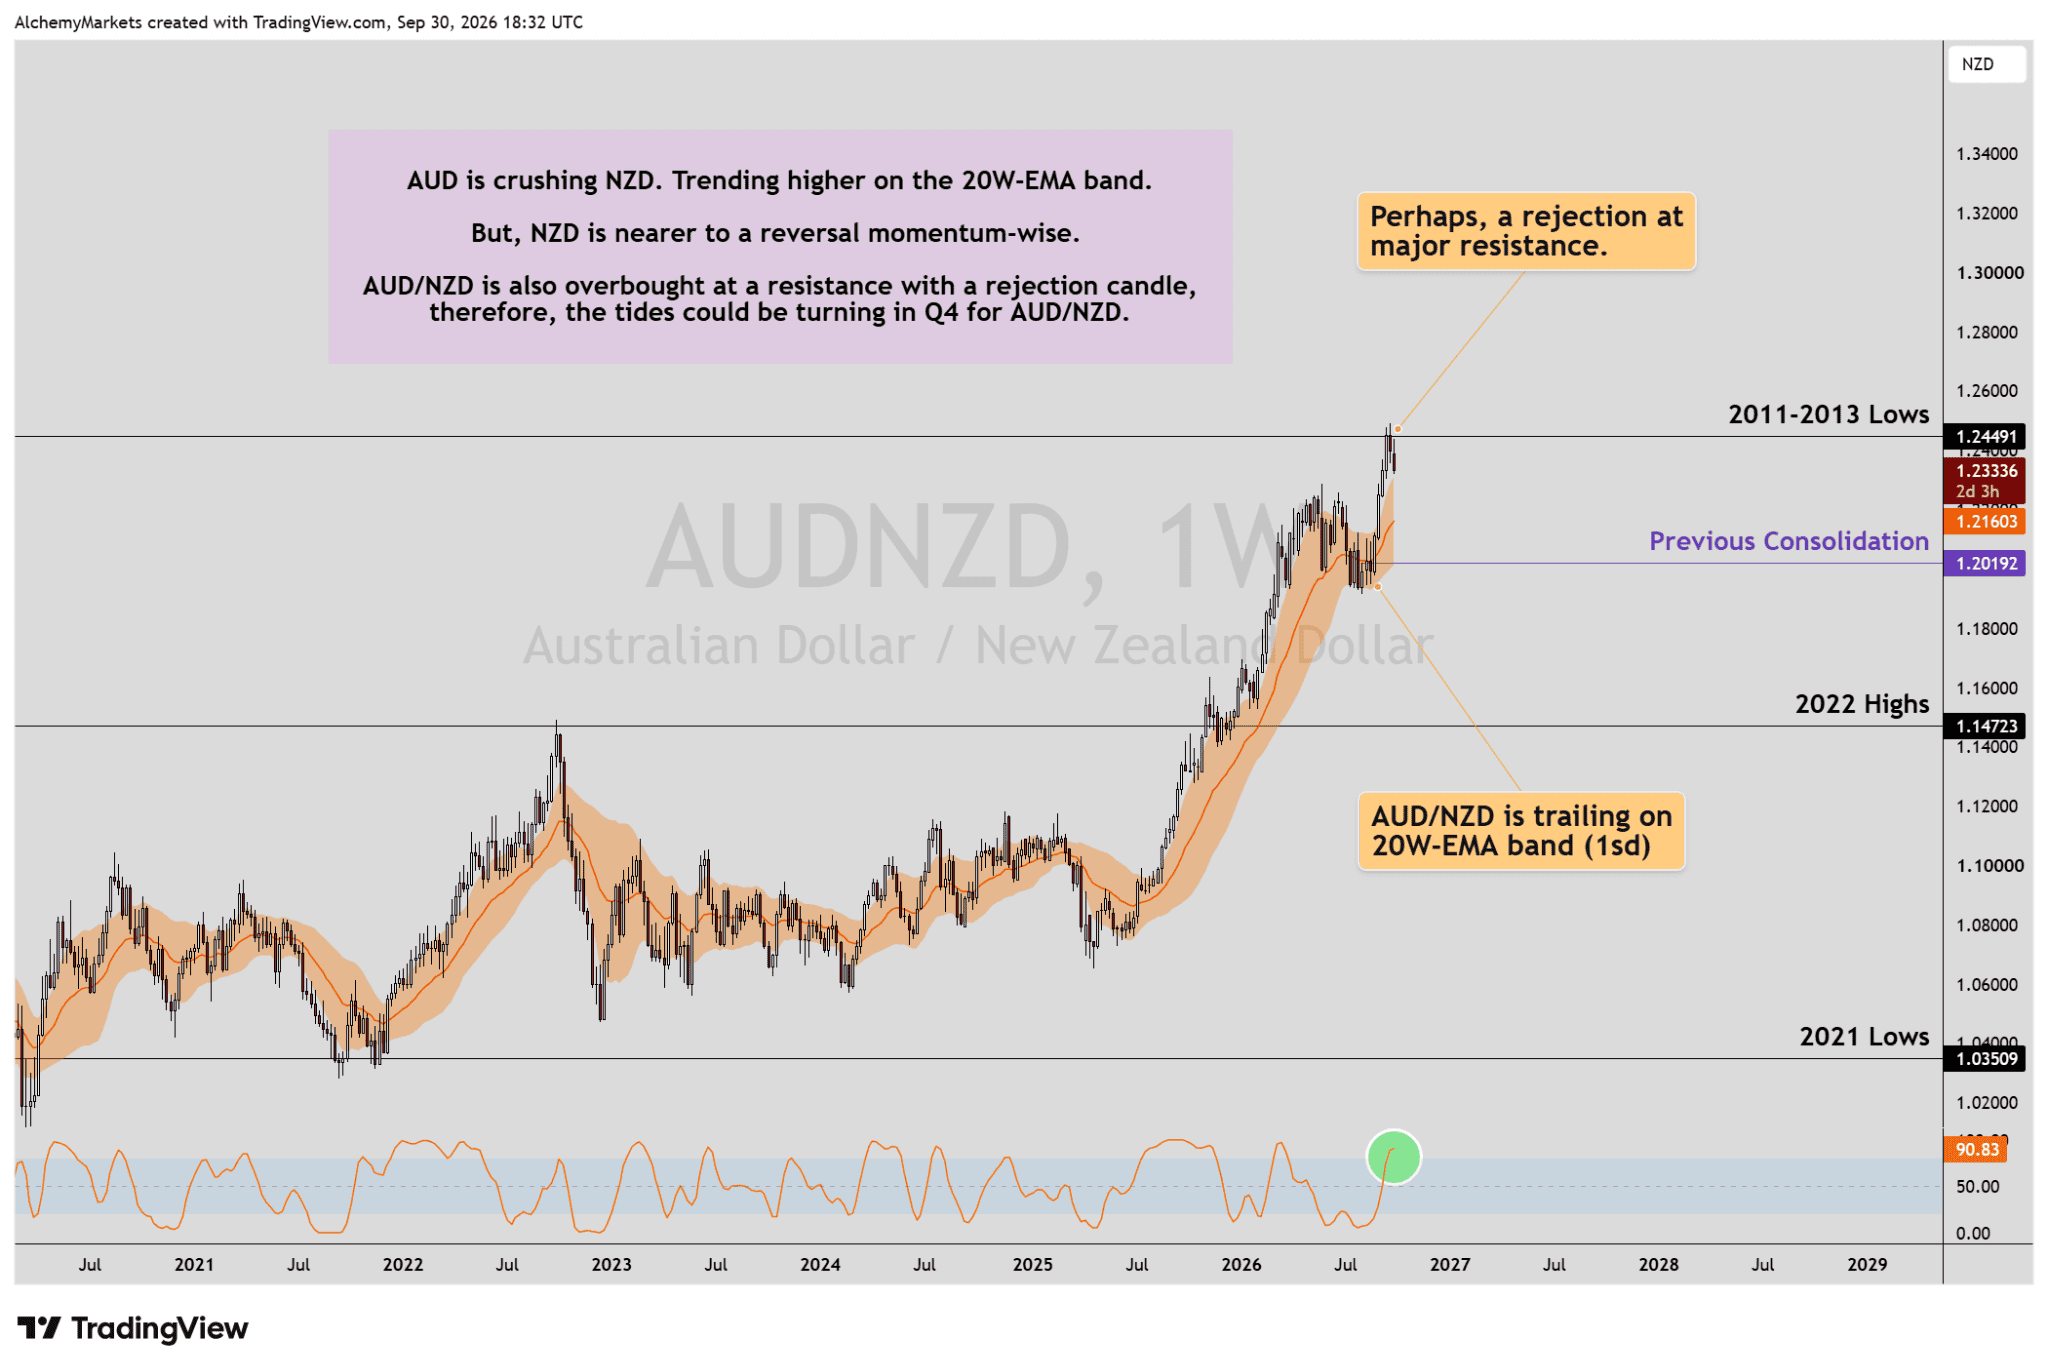
| AUDNZD weekly. AUD has dominated NZD, but the pair is now at major resistance. The 20-week band becomes the relative-strength trigger. Chart: Alchemy Markets / TradingView. |
If AUDNZD pulls back and the 20-week band holds, AUD leadership remains intact. If the band breaks on the opposite side and a retest fails, NZD has finally started to take the lead.
NZDUSD Still Needs a Breakout
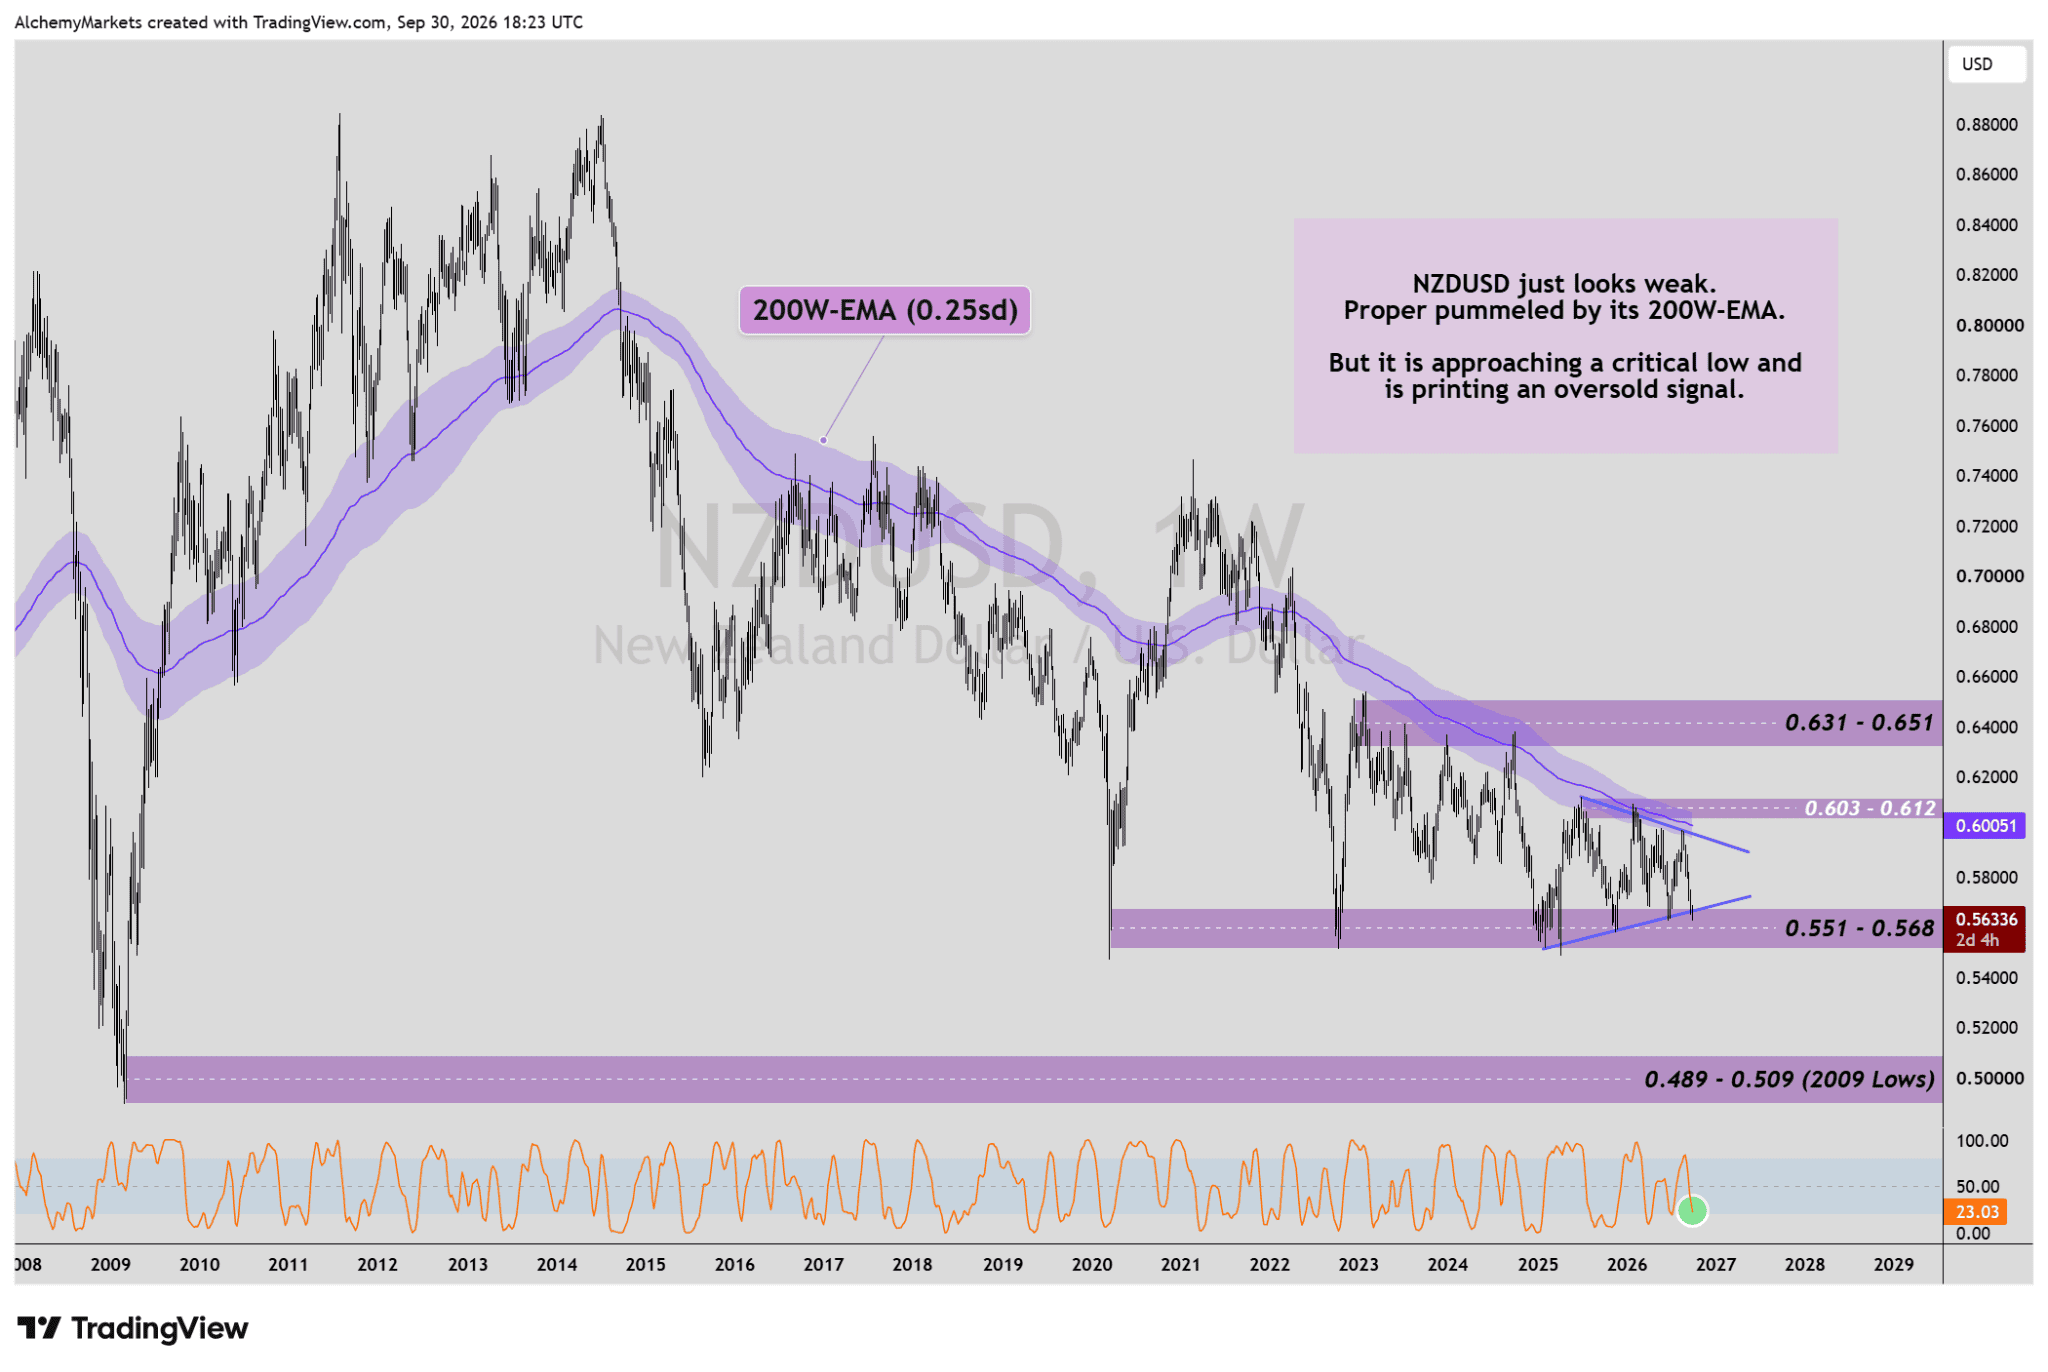
| NZDUSD weekly. The kiwi is still weak and trapped inside a long-running range while the 200-week EMA structure remains overhead. Chart: Alchemy Markets / TradingView. |
NZDUSD has spent a long time wicking between roughly 0.551 and 0.603. Until one side gives way, the range is still the trade.
A break above 0.603 and through the 200-week band would be meaningful. Above there, 0.631 to 0.651 becomes the next area. A break below 0.551 keeps the downside regime intact.
GBP Leads EUR Into Q4
GBP and EUR do not enter Q4 with the same rates backdrop.
UK front-end yields have risen aggressively. Euro-area yields are moving higher too, but from a lower base. Sterling enters Q4 with the cleaner carry backdrop.
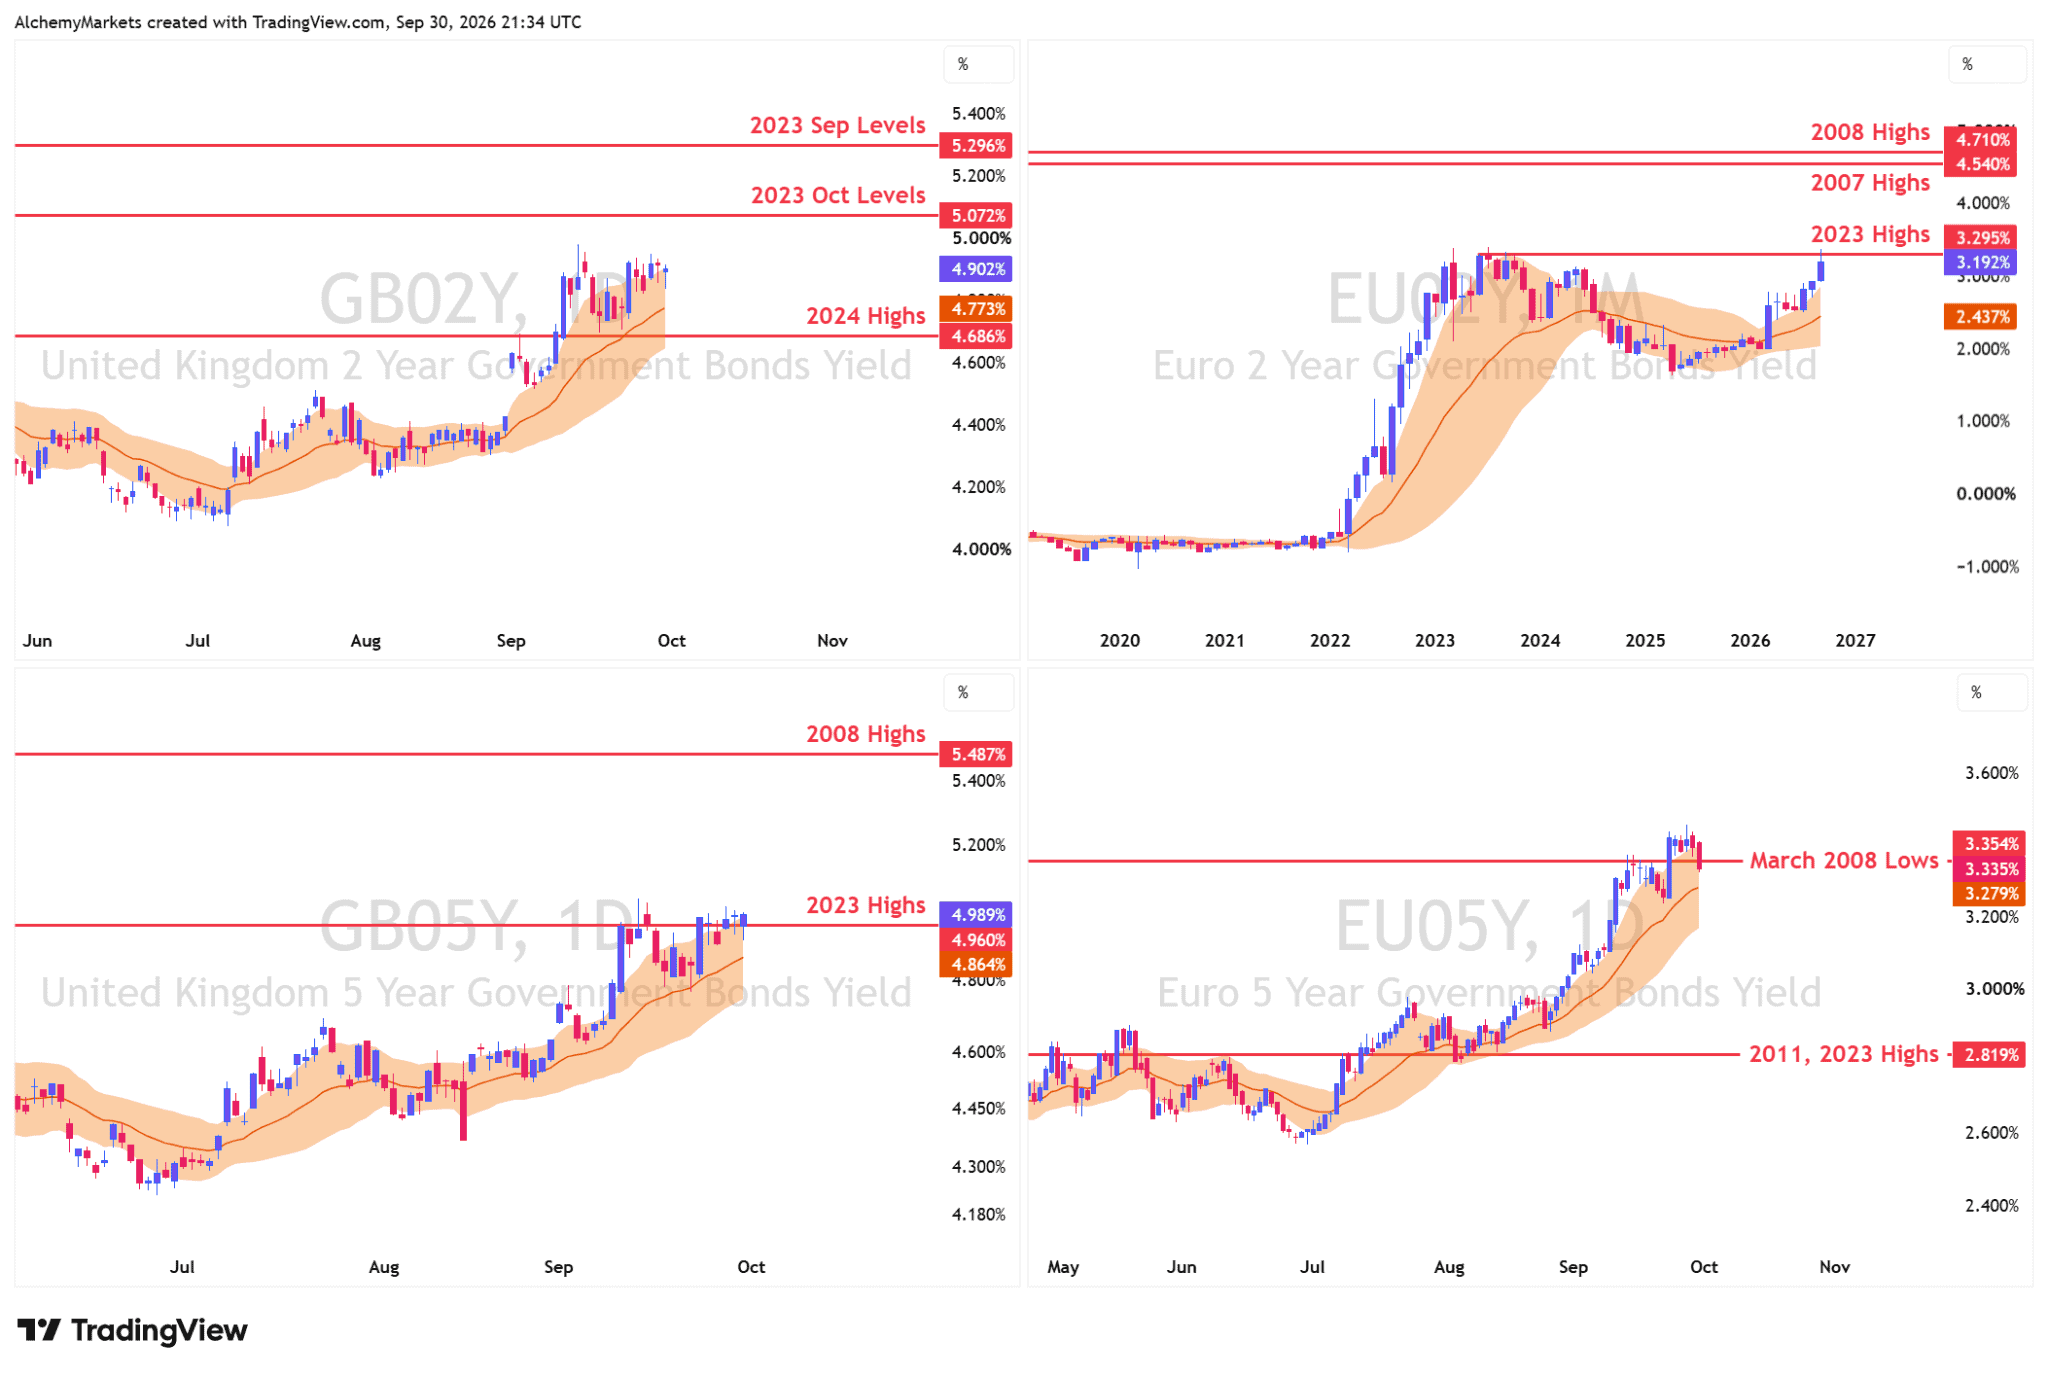
| UK versus euro-area front-end yields. The UK has the stronger relative-rate backdrop, which helps explain why GBP can outperform EUR even if both currencies benefit from a softer dollar. Chart: Alchemy Markets / TradingView. |
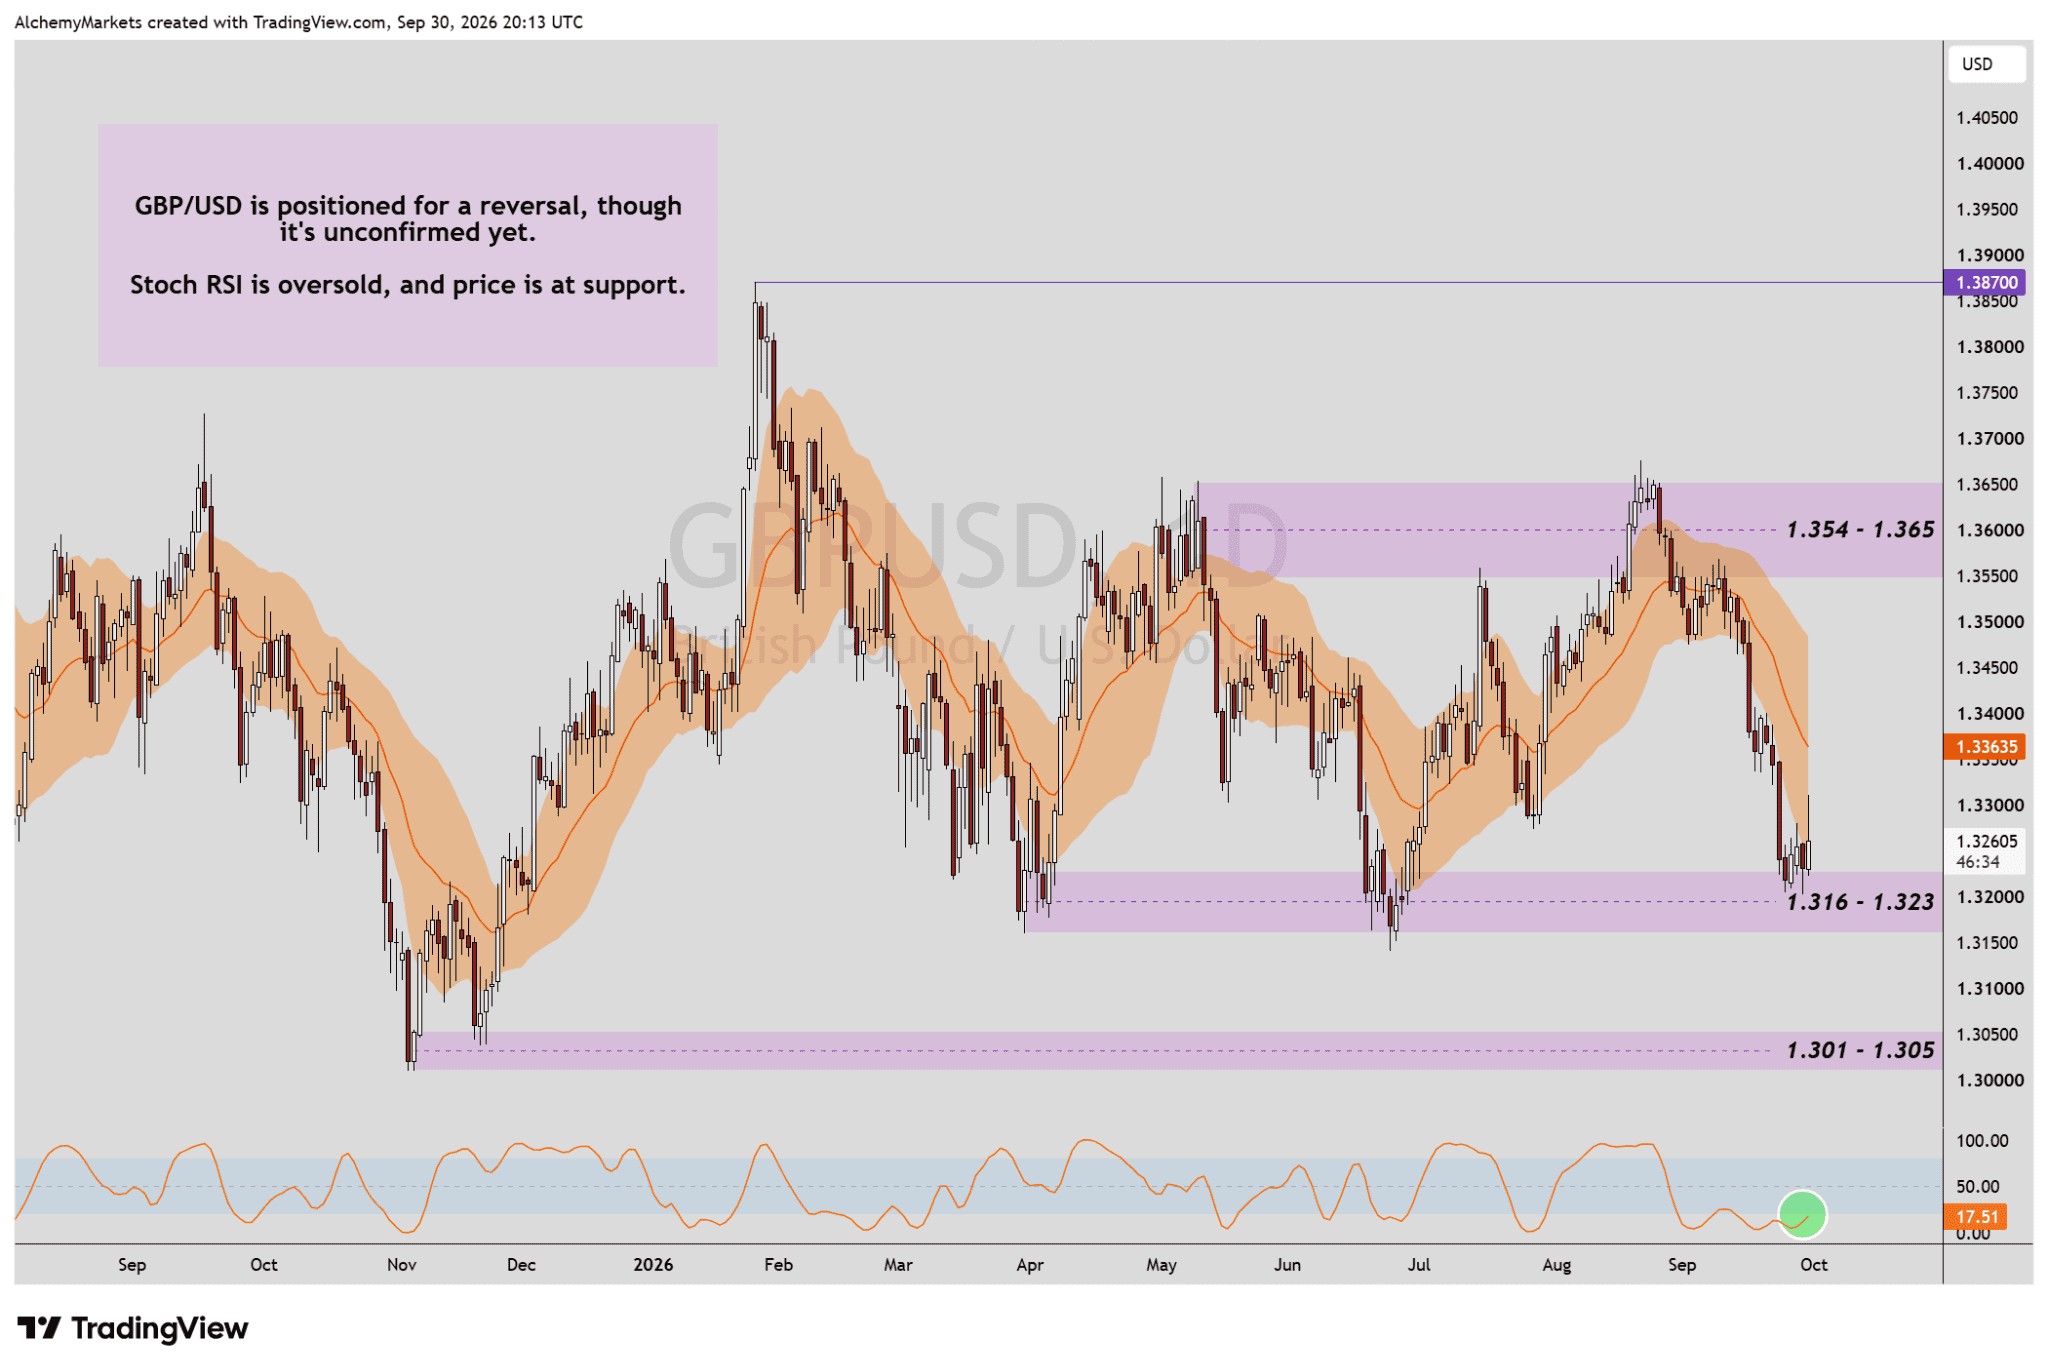
| GBPUSD. Sterling is at support with oversold momentum after losing its short-term EMA structure. Interesting, but not yet confirmed. Chart: Alchemy Markets / TradingView. |
GBP has the better rate backdrop, although the UK’s inflation and growth mix is still awkward. High local yields alone are not enough to chase it.
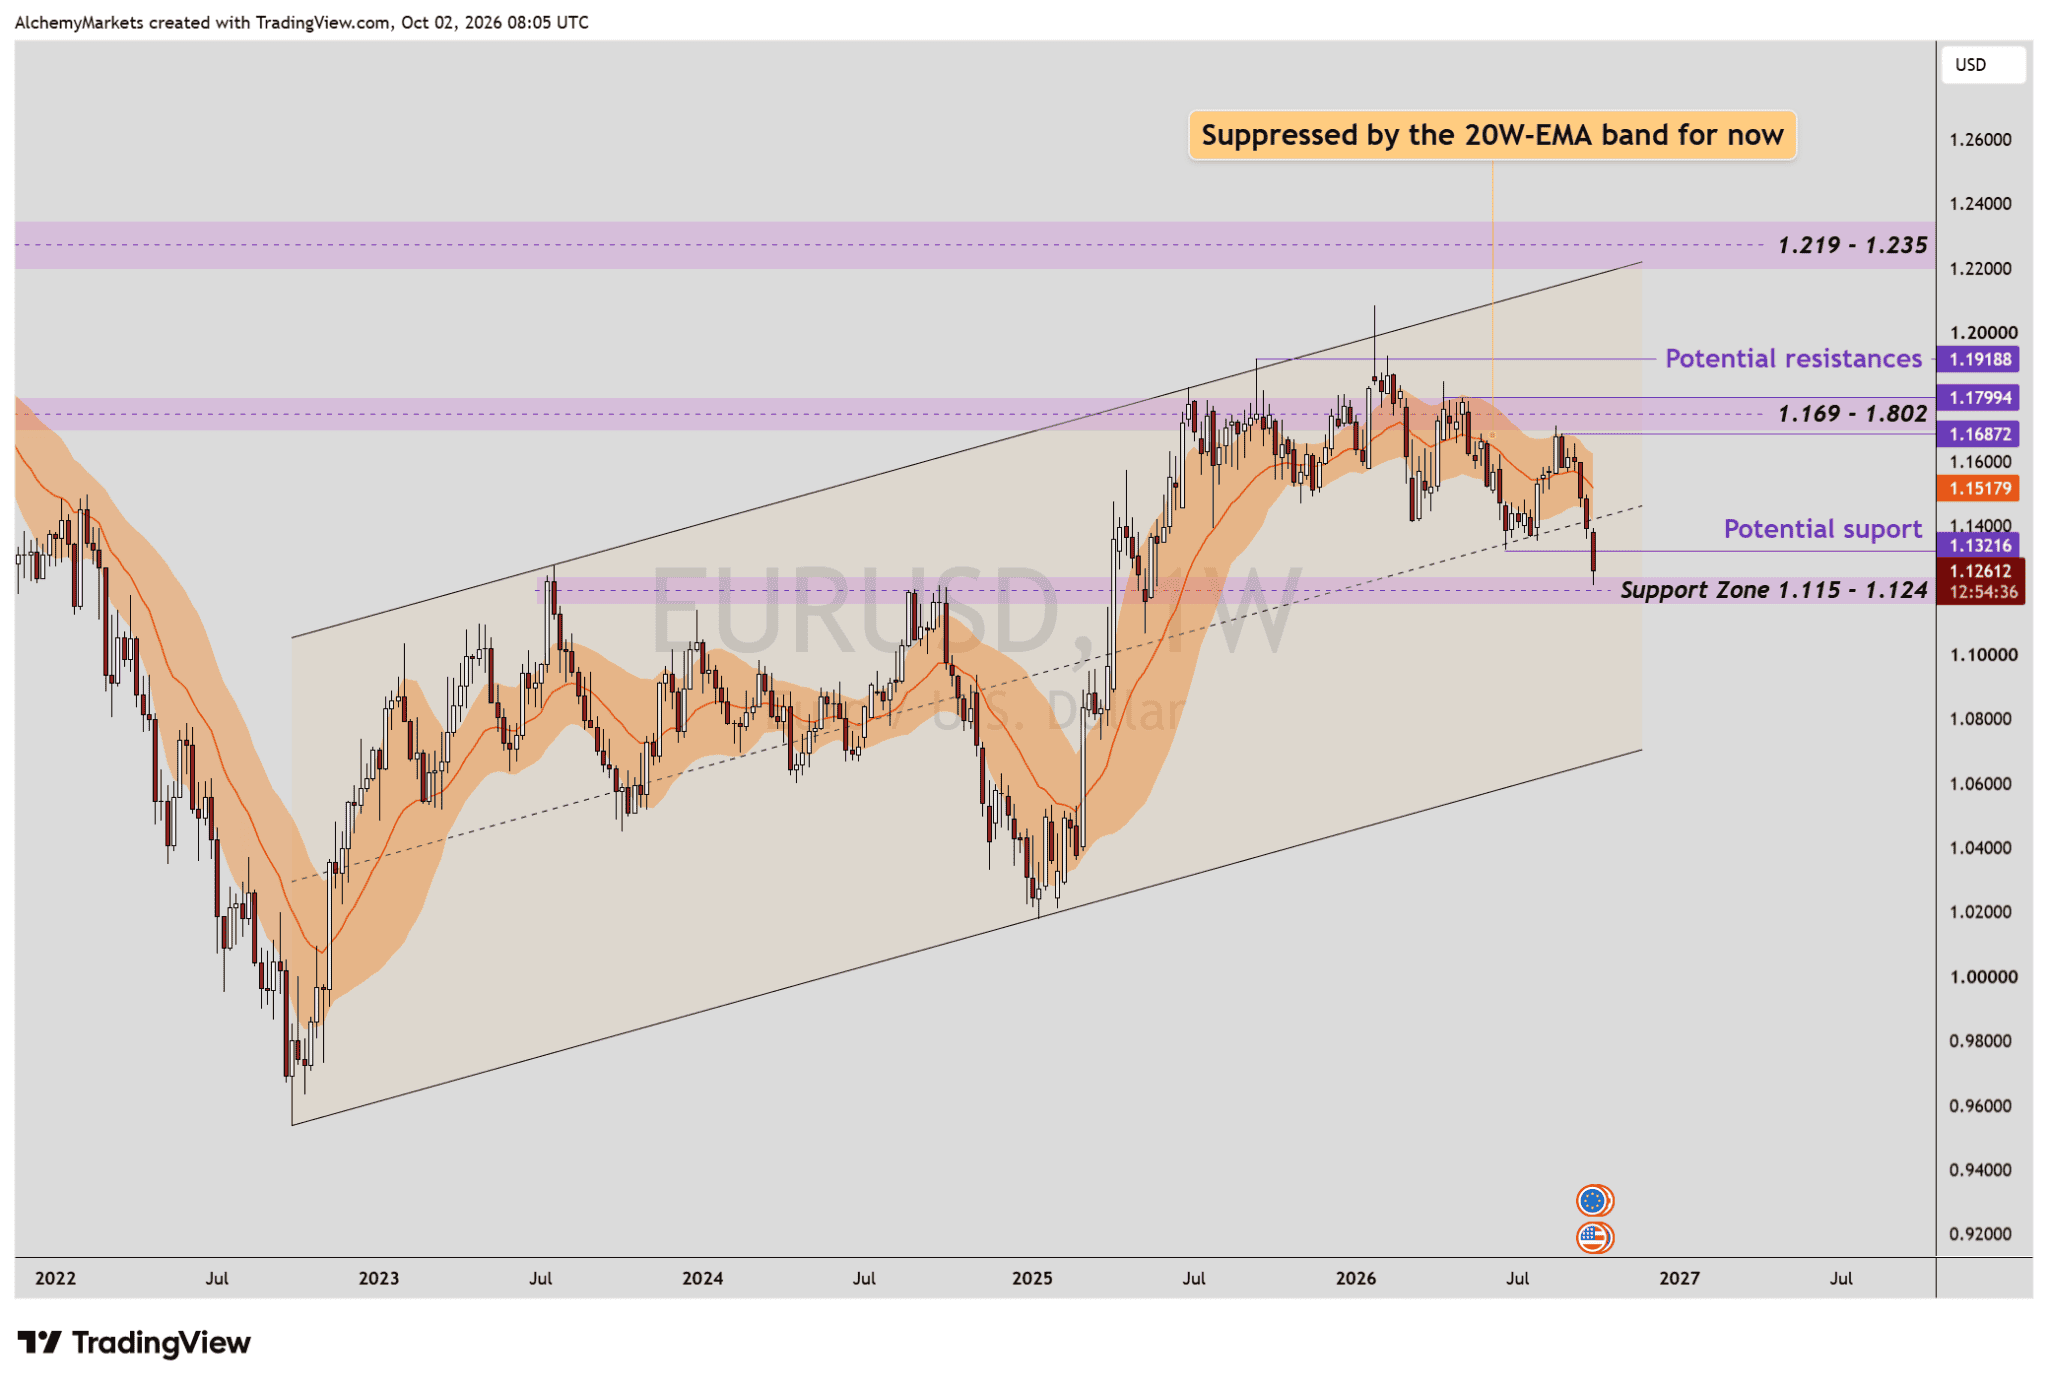
| EURUSD weekly. Price is approaching support, but the 20-week EMA band is still suppressing the pair. Chart: Alchemy Markets / TradingView. |
EURUSD looks more dependent on DXY rolling over.
Euro-area inflation has picked up, although much of the pressure is energy-led. Tighter ECB policy can support the rate side without giving the euro a clean growth story.
Heading into Q4, EURGBP offers a clear comparison of rate conditions between both regions.
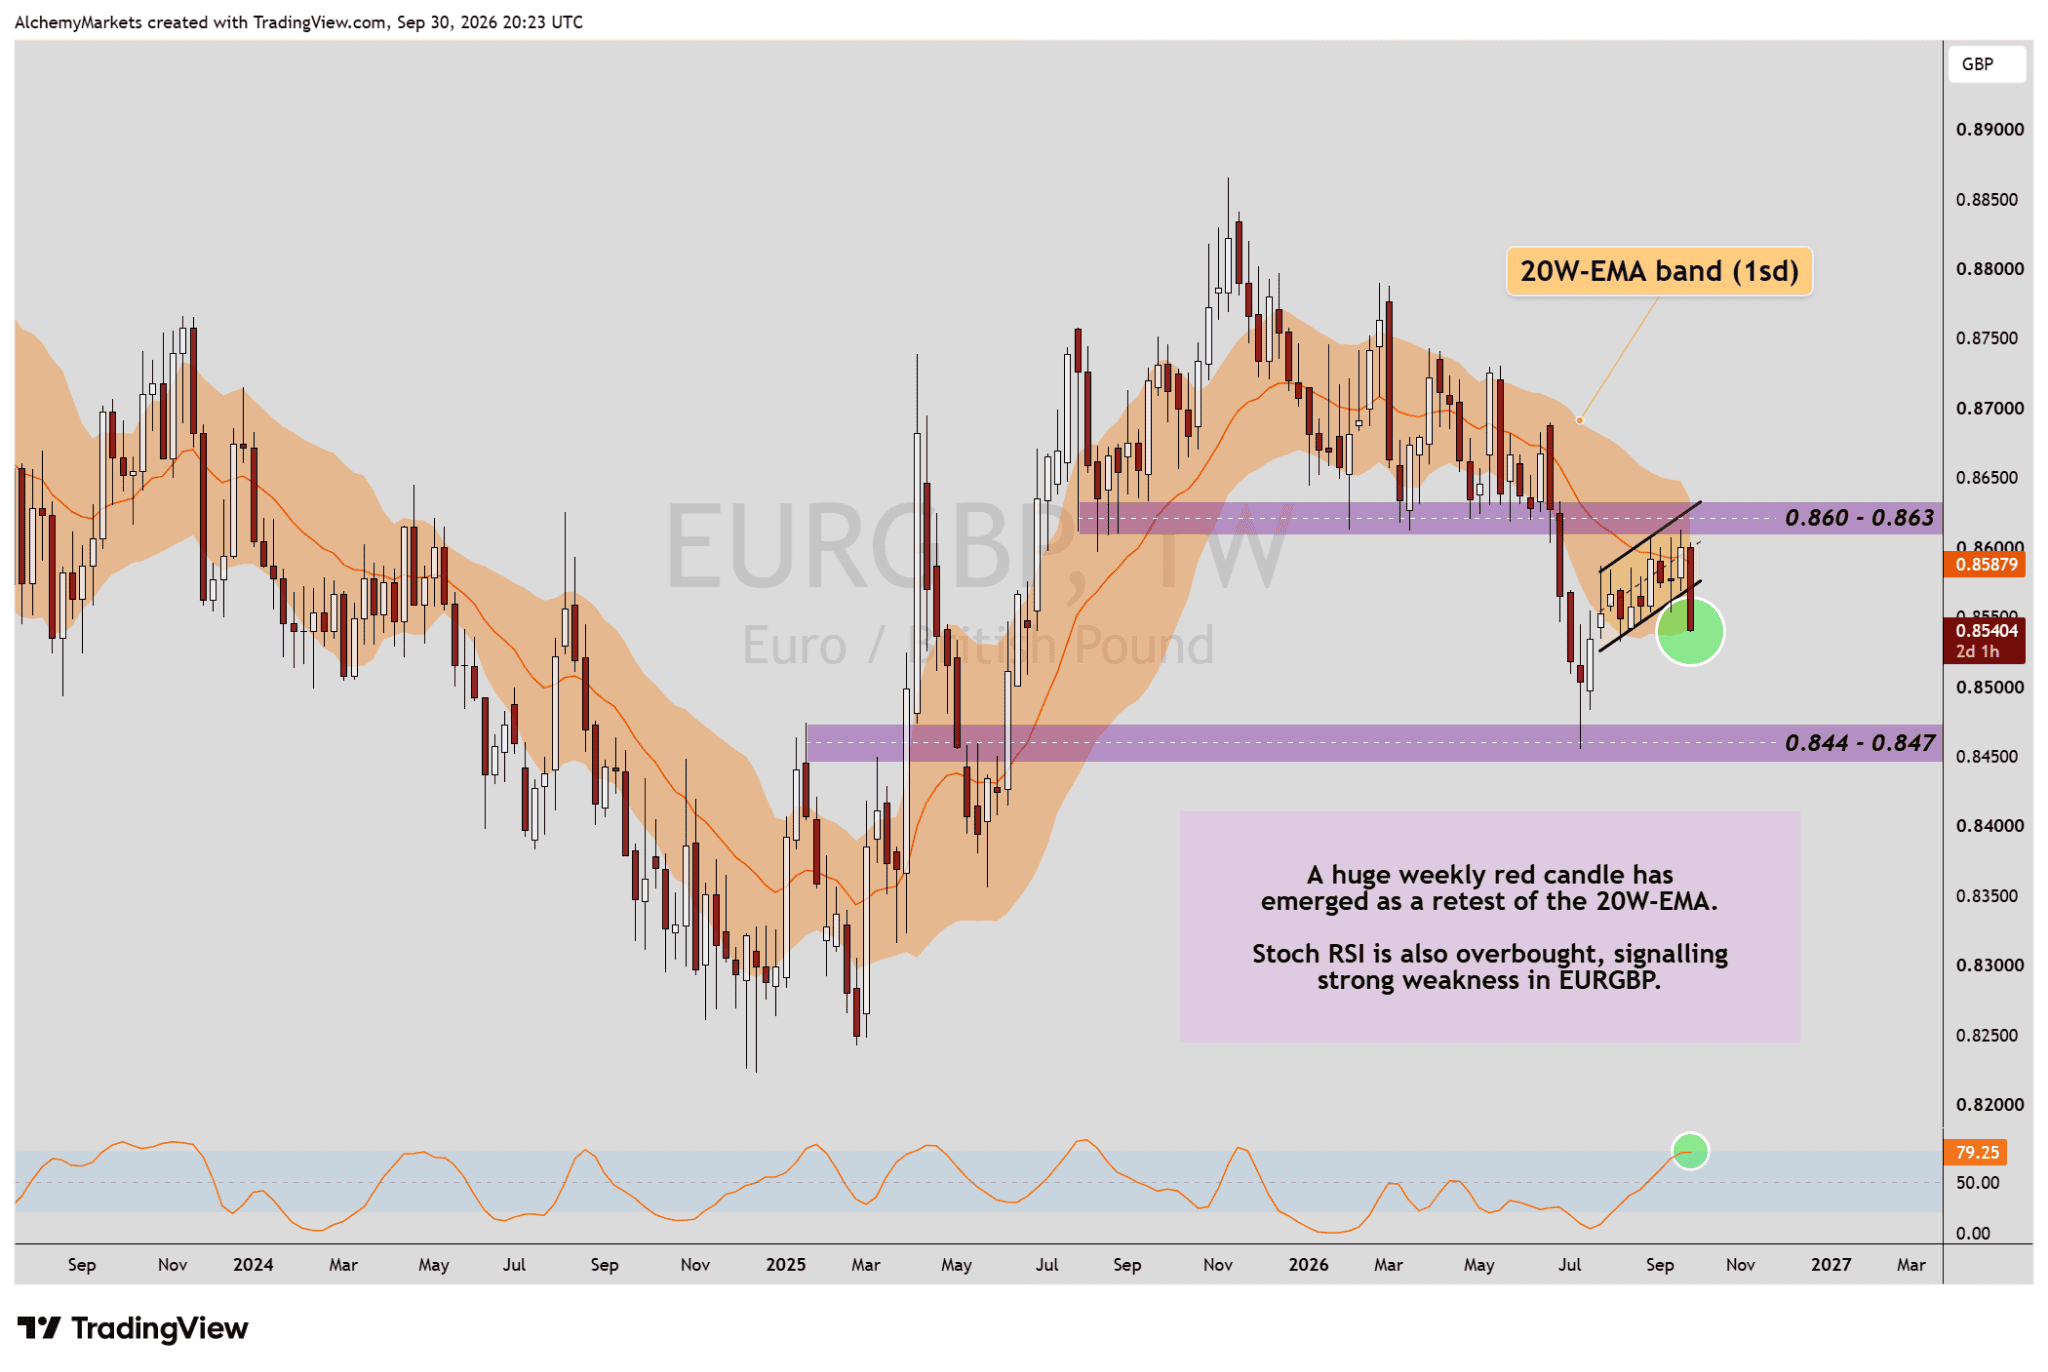
| EURGBP. The pair remains suppressed beneath the 20-week EMA band. Unless 0.860 to 0.863 and then the upper side of the band around 0.865 are reclaimed, sterling still looks relatively stronger than the euro. Chart: Alchemy Markets / TradingView. |
EURGBP could stay under pressure in Q4 as the rate story starts to lean back in favour of GBP.
The European Central Bank may be close to the end of its hiking cycle, with policymakers likely to become more cautious as tighter financial conditions do more of the work.
The UK looks different: inflation remains sticky, growth has held up better than expected, and markets are starting to price more Bank of England tightening again. If that divergence continues, sterling should keep the relative yield advantage, which would favour further EURGBP downside.
USDCAD Keeps the Dollar Case Alive
USDCAD is the awkward one. If the broader dollar is supposed to weaken, this pair still has not agreed.
USDCAD remains in a broader uptrend. The US still has a large rate advantage over Canada, while the loonie has not received enough help from domestic growth to overpower the dollar.
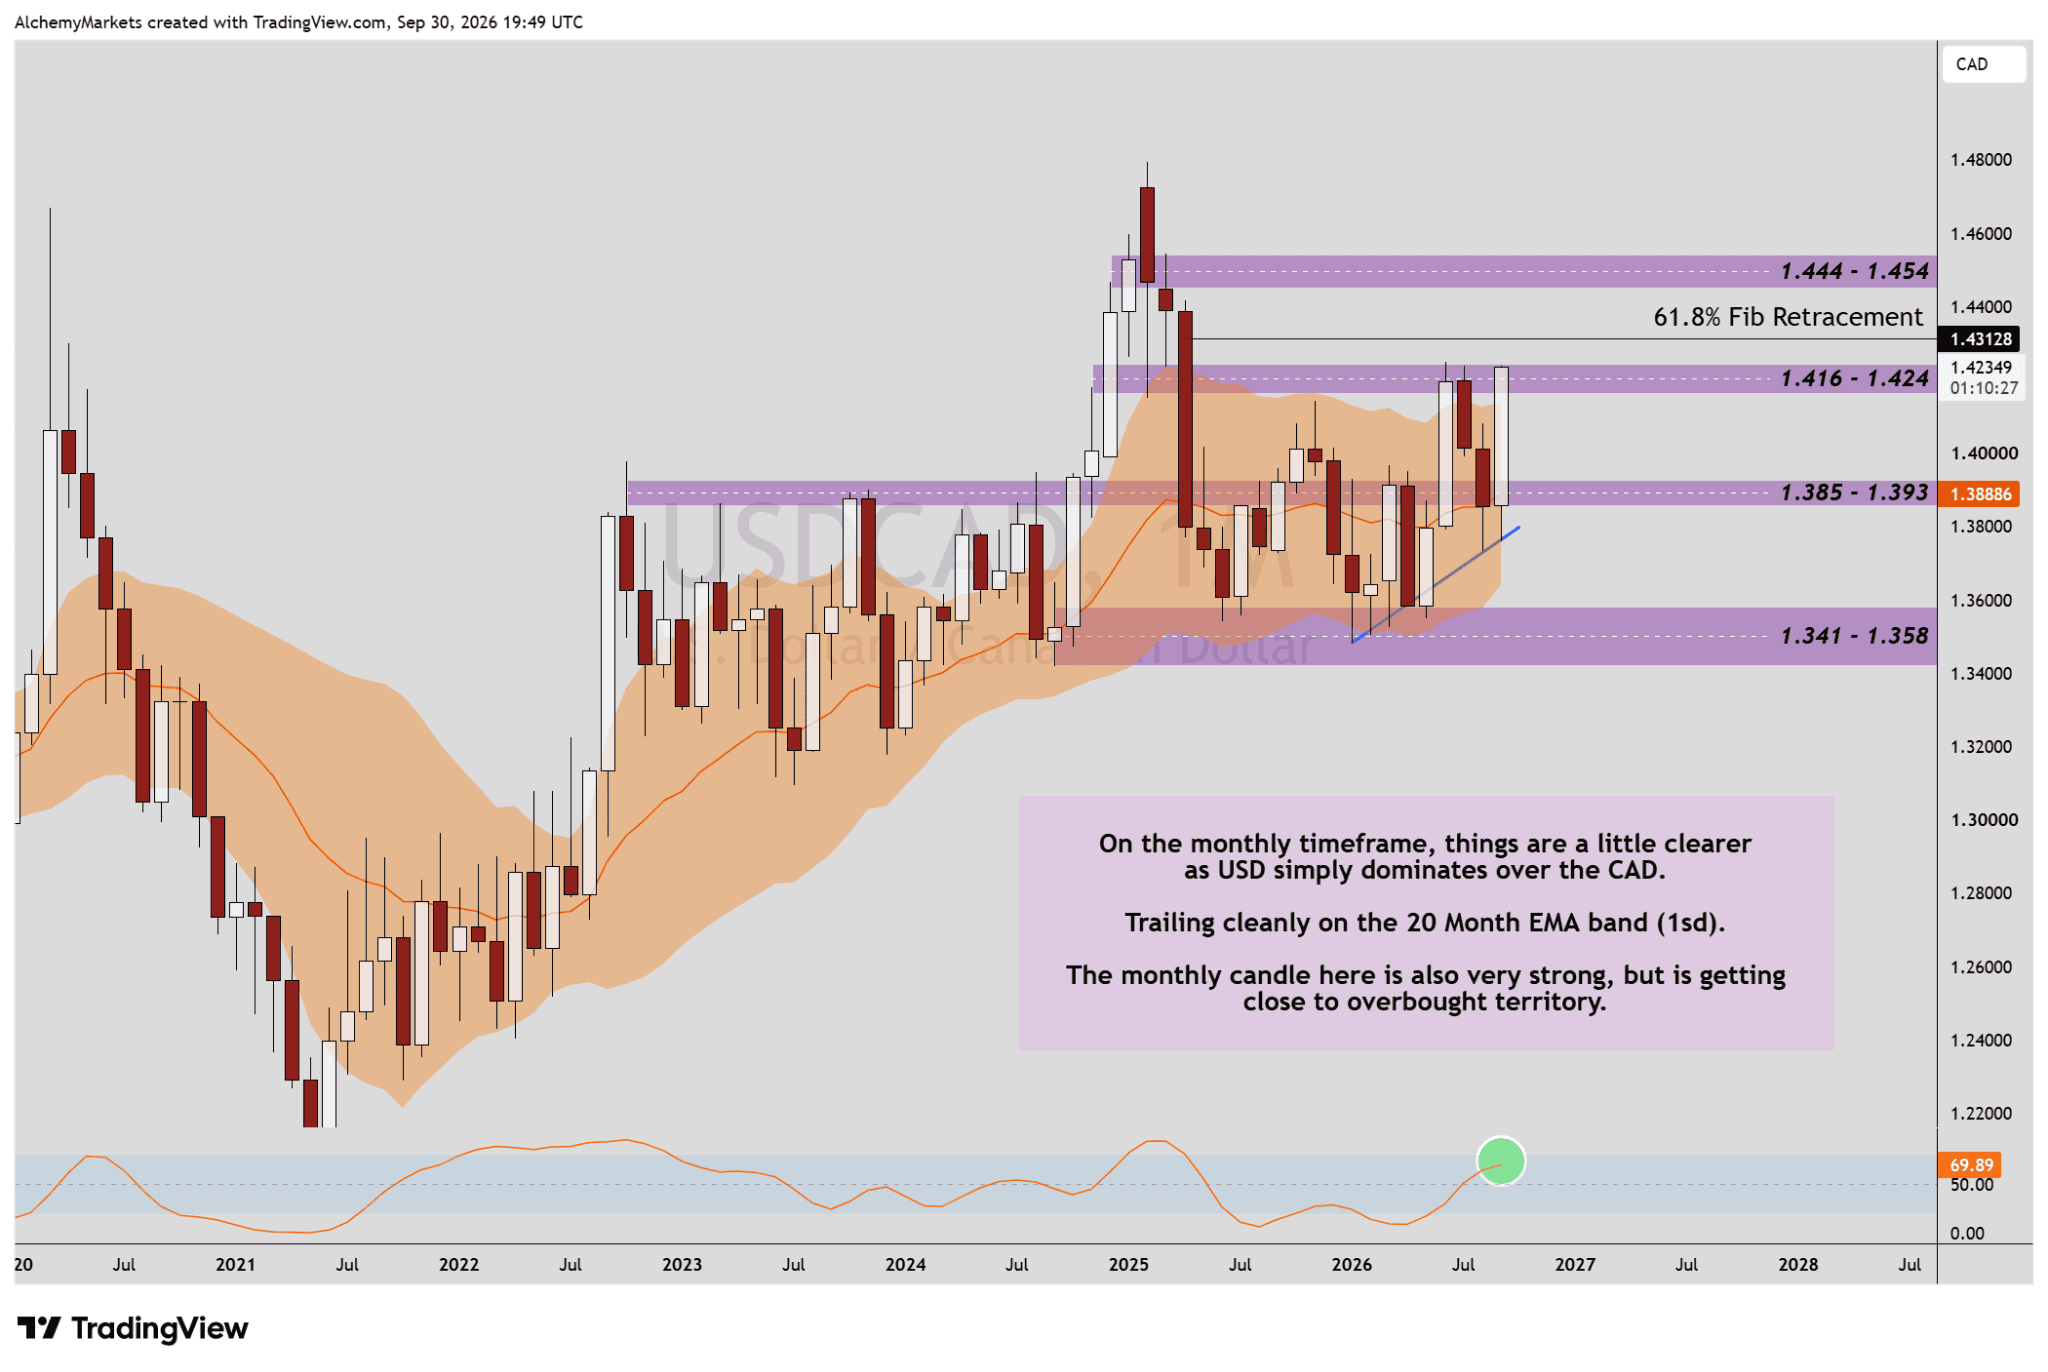
| USDCAD monthly. The broader USD trend is still intact, although the pair is moving into an important resistance area. Chart: Alchemy Markets / TradingView. |
Oil keeps the pair messy. Higher prices can improve Canada’s terms of trade, while the same move can keep US inflation and yields elevated.
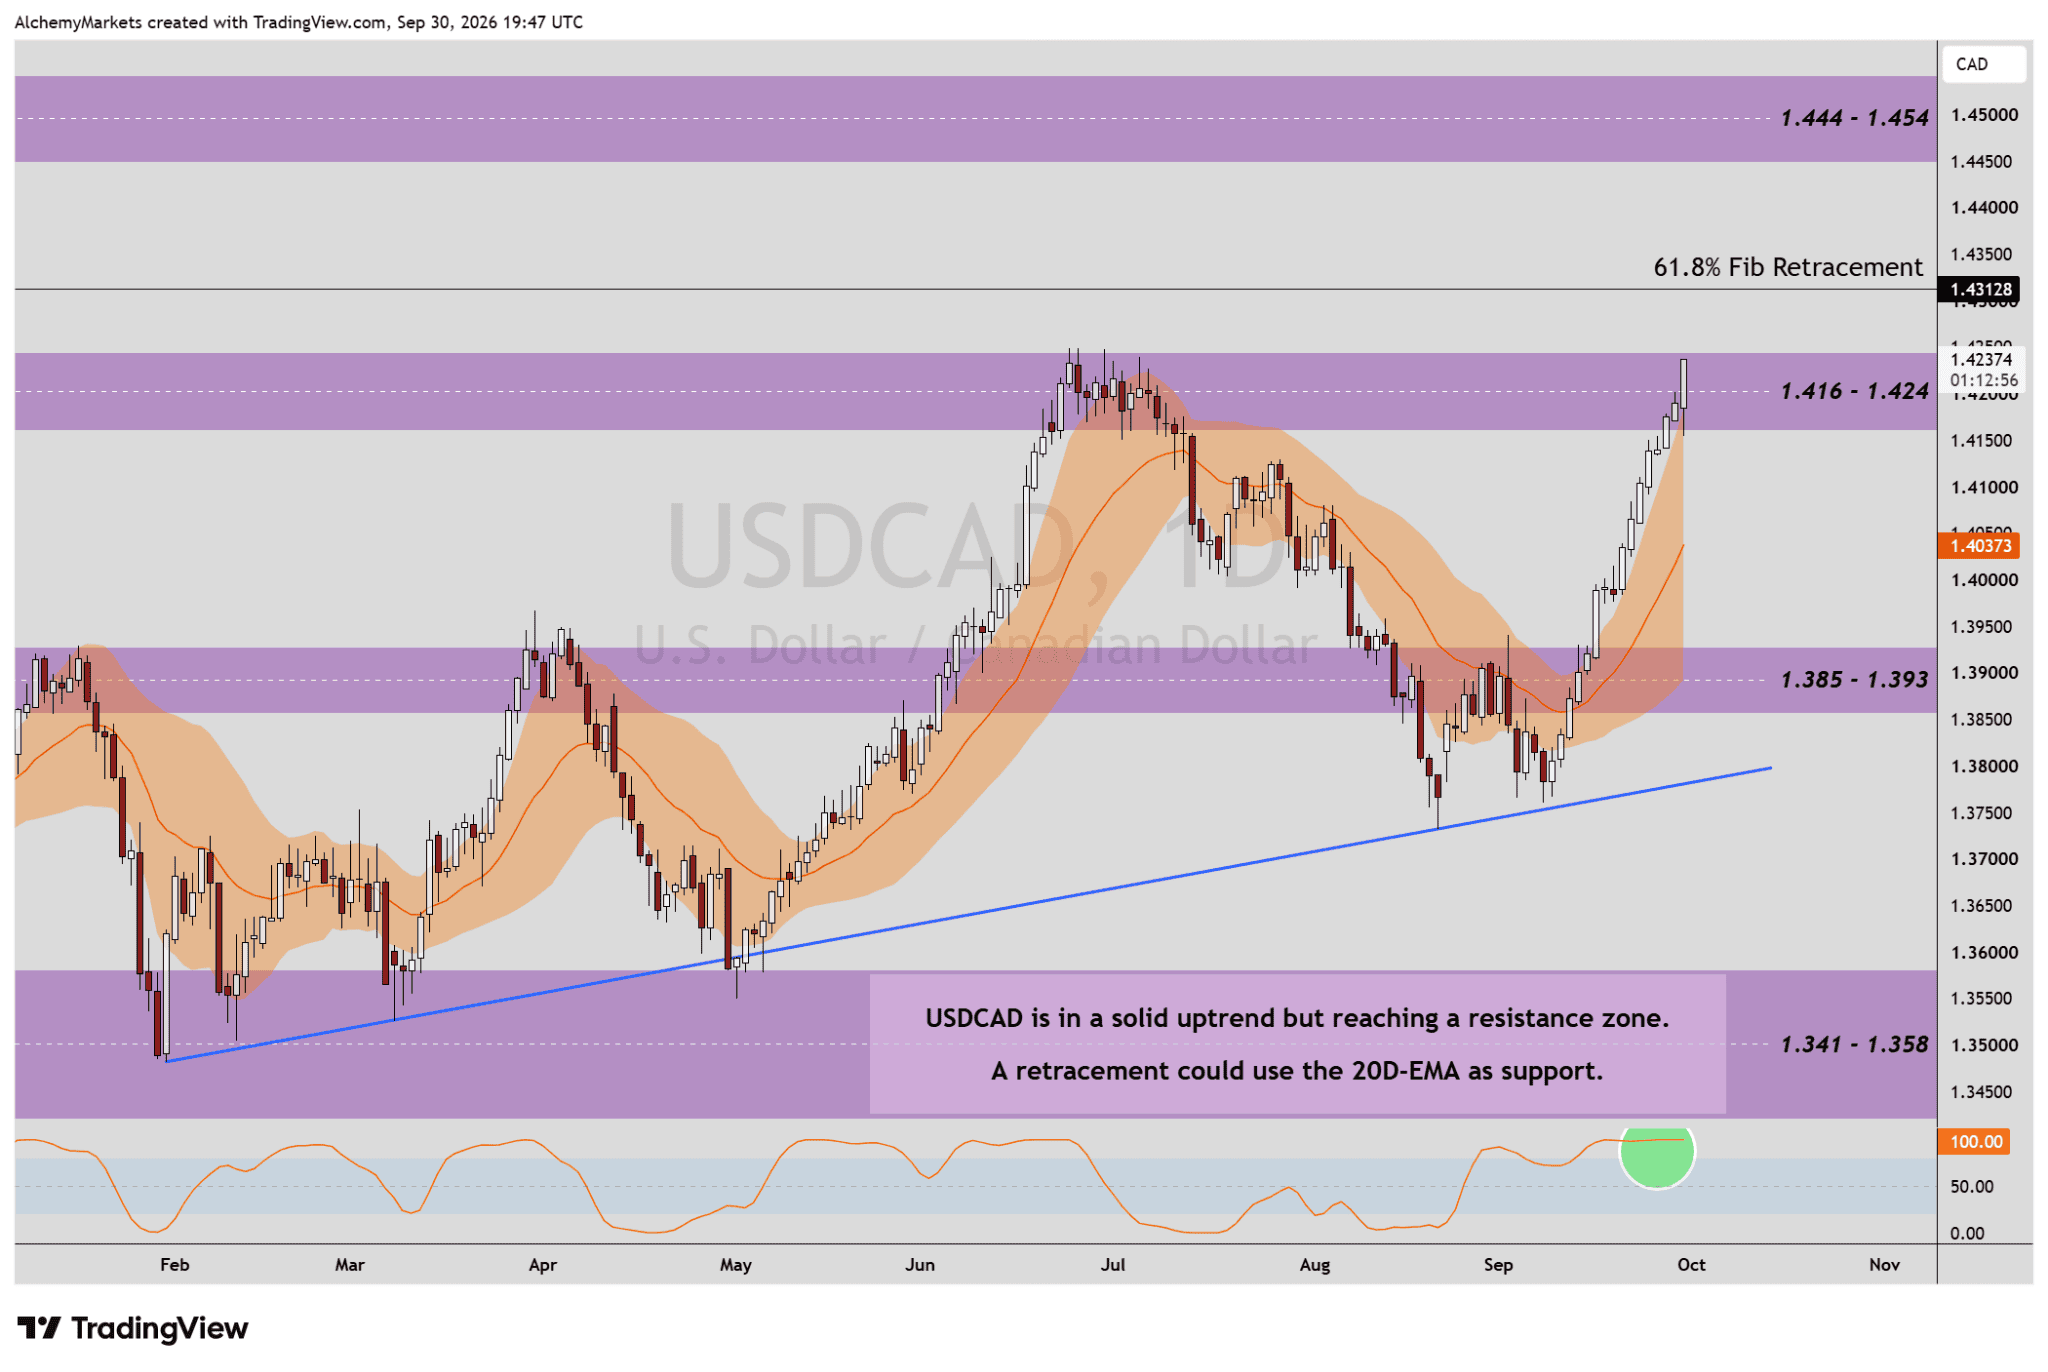
| USDCAD daily. The 20-day band is wide, and several 2026 breaks have turned into sideways bases rather than clean reversals. A single band break is not enough here. Chart: Alchemy Markets / TradingView. |
Losing 1.416 would be the first warning. A failed band reclaim would matter more than the initial break. If the uptrend survives, 1.444 to 1.454 remains the major weekly resistance zone.
USDCHF Pits Carry Against Safe-Haven Demand
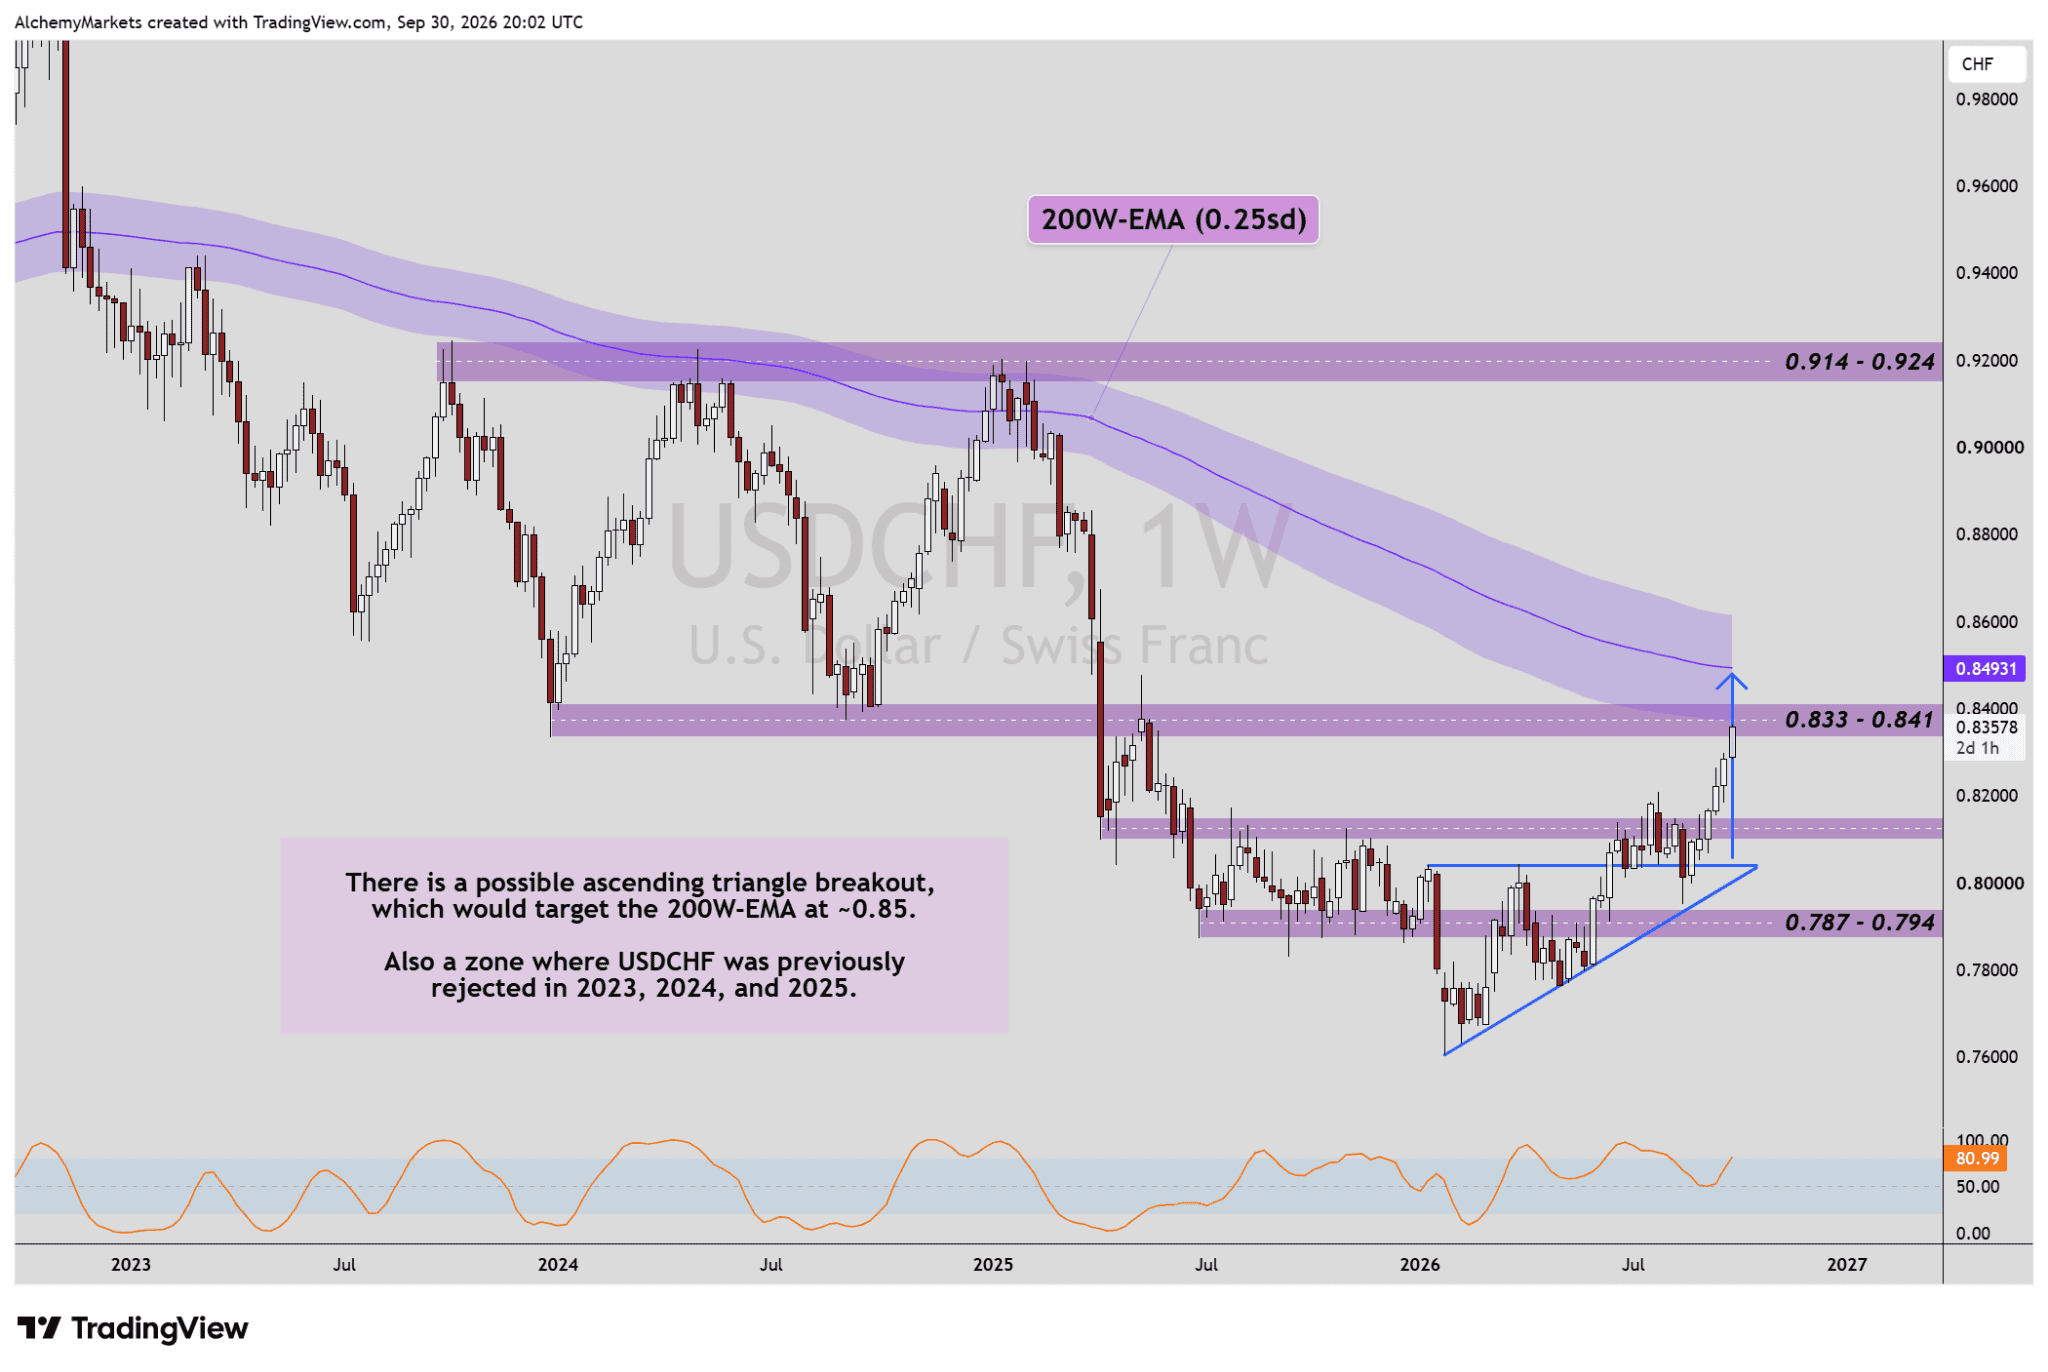
| USDCHF weekly. The pair is trying to build higher, but the long-term 200-week EMA remains an important overhead test. Chart: Alchemy Markets / TradingView. |
Switzerland still offers very little yield support relative to the US, which helps USDCHF when carry is driving the move.
CHF is the better cross-check if risk stress starts to take over. In a genuine liquidity event, the franc can strengthen even without a better yield story.
Q4 FX Playbook
| Market | Current read | What confirms it | What changes the view |
| DXY | Retracement bias, trend still up | 4H opposite-side band break and failed retest | Break and hold above 101.92 |
| USDJPY | Best reversal setup | Another weekly break lower | Reclaim and trail above the 20W band |
| AUDUSD | Rangebound, constructive near support | Momentum turns while 50W structure holds | Break below 0.683 |
| AUDNZD | AUD still leads | 20W band holds on pullback | Opposite-side weekly break |
| NZDUSD | Weak until breakout | 0.603 plus 200W break | 0.551 fails |
| GBPUSD | Interesting at support | Reclaim short-term structure while EURGBP stays weak | Support fails or EURGBP clears 0.865 |
| EURUSD | Rebound candidate | Support holds, then 20W band reclaimed | 1.115 fails |
| USDCAD | USD trend still intact | Band/base survives | Lose 1.416, then fail to reclaim the band |
| USDCHF | Carry supports USD | Breakout holds | Risk stress plus failed breakout |
What Changes the Q4 Bias
The working view remains a softer, more sideways dollar rather than a clean dollar bear market.
DXY losing the 4H band is the first confirmation. The move becomes more convincing if US02Y is rolling over at the same time. USDJPY already gives the best early signal because its weekly behaviour has changed.
If labour and growth keep another Fed hike alive, and DXY clears resistance without losing its band structure, the existing dollar trend still wins.
The long end is the wildcard. Yields can stay high even with a softer dollar because Treasury supply and global duration pressure do not disappear when the Fed becomes less aggressive.
For now, the yen is furthest along, while AUD has the cleaner rate backdrop. USDCAD is still refusing to join the broader softer-dollar idea.
Going into Q4, DXY 4H and US02Y are the two charts I would keep open. If both roll over while USDJPY stays below its weekly band, the weaker-dollar case is behaving the way it should. If DXY clears resistance while front-end yields turn higher again, the call changes.