- Quarterly Forecast
- September 30, 2025
- 3 min read
Gold & Silver Need A Breather; Copper and Crude Oil in Q4 2025
Q4 Forecasts – What’s Included:
- Gold
- Silver
- Copper
- Crude Oil
Gold
Gold’s price has been advancing aggressively in the last month of Q3. There are a lot of fundamental backdrops that would support a continued advance for gold. However, market’s cannot move in straight lines for extended periods of time. As a result, a consolidation is likely in order in line with other key risk or US Dollar markets.
Key risk markets, like equities, may experience a rough patch in Q4. Likewise, US dollar may consolidate towards strength in Q4. These cross market analysis may provide a headwind for gold.
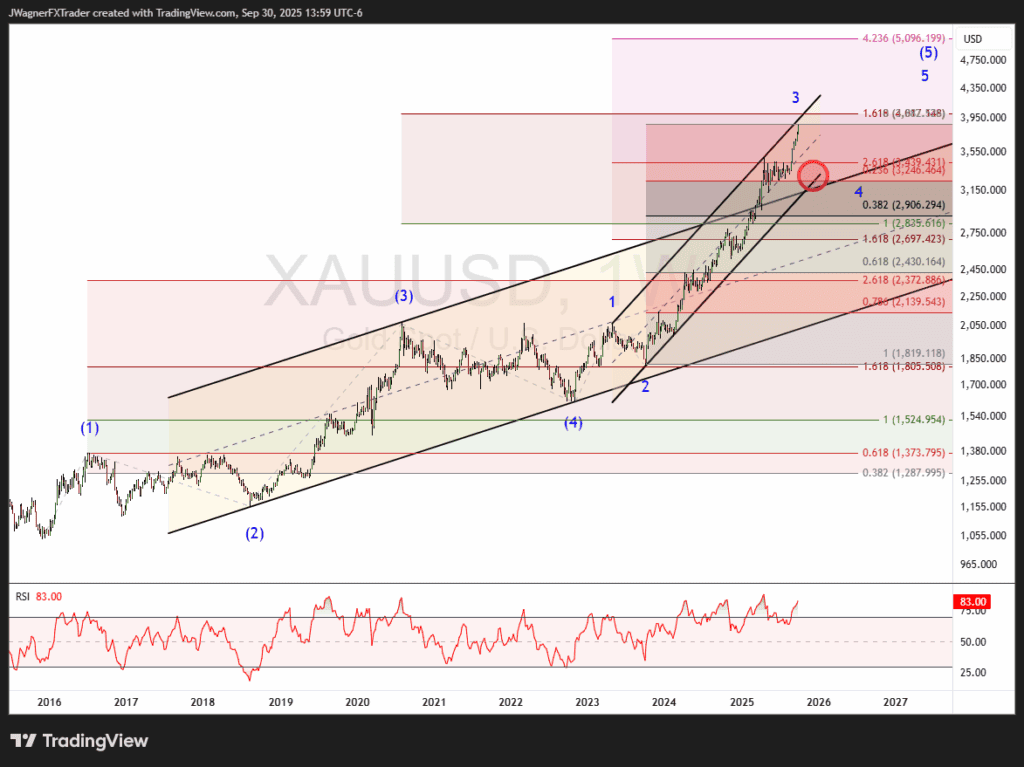
Analysing gold from an Elliott wave perspective, it appears to be completing wave 3 of (5). Gold prices are approaching the trend line connecting the May 2023 and April 2025 highs. At the time of the writing, the RSI line is slightly below the highest level coinciding with the April 2025 high building the potential for RSI divergence.
If gold prices do correct lower in wave 4 of (5), we anticipate support may emerge between 2,900 to 3,250 (red circle on chart above). Those levels coincide with previous fourth waves and are flanked by Fibonacci retracement ratios from wave 3.
Silver
Silver continues in rally as the Q3 forecast proved correct anticipating a rally to $42.
Now that silver prices have arrived and slightly surpassed $42, what is next?
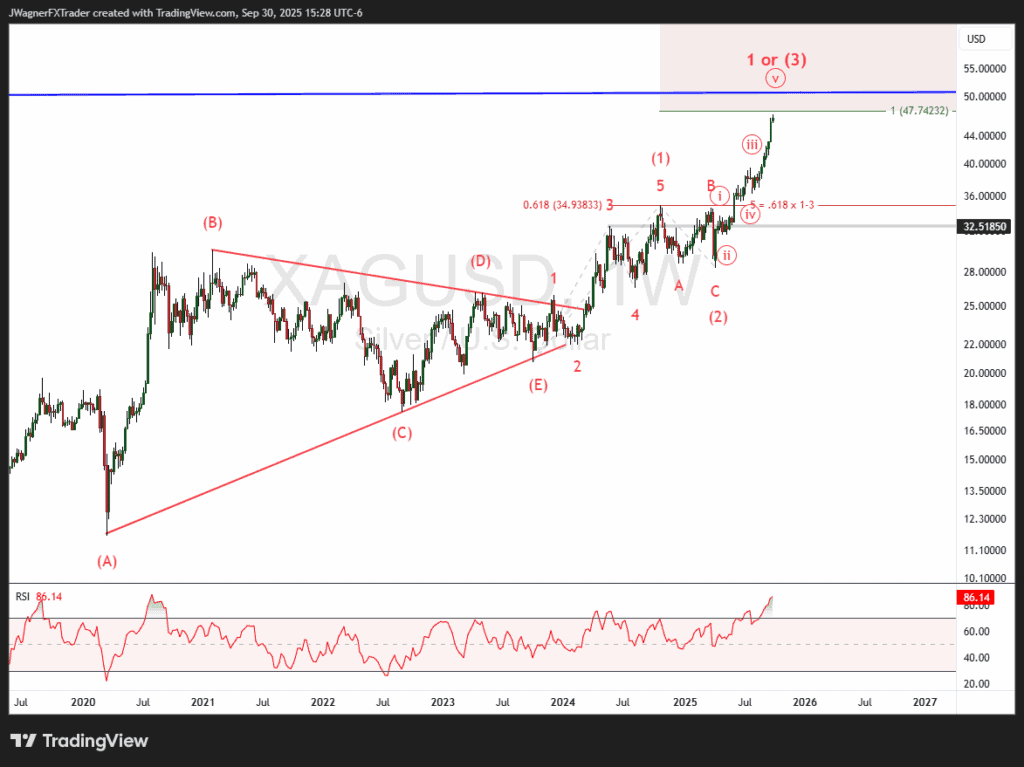
The Elliott wave count shows a multi-year ascending triangle pattern that was completed in October 2023. From that point, we want to count off a five-wave rally. It appears the first of those 5-waves completed October 2024.
The rally beginning April 2025 is either wave 1 of (3) or all of wave (3). Under both scenarios, the pattern is incomplete to the upside.
Resistance emerges near $50 when drawing a trend line from the highs of 1980 and 2011 (blue trend line). Additionally, wave relationships appear near $53.
Therefore, I suspect we’ll see a bearish reaction near these levels leading to a 15-20% decline. Once that decline is in place, then another strong rally is anticipated.
Copper
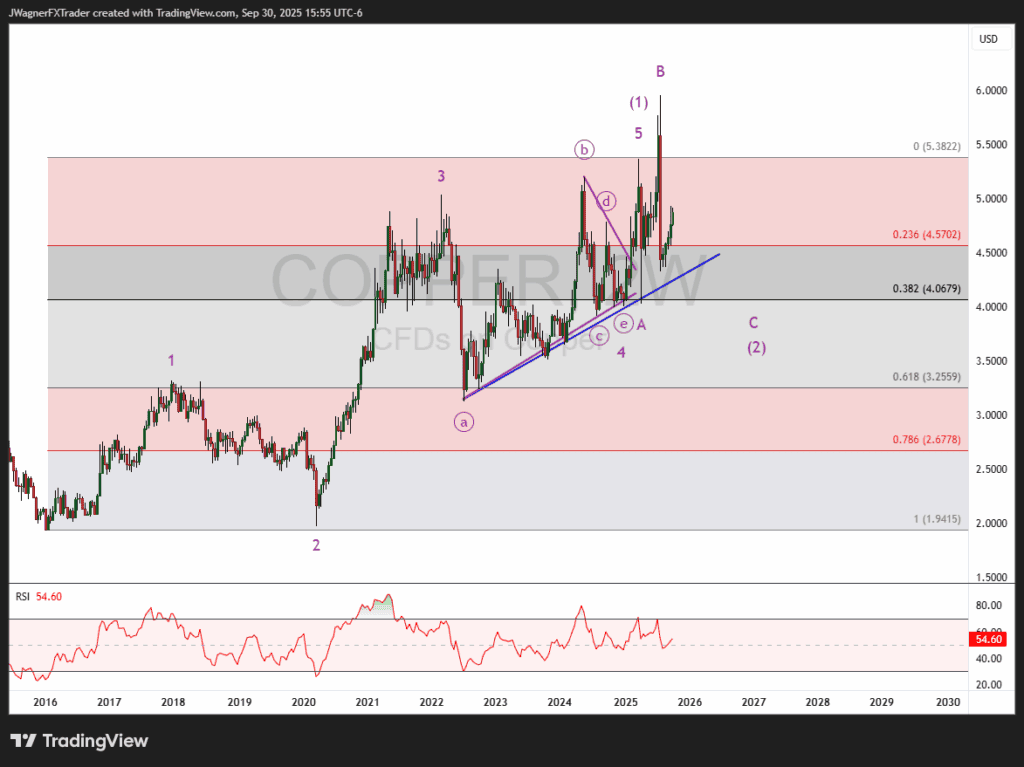
As quick as Copper rallied is as quick as it declined. Longer-term, I think inflation is here to stay so I would generally favor bullish prices.
However, they don’t call the metal Dr. Copper for no reason. Copper can often sniff out economic troubles before it shows up in equities.
Therefore, this recent weakness in copper may suggest continued declines down to the blue trend line and perhaps down to the 38% Fibonacci retracement level.
Once these lower levels are achieved, it is possible a more meaningful rally might develop.
Crude Oil
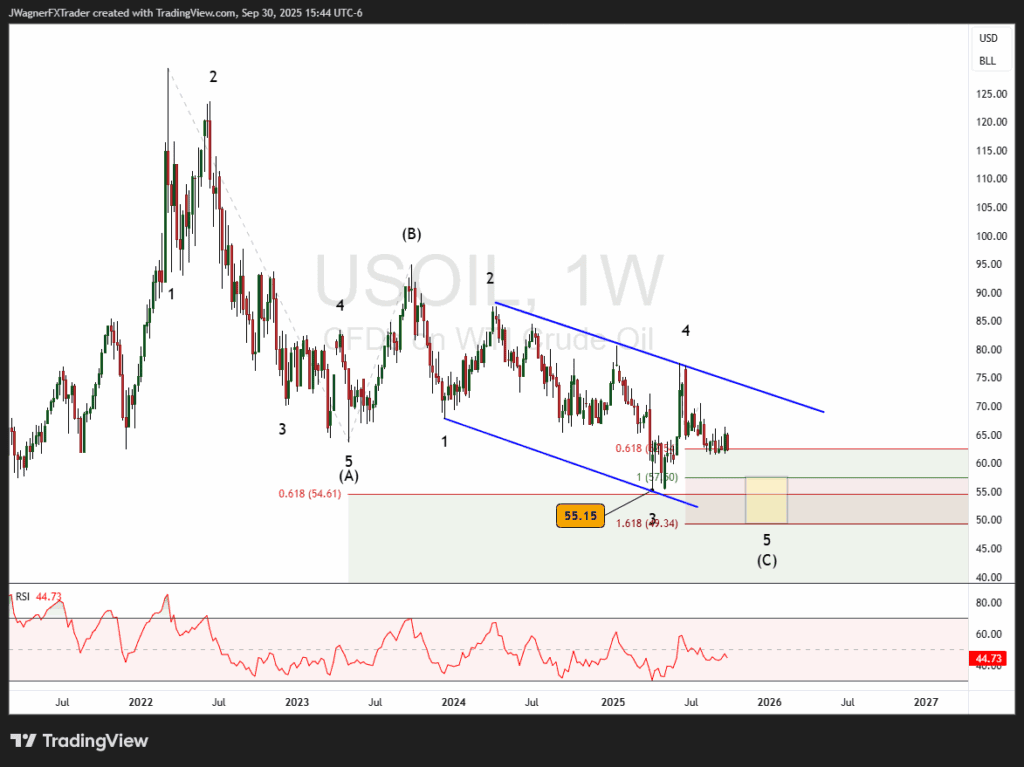
Crude oil has been no stranger to the roller coaster ride. The rally from the April 2025 low does not have the look of a motive pattern. Therefore, the odds of revisiting the $55 low is high.
The favored Elliott wave count I’m following is that the June 2025 high was wave 4 of an ending diagonal pattern. Ending diagonals take on the shape of a wedge pattern, in this case a falling wedge. Long-term, this would be a bullish pattern, but the ending diagonal appears incomplete to the downside.
I suspect we’ll see crude oil prices revisit $50-$57.50 (yellow box) to finalise the end to the diagonal pattern.
Therefore, any rallies that appear in Q4 are likely to be temporary and hold below the upper blue resistance trend line.
If crude oil is successful in reaching the yellow box, then we’ll see how mature the wave count is and if a large bullish reversal looms nearby.