- Opening Bell
- August 23, 2024
- 3 min read
To Cut or Not to Cut: Jerome Powell Speech Will Set Market Tone
Today marks the day where the markets will either be in exuberance for Fed Rate Cut, or be in for a nasty surprise. All will be revealed in Jerome Powell’s speech, here’s what to look out for…
Dovish Statements
Over the past 2 months, the Federal Reserve has been becoming increasingly more dovish with their tone and statements:
- The jobs market is stabilising.
- Inflation is cooling off.
- Growth has slowed substantially.
- Financial conditions have tightened sufficiently.
For bullish investors and traders, these are dovish statements you’d want to hear from Jerome Powell in today’s speech. They support the idea of issuing a rate cut.
Hawkish Statements
On the flip side, if you hear Chair Powell walk back on his previous statements, we may be in for some trouble. But that’s not all, here are the types of statements to look for:
- We await more data to make a decision.
- The economy is running hotter than expected.
- Inflation remains sticky.
Alternatively, a hint at a jumbo cut of 75 bps would shock/scare the markets. Statements such as the following could hint at such an action:
- Labour market is showing signs of significant weakening, with rising unemployment and declining job openings.
- Global economic risks have escalated, and spillover effects could drag down domestic growth.
- Economic data indicates a shaper-than-expected slowdown.
Fedwatch Tool and Today’s Speech
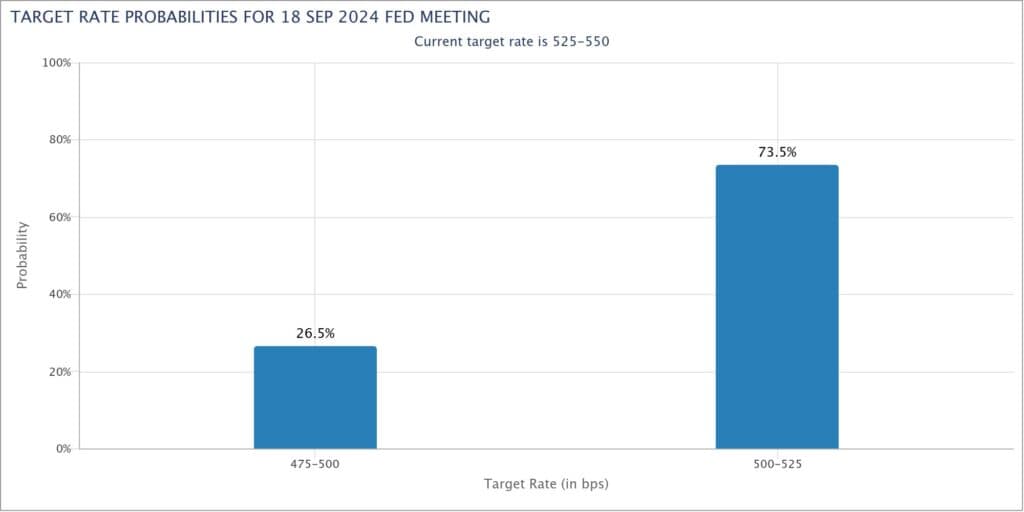
These statements would pose a significant shock to the markets, due to the market participants’ 100% expectation for a rate cut of at least 25 bps. As of today, the Fedwatch Tool shows a 73.5% expectation for a cut of 25bps, and a 26.5% expectation for a 50 bps rate cut in September.
Depending on how Jerome Powell’s speech goes today, these values could shift.
Source: CME Group
How the Price Charts Are Looking
In general, the markets seem to be correcting themselves in anticipation of this Fed Speech.
S&P 500 (US500) Price Chart
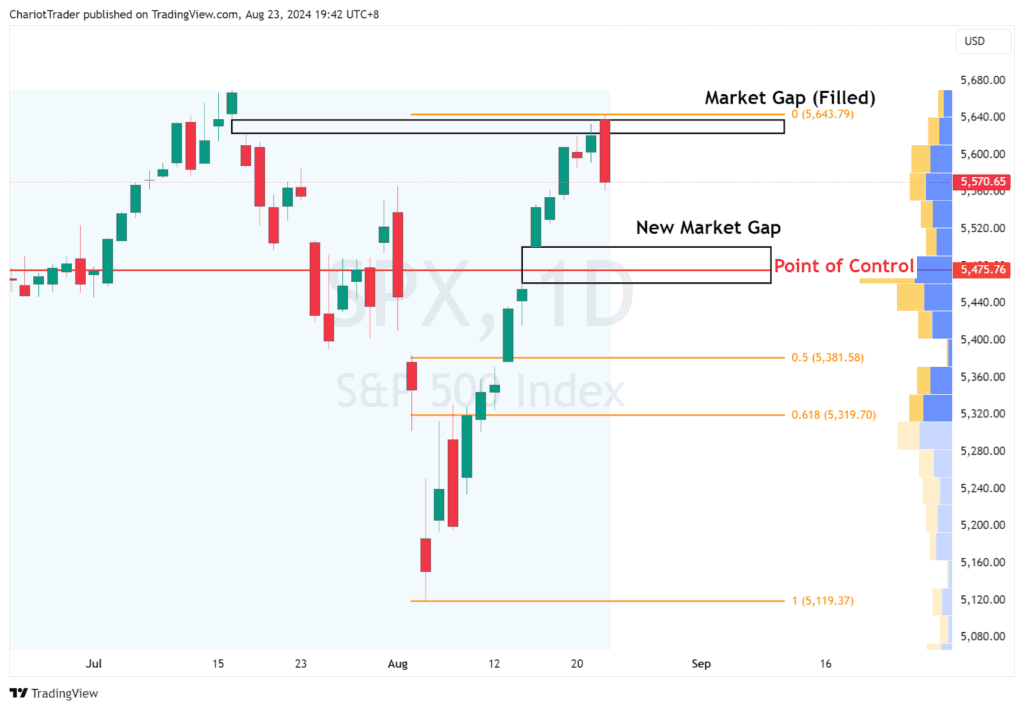
The S&P 500 has recently filled a market gap and formed a daily bearish engulfing candlestick.
If a push down does occur, there are several support levels to watch.
| Support Levels to Watch On S&P 500 New Market Gap: $5,463 – $5,501 Point of Control: $5,475.76 50% Fib Retracement: $5,381.58 61.8% Fib Retracement: $5,319.70 – Aligns with a horizontal support level |
Nasdaq 100 (USTEC) Price Chart
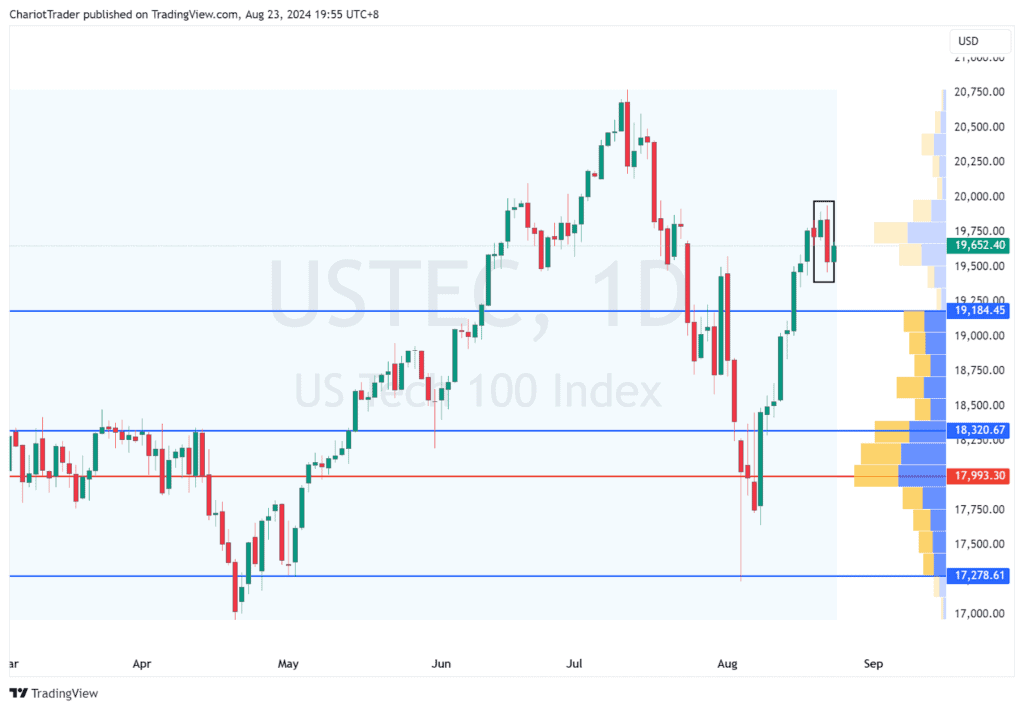
Similar to the S&P 500, the Nasdaq 100 has formed a bearish engulfing candle on the daily timeframe. However, it also formed a local higher high, hinting at a possible trend reversal.
If a push down occurs, these are the levels to watch.
| Support Levels to Watch On Nasdaq 100 Value Area High: $19,184.45 Psychological Level: $19,000.00 Support Level: $18,320.67 Point of Control: $17,993.30 |
Bitcoin (BTCUSDT) Price Chart
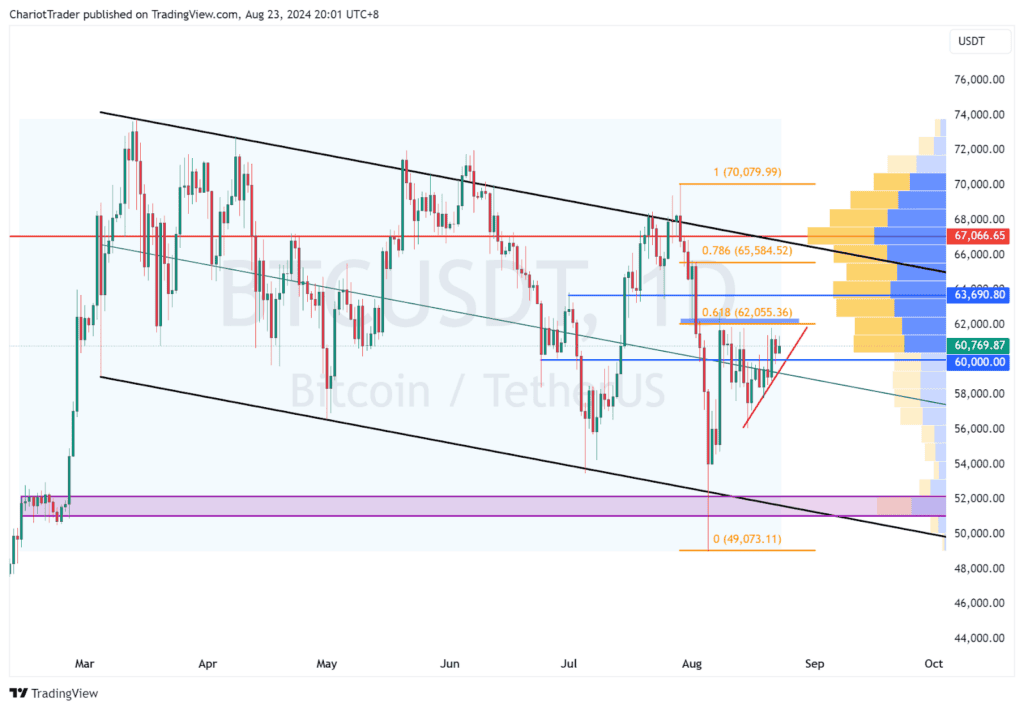
Bitcoin on the other hand, is not so simple. After touching the top of a descending channel, Bitcoin has fallen as low as 49,073.11, and is now currently seeing a grind up towards the 0.618 bearish retracement level. After initially rejecting once from the 0.618 level, Bitcoin has remained resilient and grinded up.
If a push up occurs, these are the levels to watch.
| Resistance Levels to Watch On Bitcoin 61.8% Fib Retracement: $62,055.36 Double Top Neckline: Approx. $63,690.80 78.6% Fib Retracement: $65,584.52 Point of Control: $67,066.65 |
| Support Level to Watch On Bitcoin Psychological Level: $60,000 Rising Trendline: Approx. $60,000 or higher Parallel Channel Middle Line: Approx. $59,200 – $59,000 (or lower) |
You may also be interested in:
From Peak to Plunge: USD/JPY Stares Down the Cliff (Elliott Wave)
Crude Awakening: UKOIL and USOIL Could Decline in Coming Weeks


