- Chart of the Day
- August 22, 2024
- 2min read
Crude Awakening: UKOIL and USOIL Could Decline in Coming Weeks
Economic uncertainty is in the air. With talks of a global reduction in demand, Brent Crude Oil (UKOIL) and WTI Crude (USOIL) have been spilling to the downside.
This price action comes despite an extended production cut by 3.66 million barrels per day, issued by the OPEC+, effective until the end of 2024.
A huge component of this downturn has to do with China, who has steadily reduced their crude oil imports in July 2024 from 10 million to 9.5 million barrels per day. This marks a sharp 5% decrease in imports, and only serves to worsen UKOIL and USOIL prices.
That being said, a reduction in oil prices is a welcome relief. As we head towards the end of the week, it’s important to keep an eye on how UKOIL and USOIL closes.
Technical Analysis on UKOIL and USOIL
UKOIL Analysis (August 22nd, 2024)

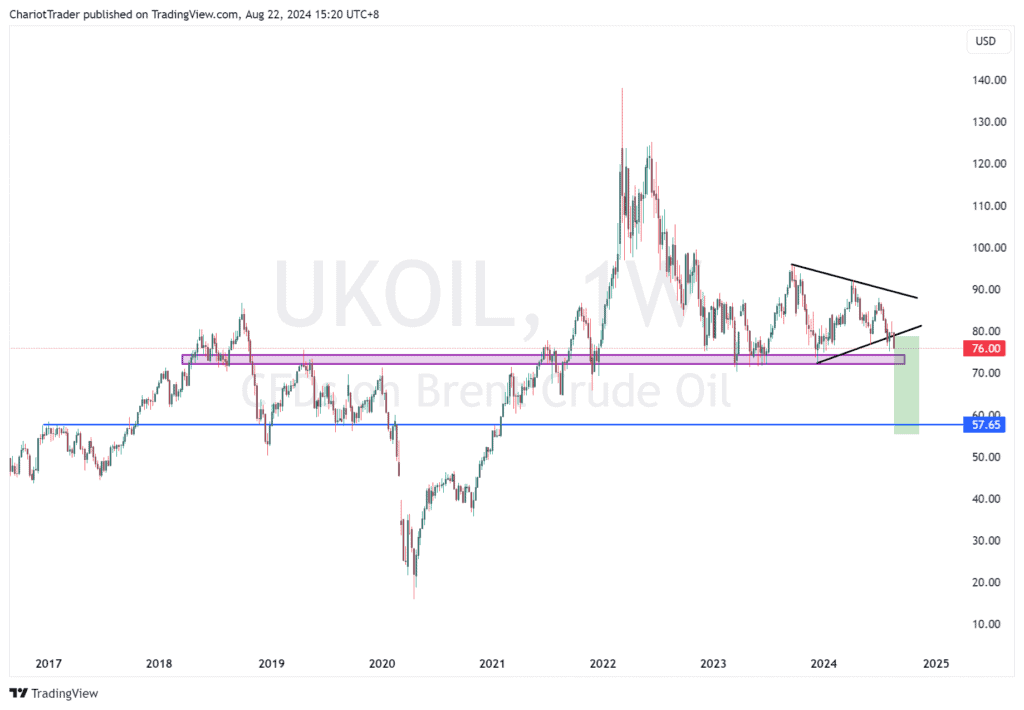
On the weekly timeframe, we can spot a Symmetry Triangle consolidation near a support level at approximately $72.00 – $74.00. More importantly however, is that the price has cut through the lower trendline of the triangle pattern and is currently threatening a candle close, confirming a bearish break down.
If the weekly candle does successfully close under the trendline, we could potentially see a move down towards $55.27, the measured move target. This aligns closely to $57.65, a minor support area on UKOIL from 2017.
| Support zones to watch on UKOIL are: • Purple box at approx. $72.00 – $74.30 • Blue line at approx. $57.65 • Measured Move Target at approx. $55.27 |
| Resistance zones to watch on UKOIL are: • Lower Trend Line of Weekly Triangle at approx. $80.00 |
USOIL Analysis (August 22nd, 2024)

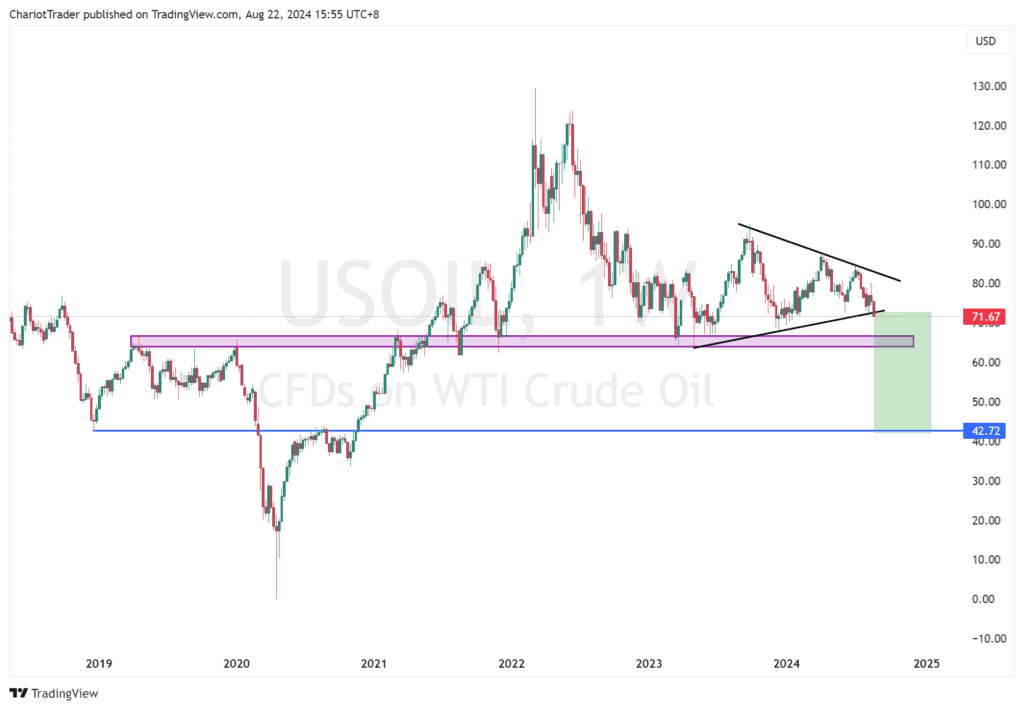
WTI, or USOIL, has a similar situation as the UKOIL. It is also currently threatening a weekly bearish close under a symmetry triangle pattern.
If the USOIL manages to close with a weekly bearish candle, we may see a price decline towards $42.72, which aligns clearly with a support level below.
| Support zones to watch on USOIL are: • Purple box at approx. $64.00 – $66.72 • Blue line at approx. $42.72 • Measured Move Target at approx. $42.00 |
| Resistance zones to watch on USOIL are: • Lower Trend Line of Weekly Triangle at approx. $72.90 |
You may also be interested in:
Shifting Sands: USD Faces Pressure Amid Key Data Releases
Canada Winning? USDCAD Could Fall as DXY Breaks Triangle Lower


