
- Opening Bell
- January 20, 2025
- 4 min read
Trump Inauguration: Market Impacts and What to Expect
The market expects volatility as Donald J. Trump will be sworn into the US Presidency at GMT 1:55PM, but will that really be the case?
The last time Donald Trump’s inauguration happened (on January 20th, 2017), the S&P 500, Dow Jones, Nasdaq, and Bitcoin all dipped slightly for a single day before dramatically rallying to the upside.
The exception to this was Gold, which rose for two days before falling by over 2.75% over the course of the next three days, reflecting the overall risk-on sentiment of the Trump’s previous inauguration.
Given this historical data, how likely is the same price action going to occur in the short term with Trump’s inauguration ceremony?
Will Trump’s 2017 Inauguration Move Return?
When Trump was officially inaugurated in 2017, the following happened: dollar down, gold down, S&P 500 up, and Bitcoin up. Other US-based indices in general also saw a rise, such as the Dow Jones and Nasdaq 100.
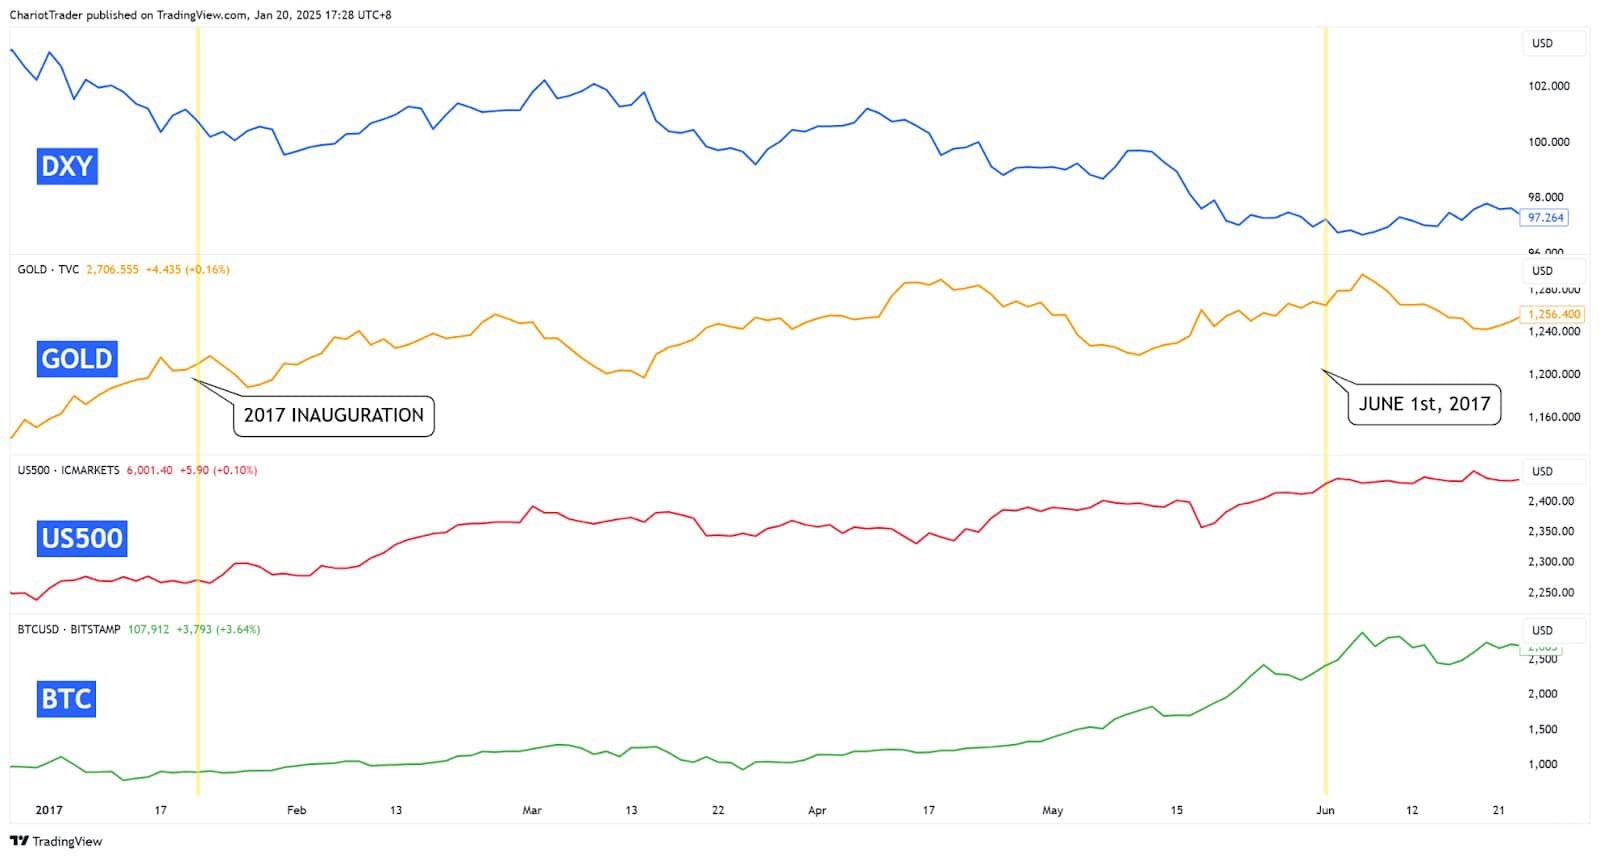
So will the same pattern of movements be likely? In the short term, it’s difficult to tell.
Trump’s tariffs, pro-business policies, and favouring of deregulation all point towards increased inflationary pressures, weakening the dollar. However, several concerning factors may lead to differing price action.
In 2017, inflation was relatively subdued, and the Federal Reserve had only just started to gradually increase interest rates. Today, inflation is a more pressing concern, and the Fed has opted for a ‘wait-and-see’, hawkish approach since December – as inflation is rearing its ugly head and proving to be sticky.
It is also under contention what kind of effects the Tariffs will have, as they can be a bargaining tool to get other countries to lower their import taxes on American Goods, effectively boosting sales on US exports.
The good news is – The market tends to consolidate after the inauguration, giving us ample time to conduct technical analysis and plan for the next swing trade.
Volatility Ahead, But When?
Examining the previous price action of the S&P 500 following the inauguration of previous presidents, we noticed that price action tends to be rather tame on the first two days of the inauguration — this is true for Trump’s previous inauguration in 2017.
However, price action begins to pick up momentum by day 3 and onwards, producing larger price ranges in a single day. From there, a consolidation period tends to form until a significant breakout occurs in the direction of the prevailing trend.
Our mid-term bias to the upside, but markets could remain choppy until a clear direction is indicated on the chart.
What to Look For: Technical Factors
We’ve established that our mid-term bias is to the upside, while our short term bias is for a consolidation to occur.
With this in mind, observing the following technical factors could be key to trading the next major swing:
- Mark out major highs and lows in the consolidation.
- Find divergences to further enhance your bias, and also help with timing your entries.
- Look for the presence of chart patterns, which further assist with timing and entries.
Price Action Study: S&P 500 and Past US Inaugurations
Biden, 2021 (Democrat)
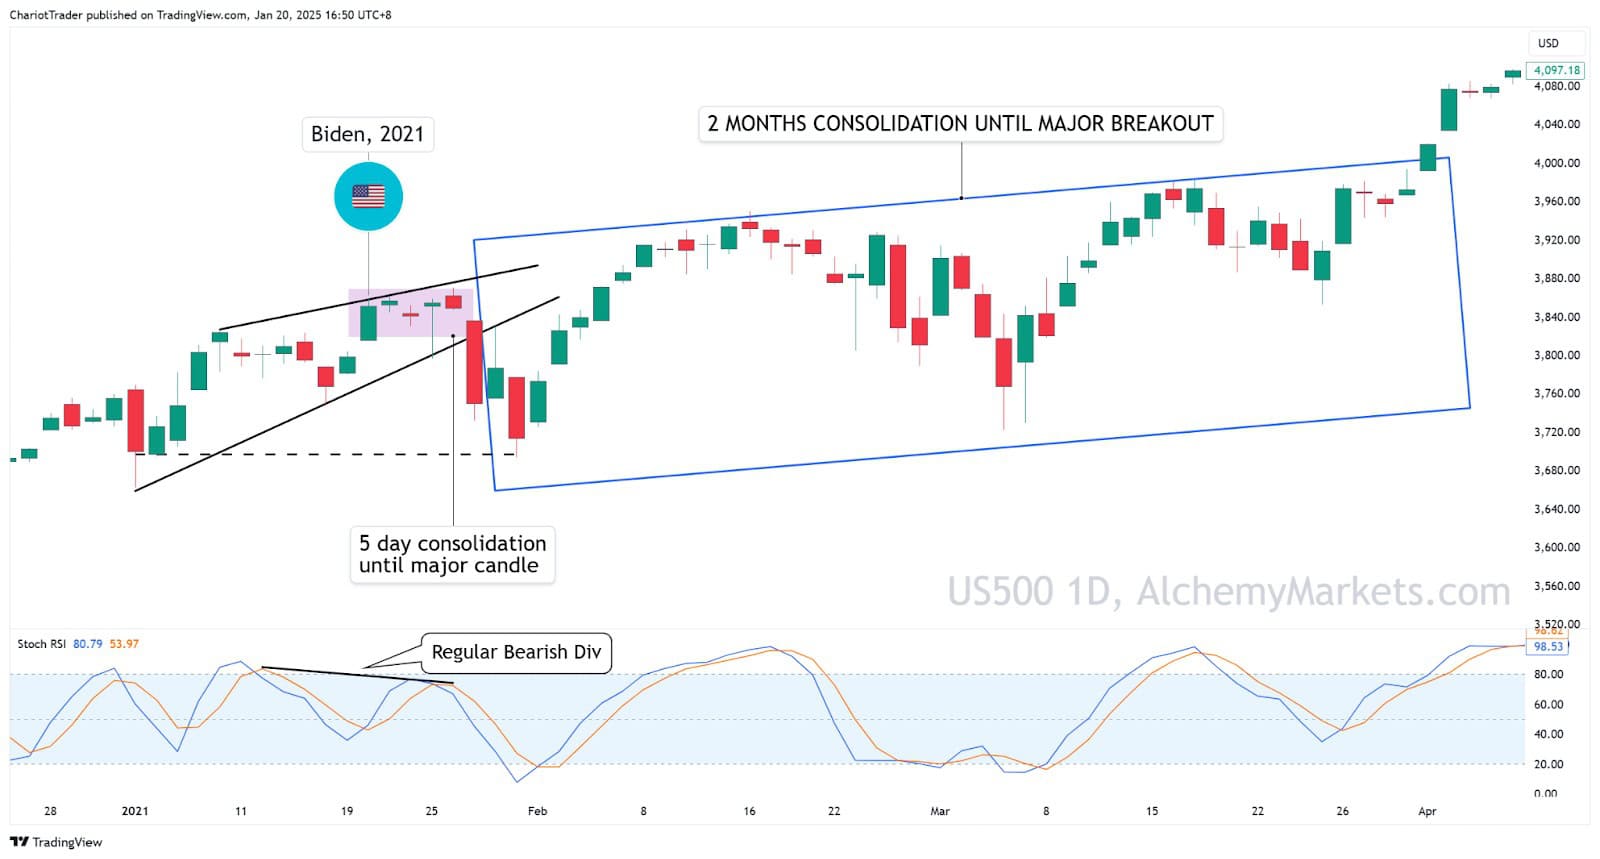
During Joe Biden’s inauguration, the S&P 500 initially gapped up and closed with a gain of over 1.40%.
Then, a 5-day consolidation period occurs within a broader rising wedge pattern, eventually breaking down and moving ~3.00% towards the rising wedge’s lowest closing price.
Other keynotes:
- Notably, the bearish candlestick formed with the presence of a regular bearish divergence.
- S&P 500 recovers from the drop, but consolidates for another 2 months+ before a significant rally.
Trump, 2017 (Republican)
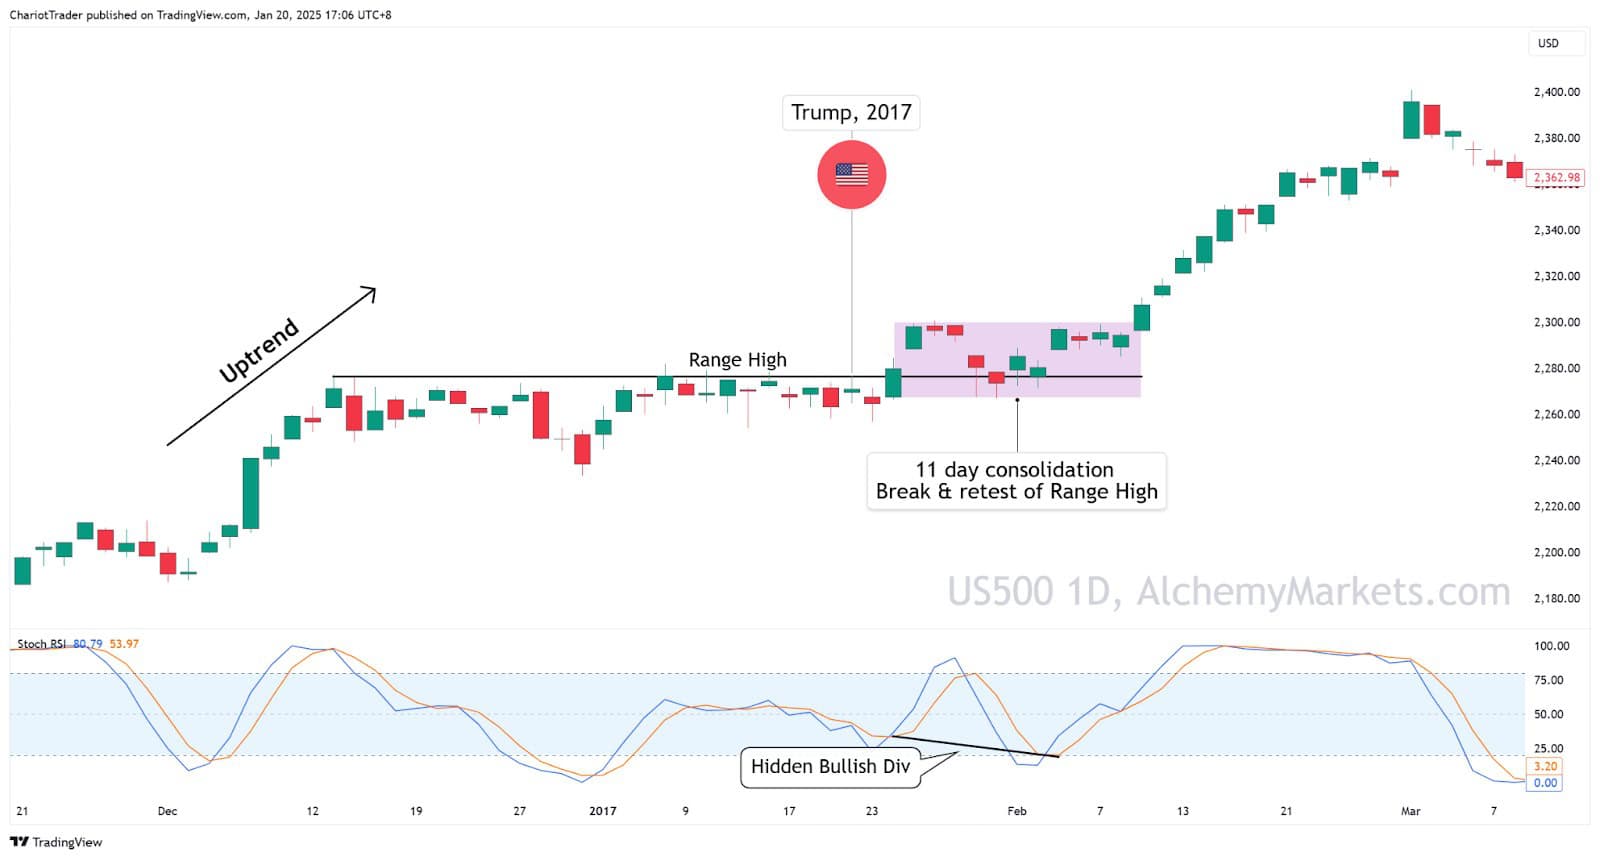
During Donald Trump’s first inauguration, the S&P 500 did not move significantly until the third day, where a close above its range high occurs. This eventually leads to an 11-day consolidation, resetting the momentum before another major rally.
Other keynotes
- Notably, the rally occurs after a hidden bullish divergence forms with the momentum.
Barack Obama, 2009 (Democrat)
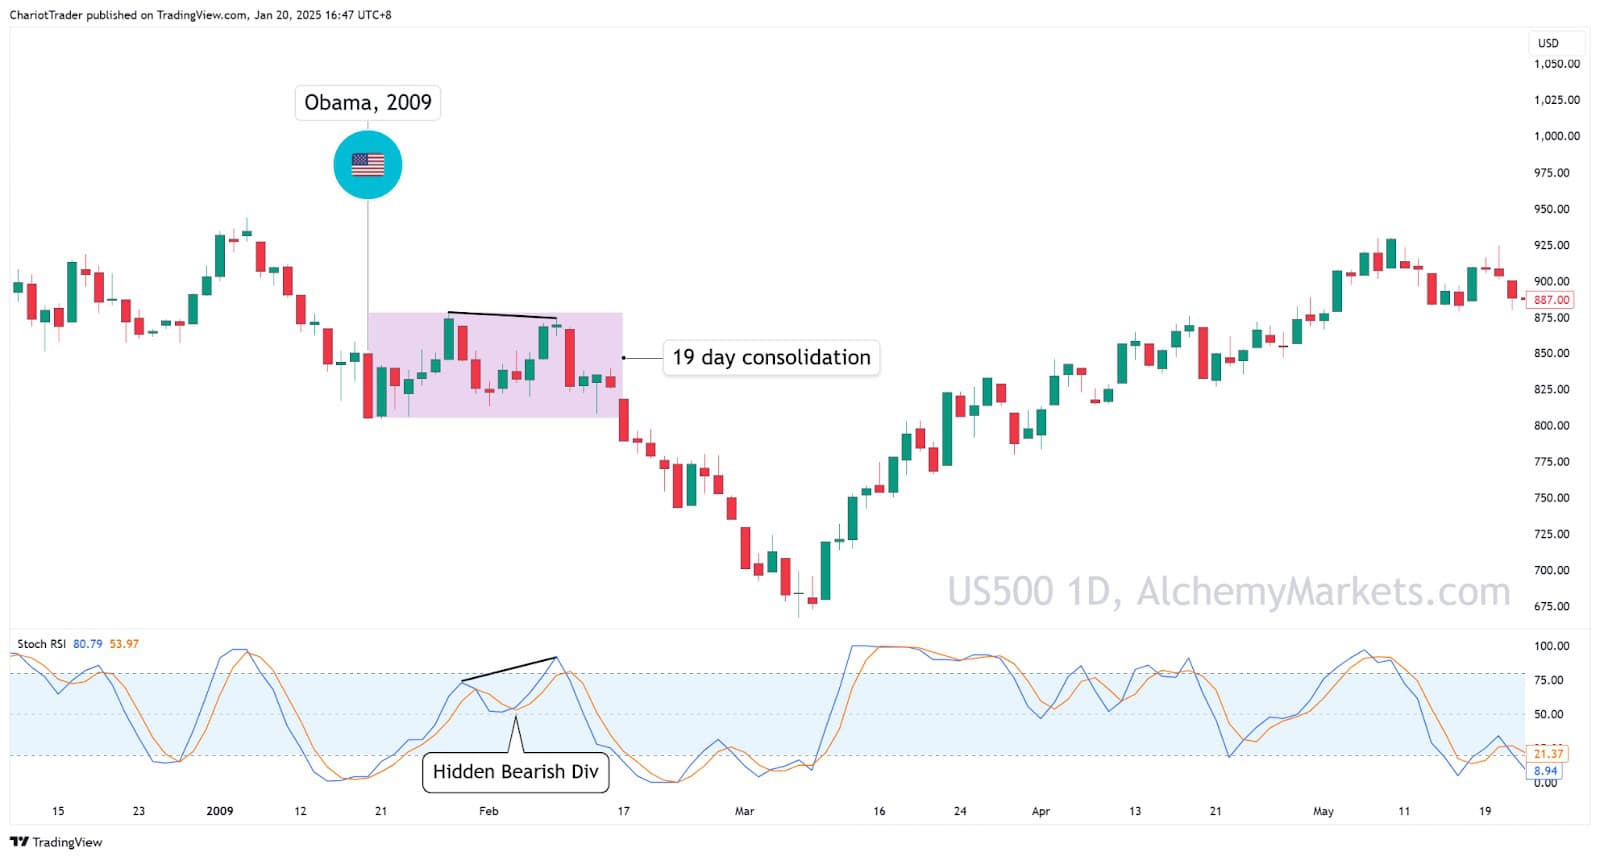
During Obama’s inauguration in his first term, the S&P 500 was already in a prevailing downtrend. On the day itself, the S&P 500 dumped lower by ~5%, but soon makes two attempts for price recovery. Ultimately, this leads to a 19-day consolidation that fails in recovering the price, and the S&P 500 declines by over ~18%.
Other keynotes:
- The presence of a hidden bearish divergence gave us an early indication that price would decline.
- This price action comes as a consequence of the 2008 Financial Crisis.
You may also be interested in:


