


Written by:


- Opening Bell
- July 2, 2024
- 3 min read
FOMC Meeting and Eurostat Flash Core CPI Estimate Set to Reveal Key Insights
There are two major news coming today which could shake up EURUSD and the DXY if things do not go as expected.
For the Eurozone, we are expecting to see CPI Flash Estimate y/y data from Eurostat at 09:00 UTC, making it 10:00 UK time and 06:00 New York time.
For the DXY, we are expecting an FOMC meeting to happen at 13:30 UTC, making it 14:30 UK time and 9:30 New York time.
The First Key: Euro Core CPI Flash Estimate
The CPI Flash Estimate y/y, and Core CPI Flash Estimate y/y is forecasted at 2.8% the Euro.
- IIf the expected inflation rate is met, it indicates easing inflation, giving the ECB more leeway for a rate cut, likely causing EURUSD to fall and DXY to rise.
- Overall, this should lead to EURUSD falling, and the DXY rising.
However, if this number comes in higher than expected, then the European Central Bank (ECB) may decide to hold interest rates or delay rate cuts.
- This could send EURUSD higher, and allow the DXY to fall from its current point.
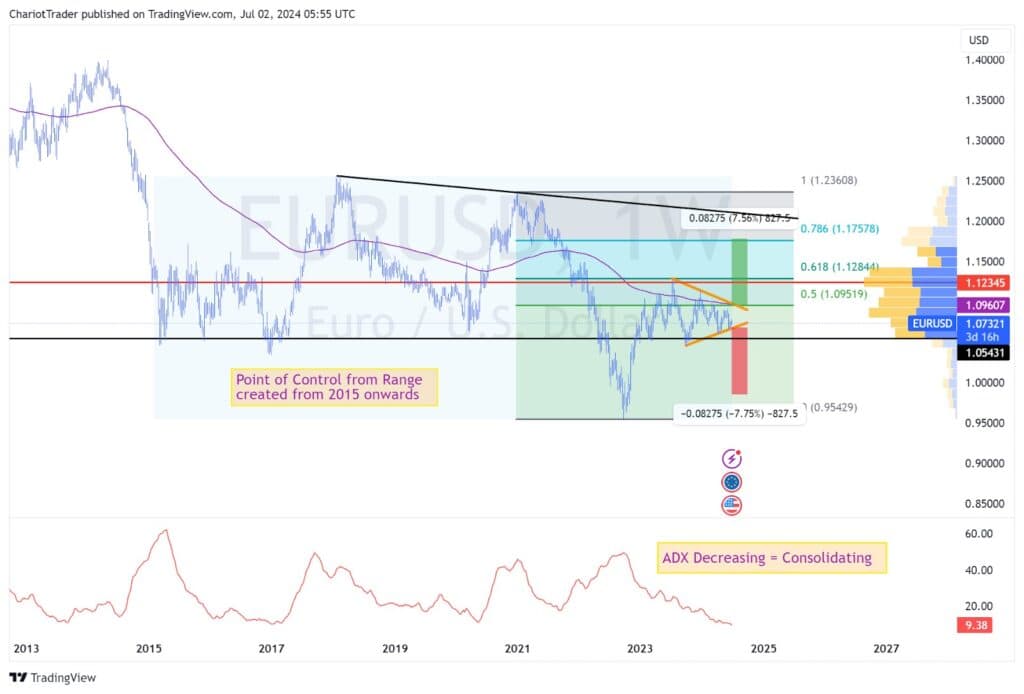
On the technical side, the EURUSD asset is forming a triangle pattern visible on the monthly, weekly, and daily timeframe. Currently, the price has rebounded from the lower trendline of the triangle, but EURUSD faces significant resistances before it can move higher.
Here are the key resistances to watch for EURUSD:
- Weekly 200 EMA (coinciding with top trendline and 0.5 Fib) – Approx. $1.09519
- Point of Control (coinciding with 0.618 Fib) – Approx. $1.12345
- Bullish Breakout Target at 0.786 Fib – Approx. $1.17578
Key support to watch for EURUSD:
- Lower trendline of Triangle – Approx. $1.07000 (Dynamic)
- Range Low – Approx. $1.05431
- Psychological Level – $1.00000
- Bearish Breakout Target – Approx. $0.98475
The Second Key: Fed Chair Powell Speaks Today
Federal Reserve Chair Powell will be speaking today, providing insights on how the Fed is currently viewing inflation in America.
Investors and traders will scrutinise the speech for tones of hawkishness or dovishness. If the Fed is hawkish, this would imply the Fed is intending to hold rates, which would be within expectations as the majority of traders believe the rates cut will happen in September.
A dovish tone could surprise markets, suggesting that rate cuts might come sooner than expected. This would send DXY moving to the downside.

Taking a look at the weekly chart, there are several key resistances traders should take note of:
- October 2023 Highs – Approx. 107.348
- Ascending Channel Midpoint, Top Trendline – Approx. 106.648 and 108.000 (Dynamic)
As for support levels, here are the key zones:
- Previous Pivot Low (coinciding with 0.382 Fib) — Approx. 104.231
- Channel Low – Approx. 100.617
To make things even simpler for us to analyse, let’s use the Stochastic RSI on the weekly timeframe to identify overbought/oversold conditions. We can observe that everytime time there is a red weekly close, and the RSI’s K line is over 80, the valuation of the DXY will begin to fall for the consecutive week(s).
If Euro inflation news is bearish and the Fed remains cautiously hawkish, the DXY may rise and cross the 80 mark on the Weekly Stochastic RSI.
If this does happen, I would personally be looking to see if there will be a red weekly close to kick off a potential decline on the DXY.
You may also be interested in: ISM Manufacturing PMI July Forecast.


