


- Elliott Wave
- April 7, 2025
- 3 min read
S&P 500 Elliott Wave: The Correction Is Resilient
Executive Summary
- Trend Bias: Bearish, as the correction of the 2022 rally appears incomplete.
- Key Support: 4,300 – the 61.8% Fibonacci retracement of the 2022-2025 rally.
- Next Downside Target: 4,300, if it breaks then 2,600 – 3,500.
Current Elliott Wave Analysis
In our March 26 report “Correction Over, For Now,” our alternate count anticipated a temporary rally in the S&P 500 that could possibly reach 5,900, but didn’t have to. After that brief push higher, then a decline to new lows targeting 5,122.
That forecast has played out so far. SPX did top at 5,787 the previous day on March 25 and began a heavy decline reaching 5,122 on April 4.
Today’s price declined even further as volatility continues to increase. Today’s upward price movement off the day’s lows is likely a small-degree wave four, with another leg down expected to retest today’s lows in the coming sessions.
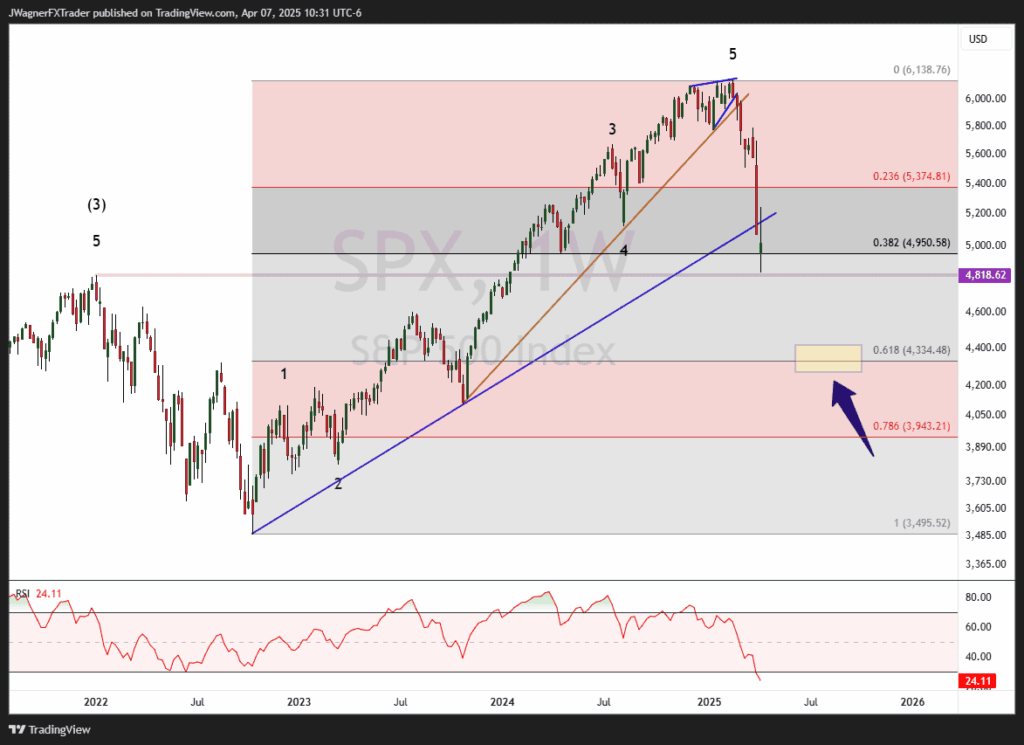
There are two significant Elliott Wave patterns that may have completed at the January 2025 high. The more immediate of these is the impulse wave that began in October 2022. A standard 61.8% Fibonacci retracement of that move places a high-probability support zone around 4,300—a logical target for a ‘normal’ correction of the 2022–2025 rally.
Currently, price has paused near the January 2022 high at 4,662, and also sits near the 38.2% retracement level of the 2022 rally, which lies around 4,950. While a move to new highs cannot be fully ruled out, the probability of such a rally is currently low. Given the brief nature of the current decline in both price and duration, a more meaningful correction is still likely.
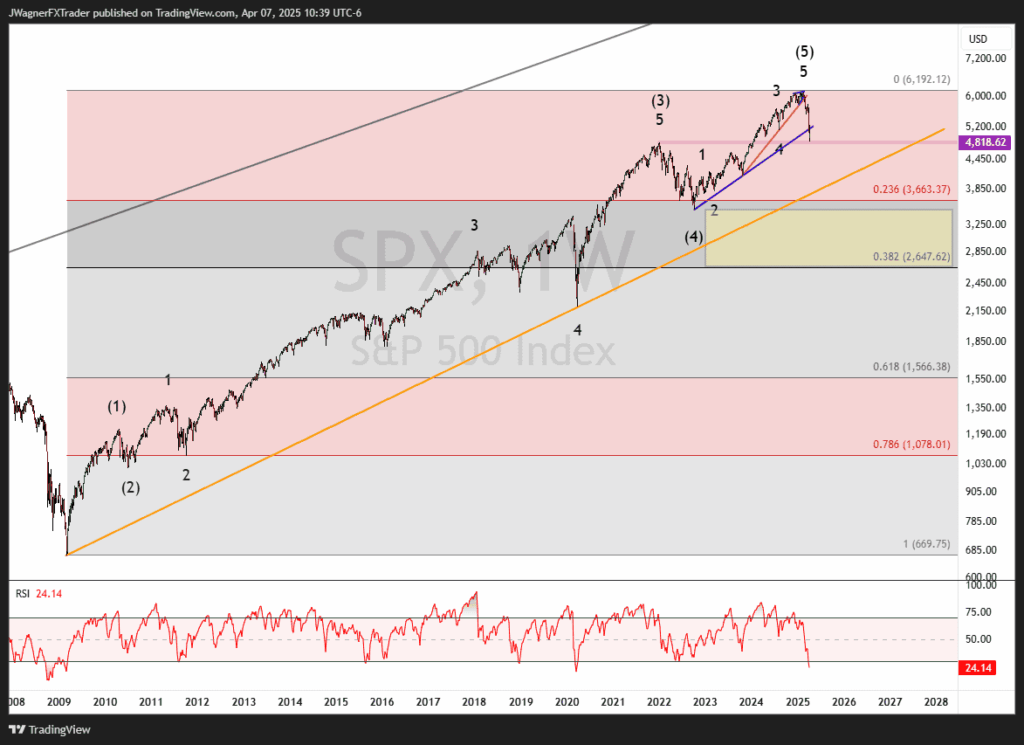
Looking at the bigger picture, there’s also a potential completion of the broader impulse wave that began all the way back in 2009. If this larger cycle has indeed topped out in January 2025, then a deeper correction becomes more likely.
Key support lies between 2,600 and 3,500—anchored by the previous wave (4) low and the 38.2% retracement of the 2009–2025 bull market. While even lower levels are possible if this long-term trend has ended, we’ll assess that possibility as the pattern unfolds.
Bottom Line
The SP500 appears to be in wave ((iii)) or ((c)) of a downward move, with the structure still incomplete. A decline toward 4,300 remains the higher-probability scenario in the near term. If the broader rally from 2009 is indeed complete, then a deeper correction toward 2,600–3,500 would be considered a ‘normal’ retracement.
We will reconsider the medium-term outlook if the index rallies above 5,488, which would overlap the March 31 low and suggest a possible low is in place.
You might also be interested in:


