
- Elliott Wave
- October 10, 2025
- 2 min read
Silver Prices Reach 45-Year Trend Line [XAGUSD Elliott Wave]
Executive Summary
- Silver prices (XAGUSD) reached a 45-year trend line dating back to 1980.
- A 1.618 Fibonacci wave relationship also appears near this week’s high.
- A decline to $45 would be considered normal within the larger uptrend.
Silver rallied up to a 45-year trend line this week. The trend line is created from the 1980 and 2011 price highs.
Current Elliott Wave Analysis
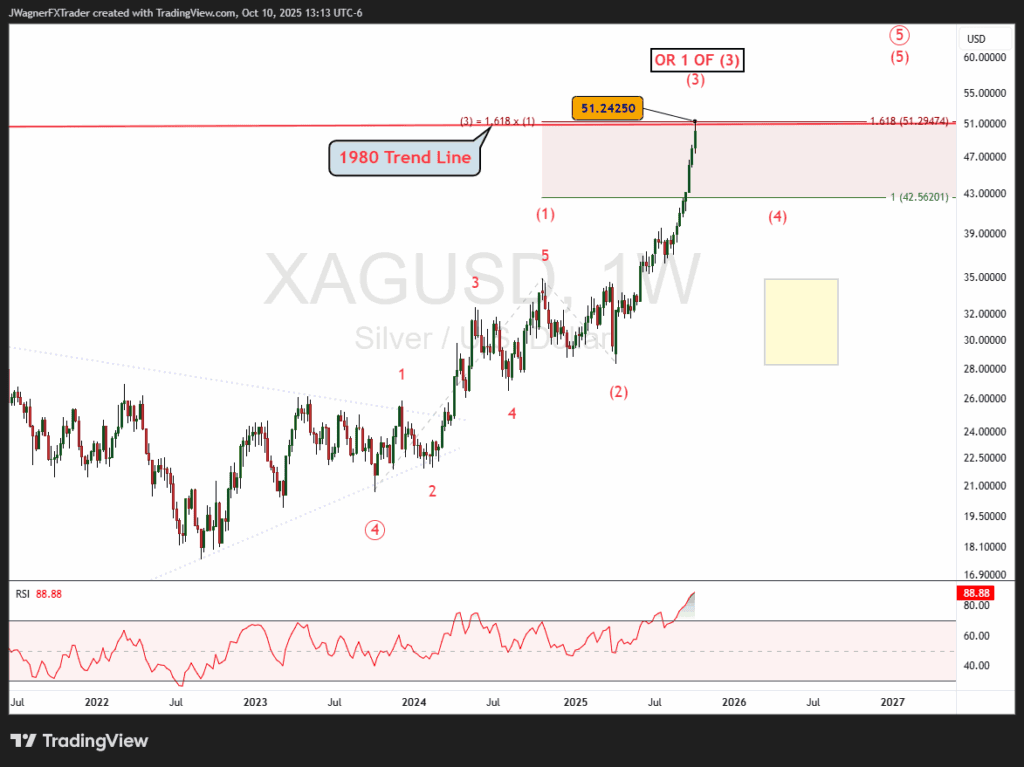
Silver (XAGUSD) appears to be rallying in a third wave. There are heavy structural wave relationships at this week’s high.
First, there is a resistance trend line stemming from 1980 that passes through (red line). We first highlighted this long-term trend line in our Q4 Commodities Forecast.
Second, wave (3) is a 1.618 Fibonacci extension of wave (1) at 51.29. This week’s high thus far is 51.24. This is a common wave relationship within Elliott Wave Theory.
Therefore, the risk for a correction back to $42 is elevated. We are viewing the next decline as temporary and likely holds above $35.
There is an alternate count that is more bullish. The alternate count suggests Silver prices are topping in wave 1 of (3) and the next temporary decline would be wave 2 of (3).
Regardless, the risk of a decline back to $42 is high.
Bottom Line
Silver remains in a mature bullish impulse pattern. The current wave (v) would be an ending wave of the bullish sequence that began in April. Upside targets include $41.64 and possibly higher levels.Any print below support at $36.21 would suggest a larger top is in place.