- Elliott Wave
- January 20, 2025
- 2min read
Ripple XRP/USD Elliott Wave: A Climb with Caution
Executive Summary
- Trend Bias: XRP/USD is in an impulsive Wave (v), suggesting continued upward momentum.
- Key Target: Fibonacci extension suggests resistance near $3.79, with an interim level at the 0.618 extension of $3.09.
- Warning Signal: RSI divergence and price nearing projected Wave (v) resistance imply a potential correction.
Current Elliott Wave Analysis

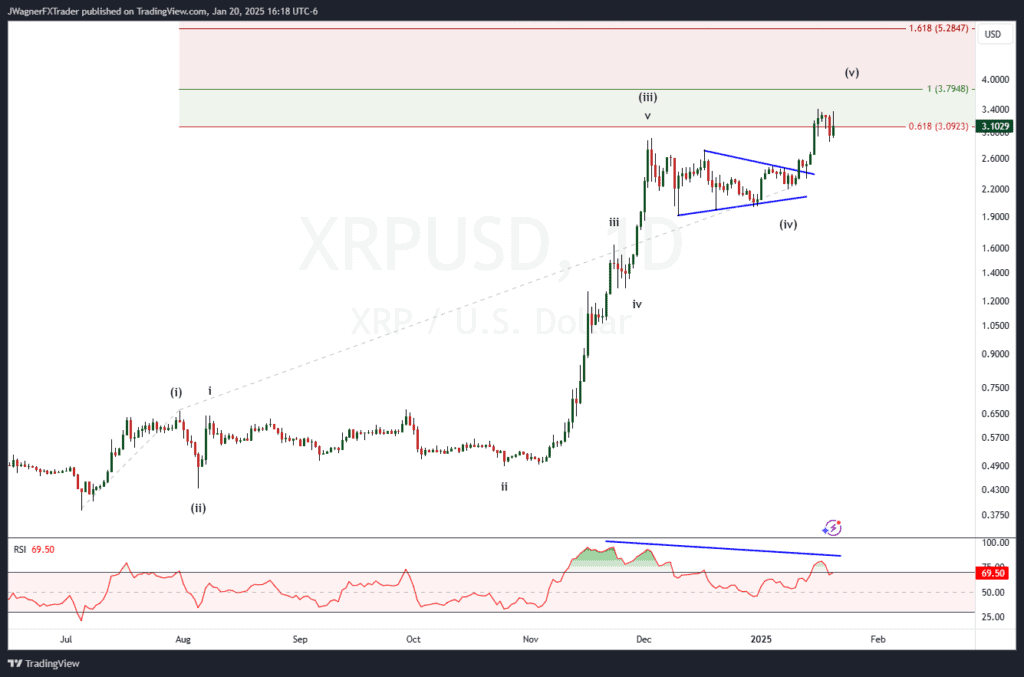
The XRP/USD daily chart indicates we are within the final stages of an impulsive Wave (v). The Wave (v) subdivides into five smaller impulsive waves, showing textbook structure as outlined by Elliott Wave Theory.
First, wave (ii) did not surpass the beginning of wave (i). Wave (iii) is an extended wave so wave (v) may be shorter and have a Fibonacci length relationship with wave (i).
Also, wave (iv) carved as a symmetrical triangle pattern. Triangles are quite common in the fourth wave position of the Elliott Wave sequence.
Fibonacci Projections
Using Fibonacci extensions, Wave (v) is approaching its key target range between $3.09 (0.618 extension) and $3.79 (1.0 extension). These levels are typical exhaustion points for fifth waves of an impulse pattern.
Divergence Warning
RSI shows bearish divergence as price advances, signaling diminishing momentum. This is often observed in Wave 5 scenarios and suggests a potential retracement following the completion of the current uptrend.
Bottom Line
XRP/USD is in the final stages of an impulsive rally. A target near $3.79 is achievable if the structure maintains its integrity. Traders should remain cautious as divergence in momentum indicates a potential correction may follow once Wave (v) concludes. It is common for prices to revert back to the territory of wave (iv) after the impulse completes. Therefore, a decline back to $2.00-$2.50 is not unusual after wave (v) is in place.
You might be interested in:


