
- Elliott Wave
- November 3, 2025
- 2 min read
Gold Price Losing Weight Prior to Next Rally [Gold Elliott Wave]
Executive Summary
- Trend Bias: Gold is declining in a corrective wave.
- Current Action: A decline to $3,782 – $3,797 and possibly lower levels appears as the higher probability trend.
- Key Level: A print above $4,139 suggests the first part or all of the decline is likely over.
Current Elliott Wave Analysis
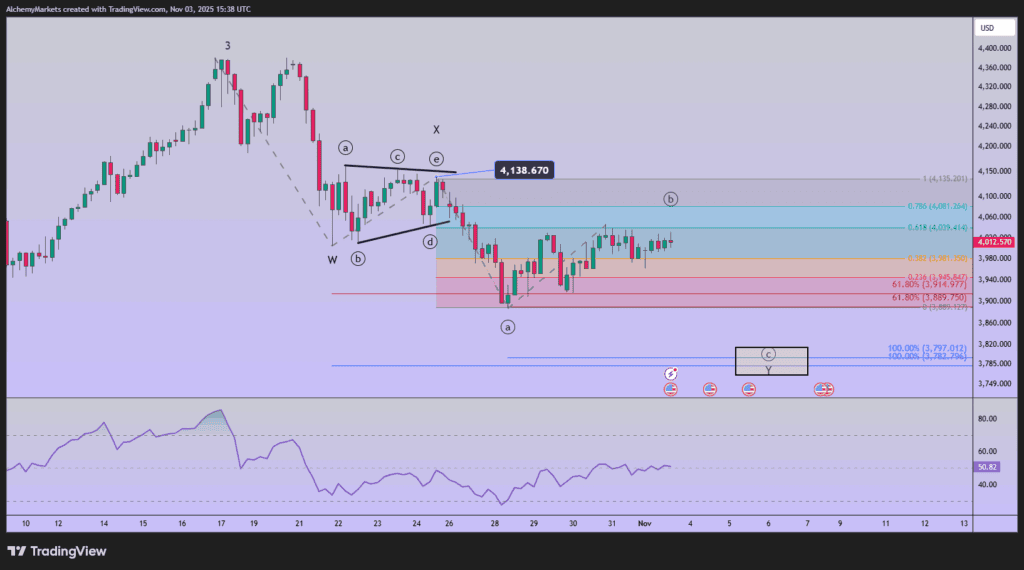
The current Elliott wave chart of Gold shows an incomplete downward double zigzag pattern. A double zigzag is two Elliott wave zigzags with the first ZZ labeled as W and the second ZZ labeled as Y. They are interrupted by an X wave symmetrical triangle.
It appears the rally from late October is wave ((b)) of Y. This implies one more decline in wave ((c)) of Y to be the final leg of the double zigzag pattern.
Wave ((b)) could rally a little higher, to around $4,081, but it doesn’t have to.
Once wave ((b)) finalizes and wave ((c)) is likely to carry down to $3,782 – $3,797.
These levels are represented by a couple of different Fibonacci extension wave relationships.
In the bigger picture, this decline that began in October is viewed as part of a larger wave 4 correction. Therefore, after another dip we will anticipate a medium-term low to develop.
Bottom Line
Gold prices appear more than halfway through a corrective wave 4 decline. We suspect gold prices will find another short term top below $4,139, then decline to around $3,782 – $3,797.
If gold prices push above $4,139, then we’ll consider an alternative scenario of a medium-term bottom last week.