


- Elliott Wave
- April 15, 2026
- 2 min read
EUR/USD: Important Low In Place? [Elliott Wave]
Executive Summary
- Price divergence between EURUSD and DXY hint towards meaningful trend change.
- Current rally model appears incomplete.
- Price is bullish while above 1.1627.
The price divergence between EURUSD and DXY on March 31 is a signal of a large bullish rally starting for EURUSD. It appears the bullish pattern that began on March 31 is incomplete to the upside.
Current Elliott Wave Analysis
On March 31, DXY reached a new price extreme, but EURUSD did not. Those types of divergences can signal trend change.
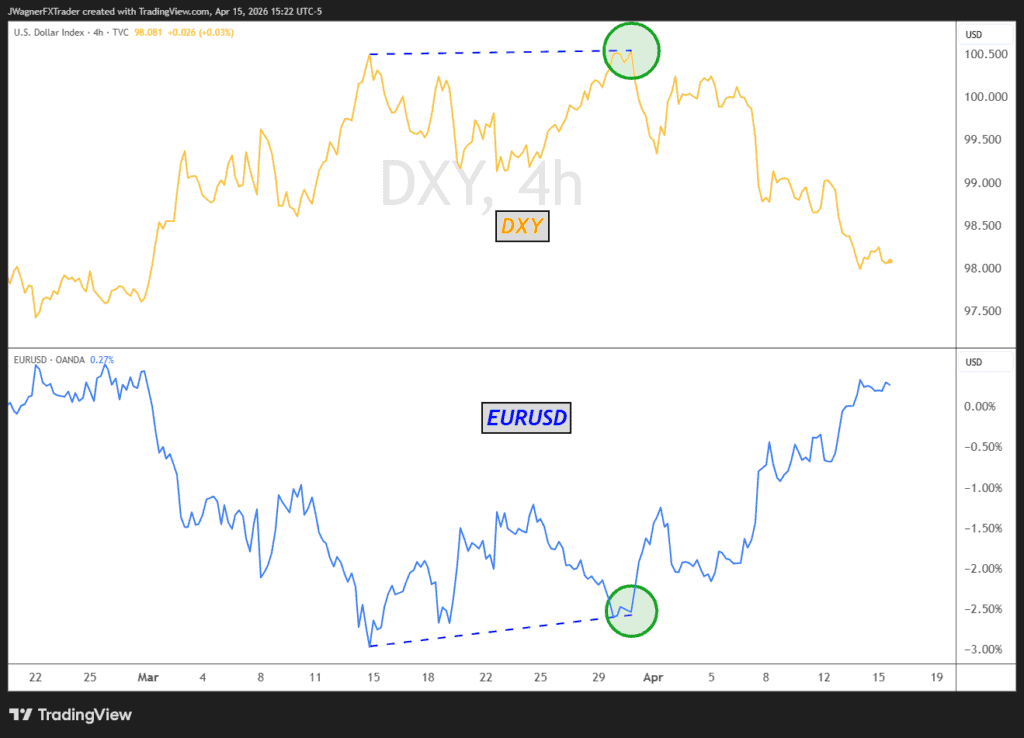
The chart above is side by side DXY and EURUSD. The majority of the weighting for DXY comes from EURUSD. Notice that on March 31, EURUSD did not confirm the price extreme for DXY. This signals a trend change is underfoot.
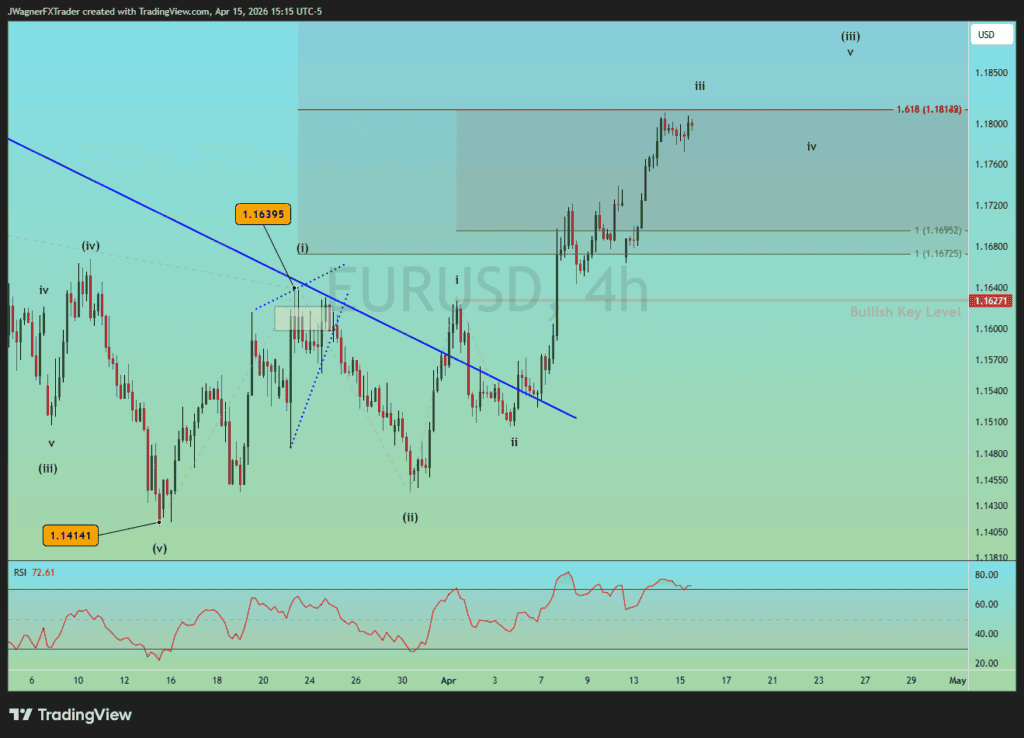
On the Elliott wave front, it appears EURUSD is rallying in wave iii of (iii). Some wave relationships appear near 1.1820 and EURUSD reached 1.1811 this week.
The 1.618 Fibonacci extension of wave i crosses near 1.1820.
Therefore, if some softness were to appear, it could set up the next bullish trade. Any hesitation near current price levels may simply be the end of wave iii. The larger pattern would still be incomplete to the upside.
If wave iii terminates near current levels, a decline to 1.1700 would be considered normal, though EURUSD does not have to decline that far.
The next bullish wave relationship appears up near 1.20.
The bullish key level would be the wave i support high of 1.1627.
Bottom Line
The Elliott wave count we are tracing is that wave iii may end soon followed by a temporary dip. Once buying resumes, EURUSD price could extend up to 1.20 while holding above 1.1627.


