


- Elliott Wave
- May 18, 2026
- 2 min read
Crude Oil Elliott Wave Pattern Points Higher
Executive Summary
- Crude oil reached $107.46 then fell back to $88.66
- The current pattern suggests a rally above $111 to $113 and possibly $124.
- A print below $97.23 would delay this forecast.
Our previous analysis on May 1 forecasted a rally to $106 followed by a dip and another rally above $111. The first two legs of this sequence have completed (rally to $106 then dip), now crude oil appears poised to rally above $111.
Current Elliott Wave Analysis
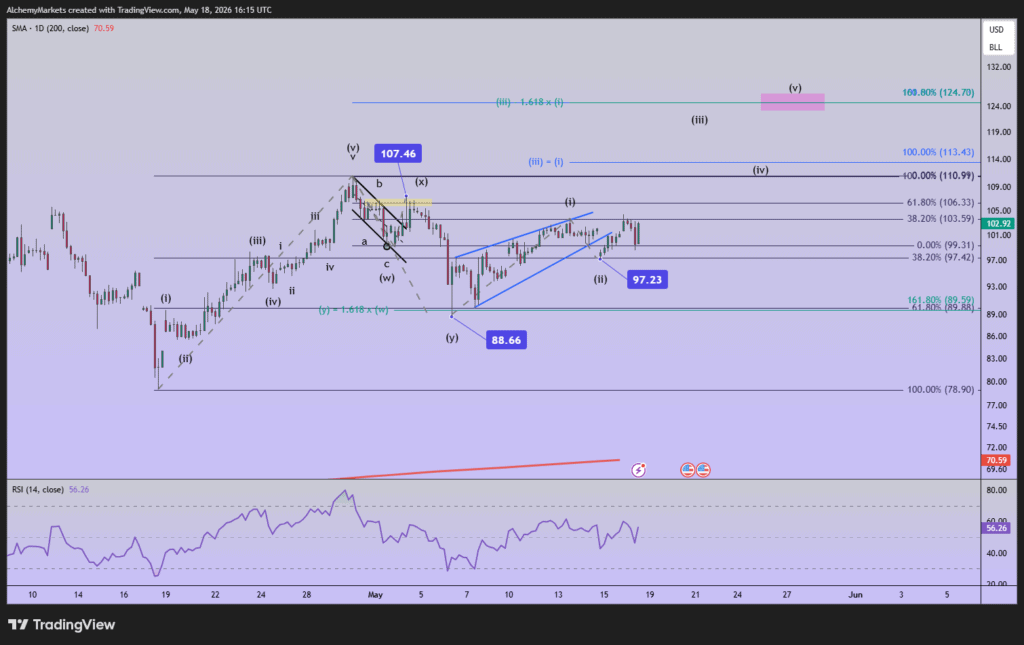
The current Elliott wave pattern shows crude oil may be in the beginning stages of a wave (iii) rally.
We anticipate this wave (iii) rally will carry above $111, possibly to near $113. Wave (iii) is equal to (i) near $113, this is a common Fibonacci extension.
When wave (v) of the current impulse completes, crude oil might be trading near $124. Therefore, it appears crude oil may be supported in pricing for the next few days.
If crude oil prices were to falter down to $97.23, then it would suggest the start of wave (iii) was delayed and wave (ii) was still ongoing.
Bottom Line
Crude oil appears to be on the front edges of a wave (iii) rally. If correct, then a swift rally may be underway to $113 and possibly $124.
If crude oil prices fall back below $97.23, then wave (iii) is delayed and wave (ii) is still ongoing.


