


- Elliott Wave
- January 9, 2026
- 2 min read
AUD/USD Elliott Wave: Leading Diagonal Leads The Next Trend
Executive Summary
- Trend Bias: The AUD/USD pair is rallying within a larger uptrend that began in April 2025.
- Initial Rally Target: Near 0.69 where wave ‘iii’ would match the length of ‘i’.
- Key Support: .6421 is the key level of support for the bullish forecast.
Aussie is trying to fall below a wedge pattern. We believe the decline is temporary and may lead to new highs above .6766.
Current Elliott Wave Analysis
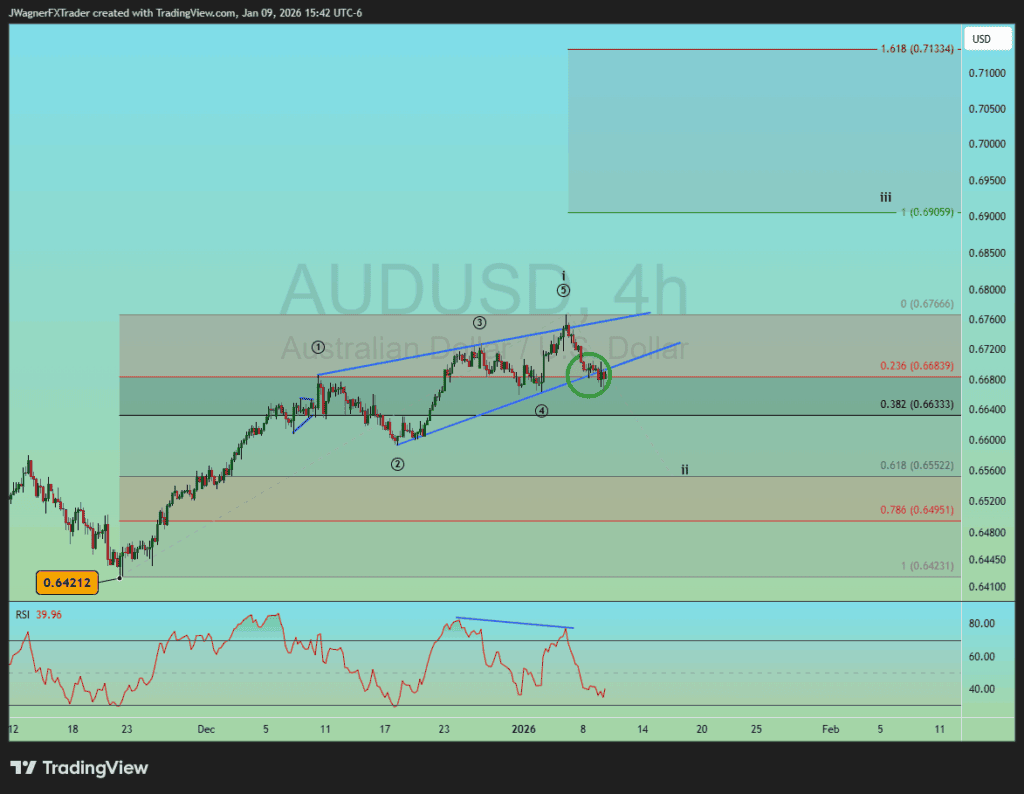
AUDUSD topped earlier this week and has declined near 100 pips. It appears that AUD/USD is correcting lower in Elliott wave ‘ii’ of a larger impulse pattern. This 2nd wave decline is forecasted to end above .6421, with a typical target zone in the.6550-.6635 region.
After wave ‘ii’ terminates, then the next phase would be a wave ‘iii’ rally that may carry up to .69 and possibly .71 in the coming weeks.
This bullish run started with a leading diagonal, or as most technicians call it, a rising wedge. The diagonal has 5 waves within it. Once the leading diagonal is completed, anticipate a Fibonacci retracement between 38-78%. Then, after the partial retracement is complete, Aussie may rally again of similar size or Fibonacci proportions (using the Fibonacci Extension tool) relative to the December rally.
Bottom Line
If AUD/USD declines to .6550-.6635, then it may set up the next rally to .69 or higher. This wave count is valid so long as price remains above .6412. If the Aussie prints below .6412, then we’ll reconsider the wave count.


