


Written by:


- Chart of the Day
- June 4, 2025
- 2 min read
UBER Nearing Key Support After Breaking Down From $93 Dollars
After a powerful rally that peaked at $93.60 in mid-May, UBER has pulled back sharply, now resting near the $81.50 mark. The decline appears orderly, with price respecting key structural zones defined by volume and anchored VWAP levels.
While there’s a chance for a bounce around current levels, a deeper retest into the 38.2% Fibonacci retracement at $80.98 could potentially offer a high-probability setup.
This level aligns with both a high-volume node and an anchored VWAP — forming a triple confluence zone. If price wicks into this area and rebounds, it could mark a strong reaction point in the short-term.
Technical Breakdown of UBER 1D Chart
The sell-off has brought price into a zone of support between $80.69 and $81.88, where we see:
- A high volume node (HVN) during the leg up from April to Mid-May
- Confluence with the 38.2% Fibonacci retracement
- Price approaching the lower bound of an anchored VWAP that began from the April rally
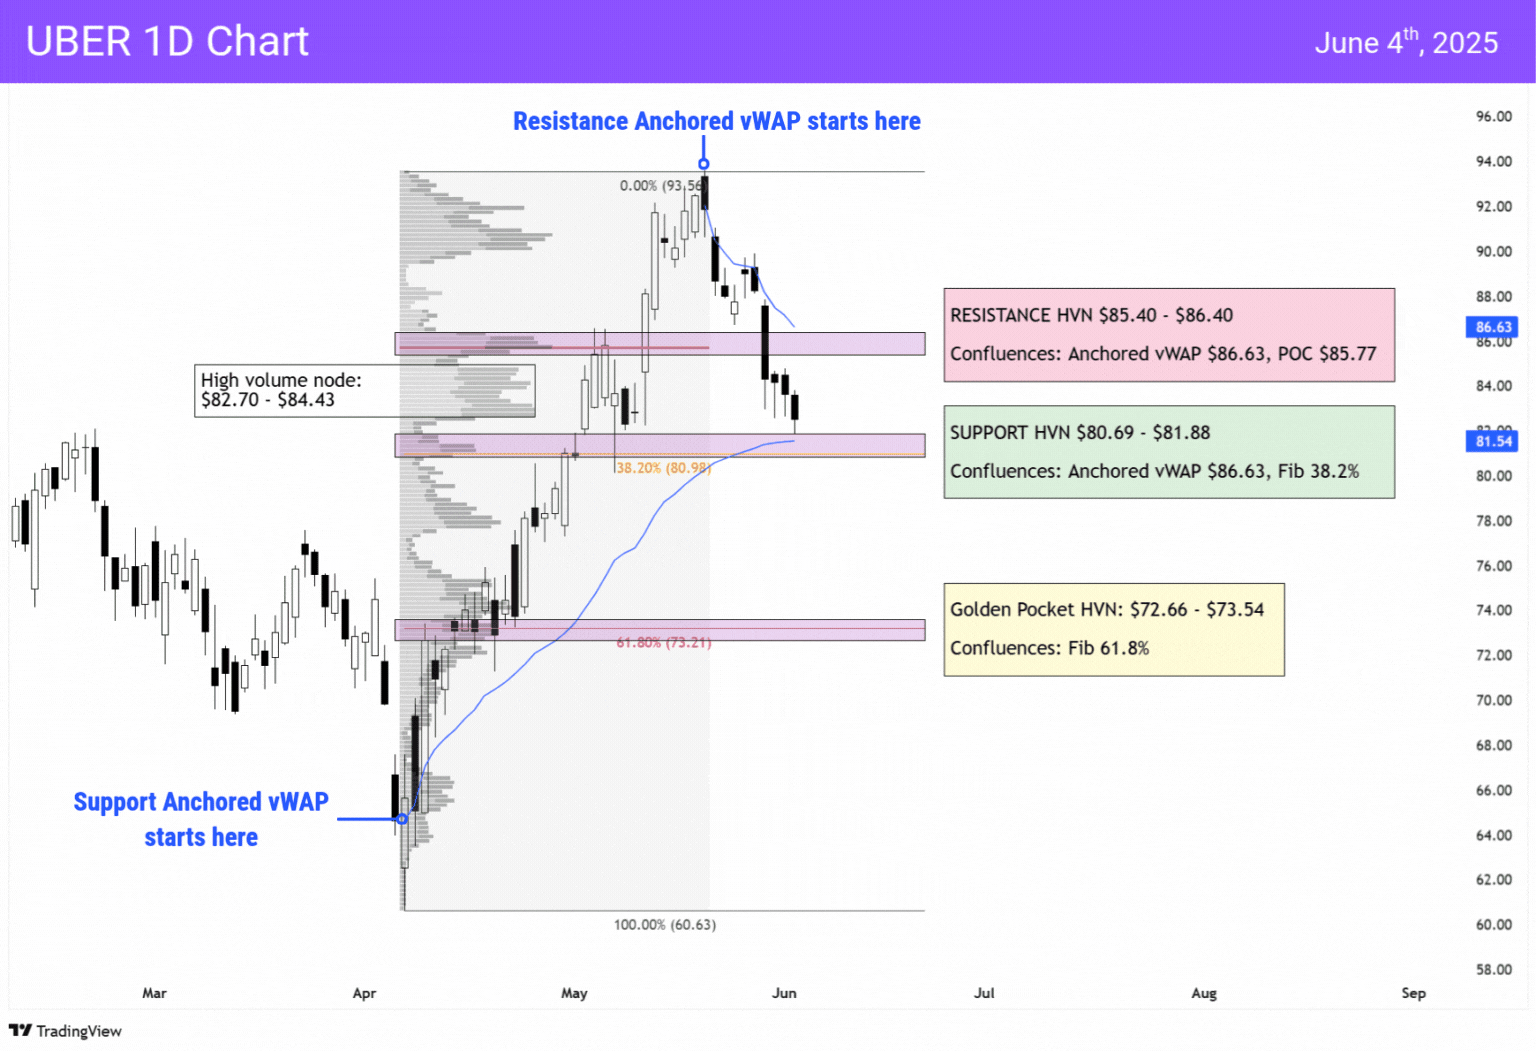
Should this level fail to hold, the next major area of interest lies deeper — the Golden Pocket zone between $72.66 – $73.54, which aligns with the 61.8% Fib retracement.
Not out the woods — Resistance Right Overhead
A bounce here would be good news — but, it’s undeniable that we have stiff resistance overhead between $85.40 – $86.40, marked by a HVN and several other confluences:
- Anchored VWAP resistance sits at $86.63
- Point of control (POC) and a high volume node around $85.77
- Sellers stepped in aggressively here during the most recent attempt to reclaim higher ground
There’s a possibility we could range between the HVNs until a clear breakout occurs, giving us a reversal signal (Support HVN breaks), or continuation signal (Resistance HVN breaks).
You may also be interested in:


