


Written by:


- Chart of the Day
- December 4, 2025
- 3 min read
U.S. Oil (WTI) Breaks Out — Is the Trend Turning?
After weeks of trading inside a tight downward channel, U.S. crude oil (WTI) has finally broken out — hinting that bearish momentum might be fading. Prices are now hovering just below $60 a barrel, and traders are watching closely to see if this move can hold.
A Closer Look at the Chart
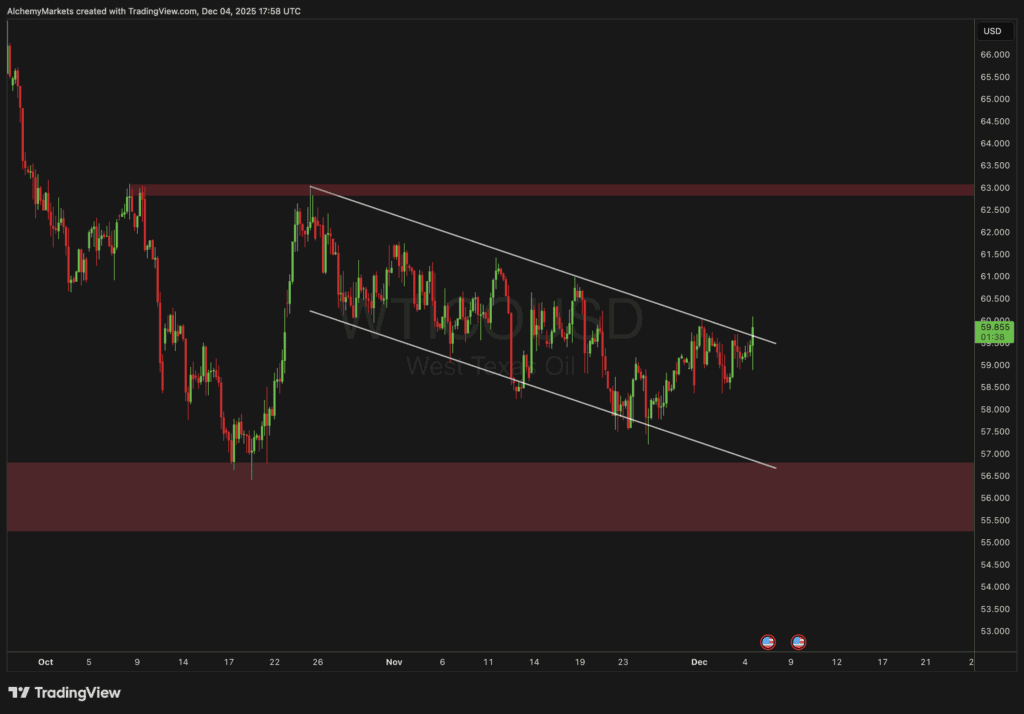
For much of the past month, oil has been trapped between lower highs and lower lows, moving steadily within a descending channel. This week’s breakout above that upper boundary suggests a shift in sentiment.
Technically, a clean break above the $60 level could open the door for a test of the $62–$63 resistance zone — an area that capped prices earlier in the fall. The move also coincides with improving risk appetite across broader markets and a slightly weaker U.S. dollar.
What’s Driving Oil Higher Right Now
1. Geopolitical Tensions and Supply Disruptions
Oil prices jumped after Ukrainian drone strikes targeted Russian oil infrastructure, sparking renewed concerns over supply risks. Any disruption in Russian output tends to ripple through global markets quickly, given how central those exports remain to Europe and Asia.
2. OPEC+ and Production Discipline
Recent surveys show that OPEC+ output slipped slightly in November, even though the group had agreed to raise production. Some members continue to struggle with maintenance issues or are quietly curbing supply, keeping the market tighter than expected.
3. A Softer Dollar Boosts Commodities
The U.S. dollar has weakened over the past week as traders bet that the Federal Reserve could start cutting rates early next year. Since oil is priced in dollars, that makes it cheaper for foreign buyers — another short-term boost for prices.
4. Technical Breakout and Trader Sentiment
Once WTI broke above the channel, momentum algorithms and short-covering kicked in. Many traders who had been short on oil are now being forced to buy back positions, adding fuel to the rally.
What Could Limit the Upside
While this breakout looks promising, there are still a few key risks:
- Global supply remains strong, especially from non-OPEC producers like the U.S. and Brazil.
- Demand growth is slowing as the global economy cools and energy efficiency improves.
- Seasonal effects — like weaker winter demand and rising inventories — could cap gains if supply disruptions fade.
So, while the short-term tone is bullish, fundamentals still paint a mixed picture for 2026.
What to Watch Next
Here are the main signals traders will be monitoring in the days ahead:
- Any new attacks or disruptions in oil-producing regions.
- U.S. inventory data — large stock draws would support further upside.
- Dollar strength — a rebound could pressure oil again.
- OPEC+ announcements or unplanned supply cuts.
If the breakout holds above $60 and demand data remains firm, WTI could climb toward $62–$63 in the short term. A rejection, however, could pull prices back toward $57–$58, the lower support zone.
Bottom Line
This breakout in U.S. oil isn’t just a chart pattern — it reflects a market caught between supply risks and economic uncertainty. For now, the bulls have the upper hand, but sustainability will depend on whether geopolitical tensions and OPEC discipline continue to tighten supply.
Oil might finally be trying to turn the corner — but traders should stay alert. This rally could just as easily fizzle if the fundamentals shift.


