Written by:

- Chart of the Day
- October 20, 2025
- 3 min read
Is the Worst Over? SPX and Bitcoin Chart of the Day Analysis
With the announcement of new China tariffs, both the S&P 500 and Bitcoin saw sharp corrections last week. However, the U.S. government has since toned down its stance, raising a fair question: is the correction over?
Technically, that answer depends on how the S&P 500 behaves this week. Bitcoin tends to move in tandem with the index, so if the S&P 500 manages a clean recovery, crypto could follow suit.
S&P 500 Chart of the Day Analysis
Using a Fixed Range Volume Profile (FRVP) to assess key levels, the S&P 500 is currently hovering around the Value Area High (VAH) of its recent rally. While this zone acts as resistance, several factors lean bullish:
- The price is currently supported by the 20 EMA Bollinger Bands®, an accurate level of support and resistance.
- S&P 500 has tapped into a lower trendline of an ascending channel — technically a support level.
- A regular bullish divergence has formed on the daily timeframe with the Stochastic RSI.
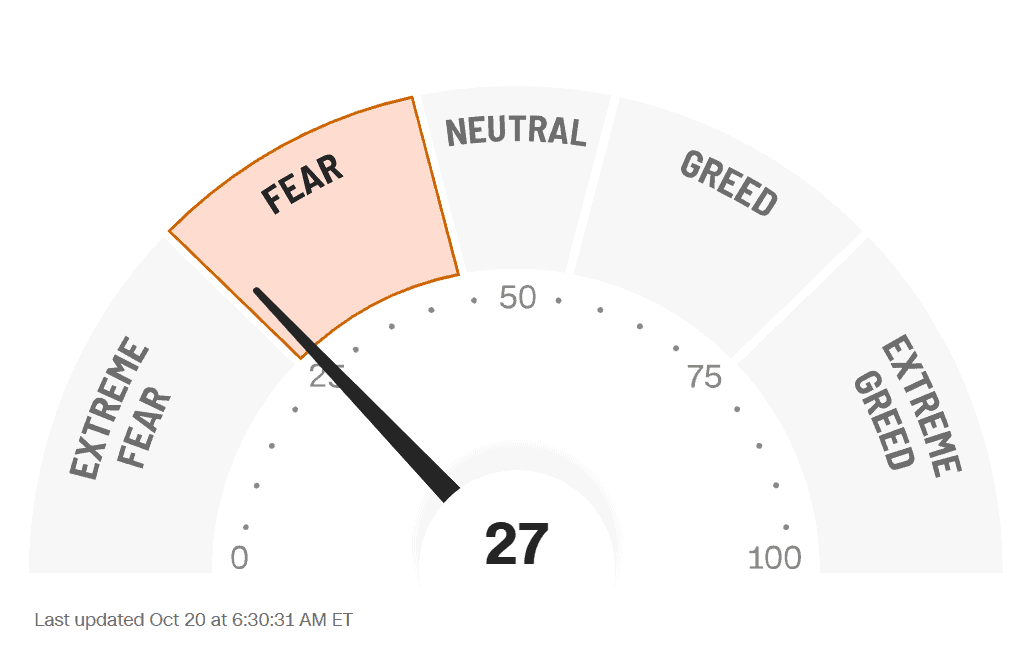
- CNN Fear & Greed index is printing ‘27’, a fear reading.
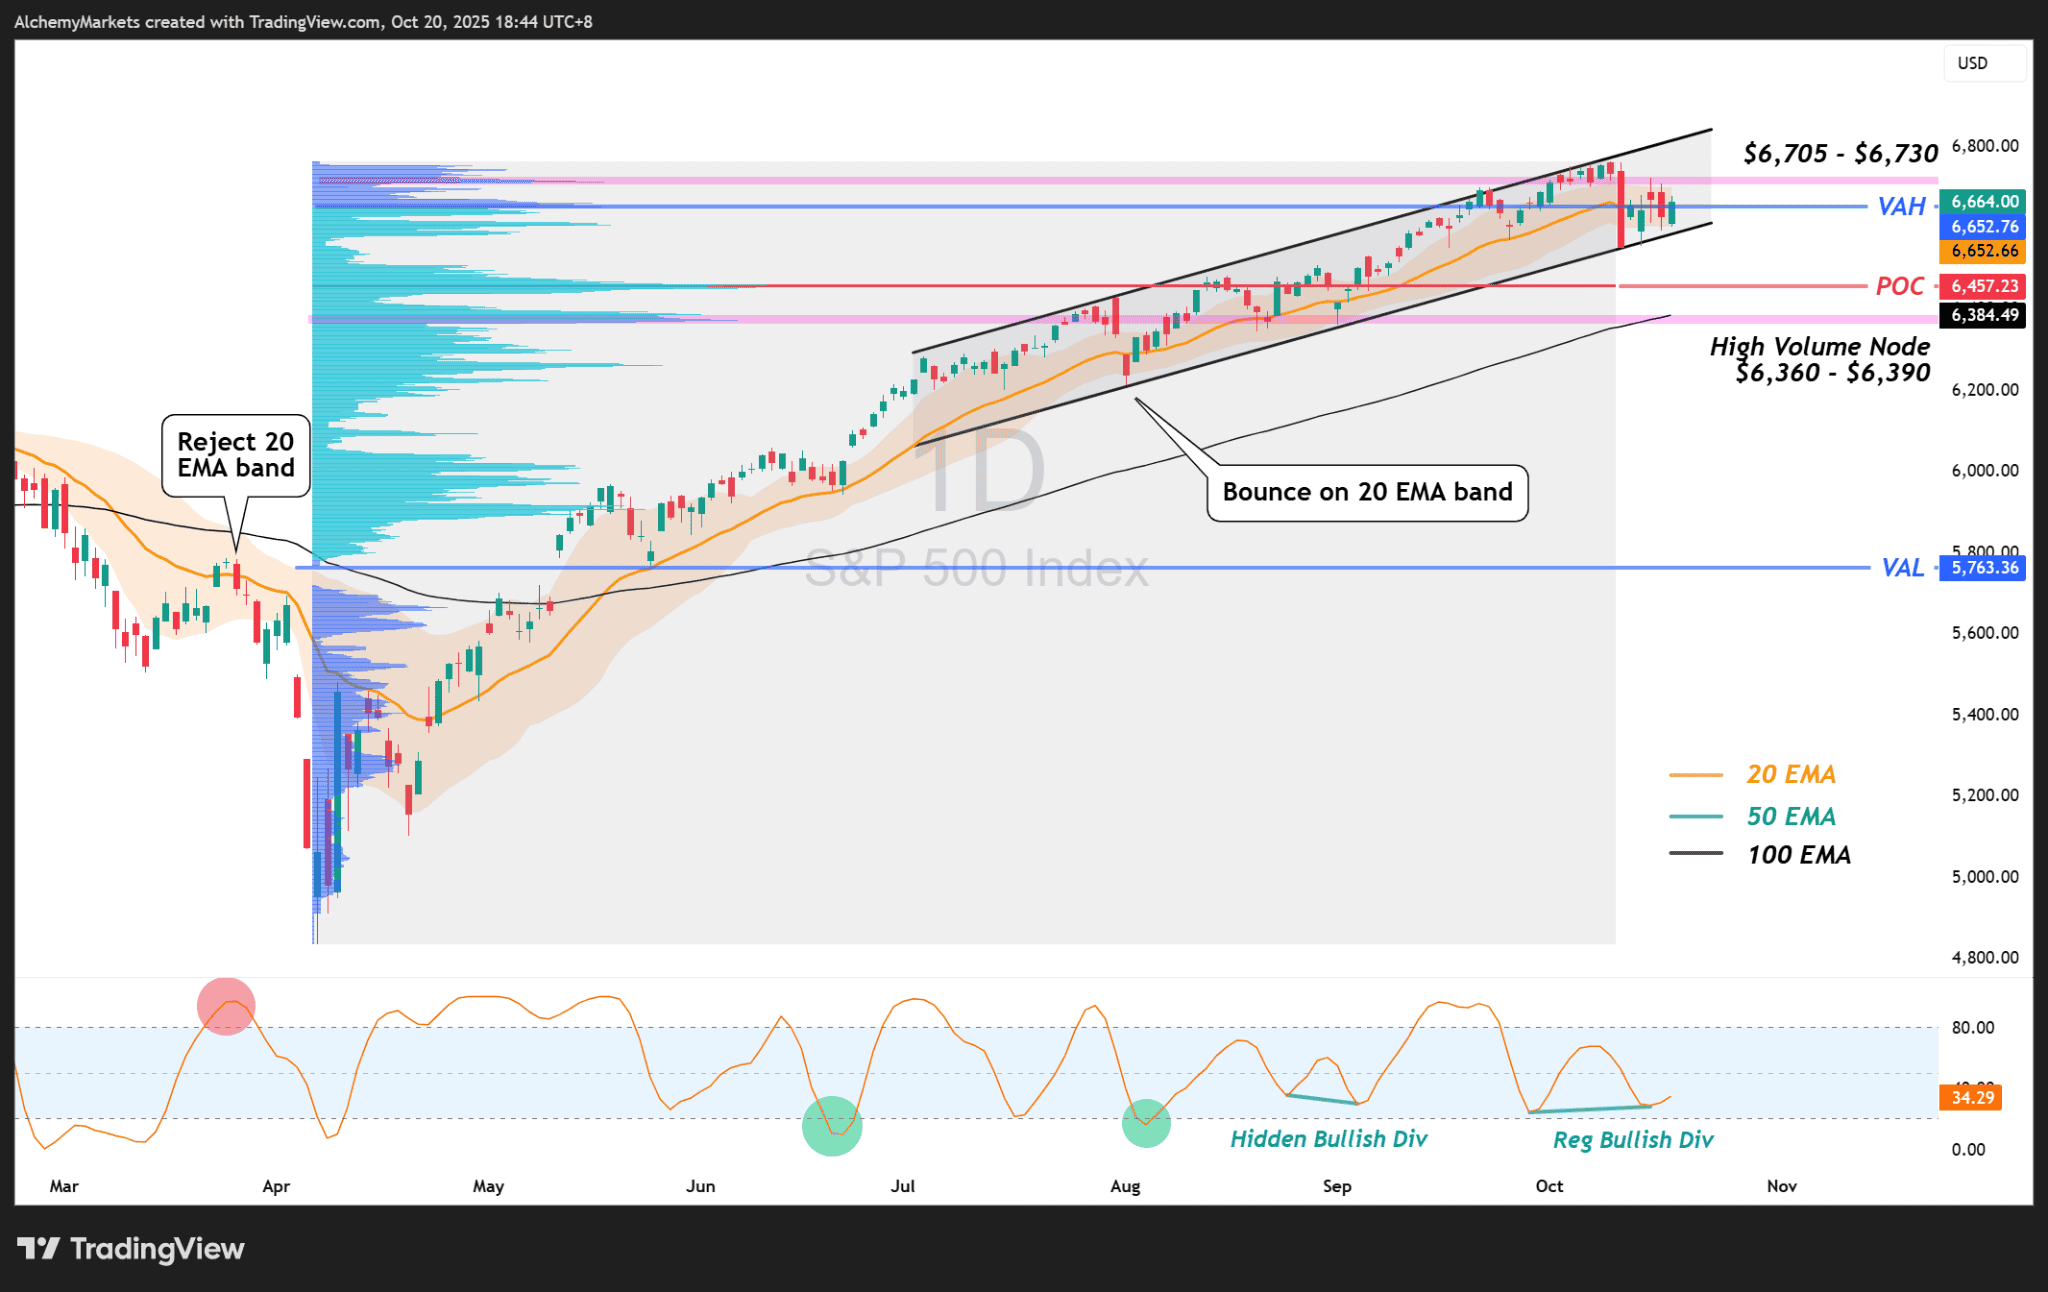
The gameplan here is simple. Watch how the price reacts around the VAH at ~$6,652.
- Bullish scenario: Break and hold above $6,652, with resistance between $6,705 – $6,730.
- Bearish scenario: Breakdown from the channel could open a move to the POC at $6,457, and possibly lower toward $6,384.
Bitcoin Chart of the Day Analysis
Bitcoin has already reacted to a high-volume node near $103,200, and more importantly, has reclaimed a key Anchored vWAP from the start of its recent rally — currently at $107,221.64.
Now, price is pressing into the Point of Control (POC) from last week’s decline, sitting around $111,288 — a level that also aligns with the May 2025 swing highs, where significant volume traded.
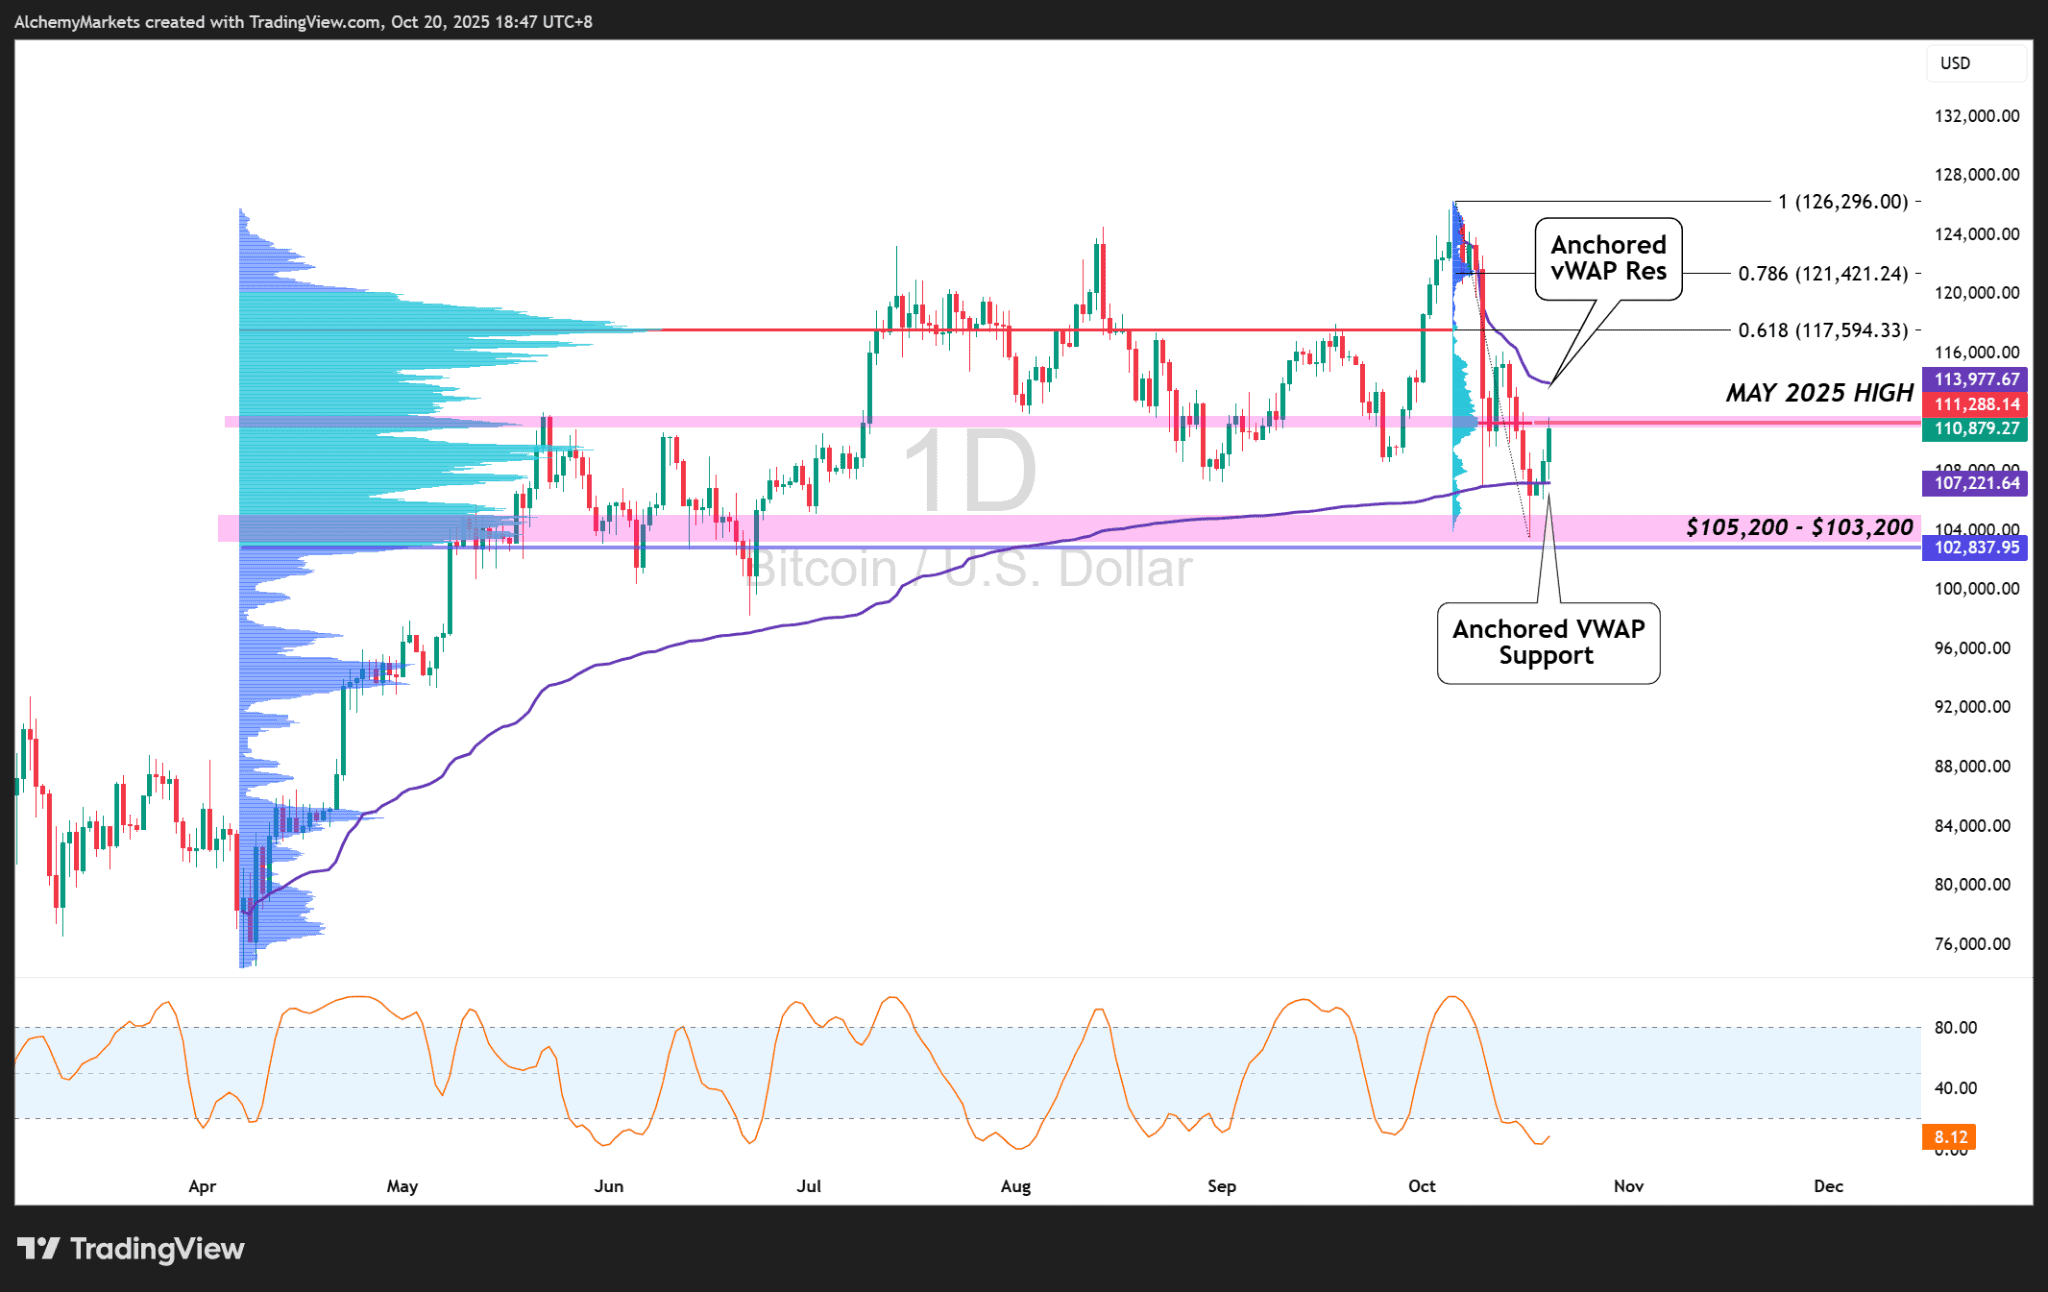
If Bitcoin continues higher, the next area to watch is the Anchored VWAP resistance (from the start of its decline) near $113,977.67; a level that also overlaps with heavy liquidation clusters.
A breakdown from here could pull Bitcoin back to $107,221.64, with deeper support seen around $105,200 – $103,200, overlapping with the 3D, 1W, and 2W Max Pain levels on Coinglass (~$104,400).
The Bigger Picture
Both the S&P 500 and Bitcoin are sitting at major inflection zones. Momentum is cautiously improving, but confirmation still hinges on how equities respond to this week’s earnings and key macro data.
🗓️ Notable Events This Week
Earnings Releases:
- Netflix (NFLX) – Tuesday, 22 October
- Tesla (TSLA) – Wednesday, 23 October
- Coca-Cola (KO) – Thursday, 24 October
- Intel (INTC) – Thursday, 24 October
- IBM (IBM) – Thursday, 24 October
Economic Data:
- U.S. CPI Report – Friday, 24 October, 8:30 a.m. ET
A softer-than-expected CPI print could spark renewed risk appetite across equities and crypto. A hotter-than-expected reading, however, might reignite selling pressure, especially if paired with weak earnings guidance