


Written by:


- Chart of the Day
- August 30, 2024
- 3 min read
Netflix to Press ‘Play’ on 4H Bull Flag to See New All-Time Highs
Netflix (NFLX) is seeing a 4H bull flag consolidation right at its ATH (all-time highs).
This comes right after Nvidia’s recent drop, which as we’ve covered is not bearish – but rather setting up for another leg up.
So, with Nvidia acting as another point of bullishness, we do have a case for a breakout on Netflix. Let’s break this down on the 4-hour timeframe on NFLX’s chart.
NFLX: Bull Flag on 4H and Double Bottom on Stochastic RSI
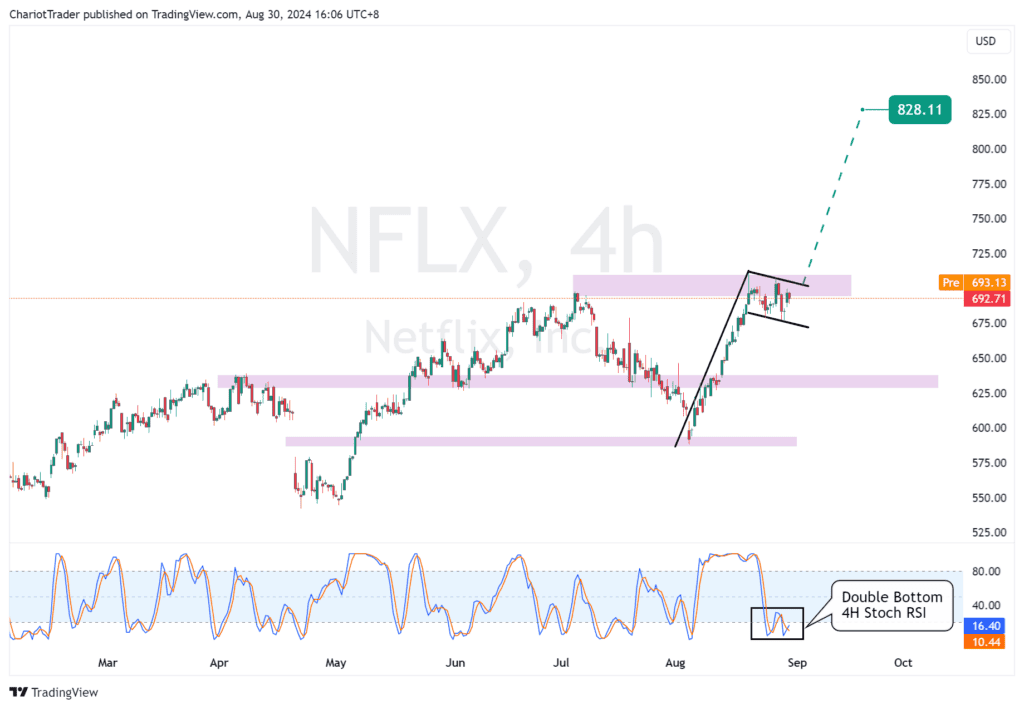
Even though Netflix has created several bearish reactions at this ATH resistance level, there are a few factors which support a bullish breakout to happen eventually.
The first, obviously, is the creation of a bull flag on the 4H timeframe. Secondly, this comes aligned with a 4-hour double bottom consolidation as well, which is usually a good sign for a stock price to rise.
Depending on if and when the breakout appears, the measured move target would be placed at approximately $820.00 to $830.00 – roughly marking a 1,227 pips move or 18%.
| Resistance Levels to Watch for a on NFLX • Bull flag upper trendline • ATH resistance zone: Approx. from $695.45 – $710.55 |
In Case of a Deeper Retracement: Watch These Levels
In the event a rejection to the downside does occur on NFLX, pay attention to whether the price falls out of the bull flag or breaks certain key levels below.
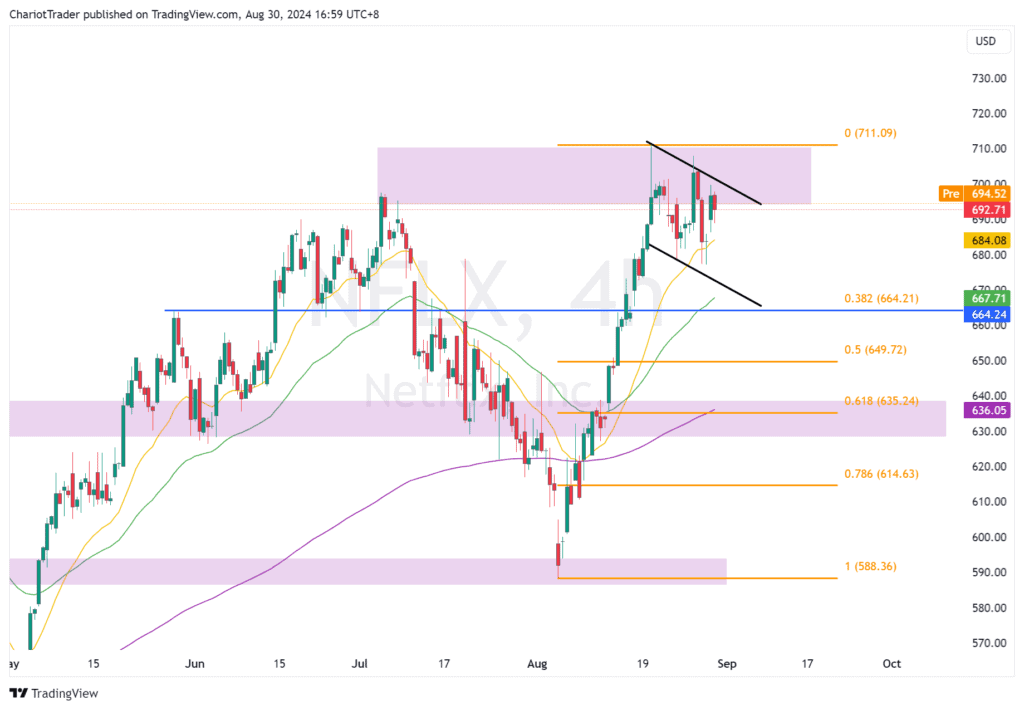
For now, the NFLX 4-hour chart has shown to be respecting its 20 EMA, which it has recently bounced off of. If this EMA breaks, the 50-EMA is quickly rising to align with the lower trendline of the bull flag, which is another bullish indication.
There are also various Fibonacci Retracement levels to watch as a potential support. The first being the 0.382 retracement at $664.21, which is highlighted in blue and aligns with a minor support level.
The second and most important Fib level to watch is the 0.618 retracement at $635.24, which aligns with the 4H-200 EMA and a major support zone.
| Support Levels on Watch on NFLX • 4H-20 EMA: Yellow Line in the chart • 4H-50 EMA: Green Line in the chart • 38.2% Fibonacci Retracement: $664.21 (Aligns with Support Level) • 61.8% Fibonacci Retracement: $635.24 (Aligns with 4H-200 EMA, Major Support Zone) |
Either way, it does seem more likely than not that Netflix is simply waiting to push the “play” button of the bull flag to eventually break its ATH.
You may also be interested in:
NVIDIA’s Growth Story: What’s Next for the AI Giant?
Silver Elliott Wave: Shine and Climb


