


Written by:


- Chart of the Day
- December 4, 2024
- 2 min read
Falling Wedge: Gold (XAU/USD) Technical Analysis for December 2024
Gold is potentially in a downtrend after a massive daily rejection from the $2720 zone. This impulsive rejection marks the possibility of structural shift in the market, with a lower high being set in right after November 14th’s lower low around $2,550.
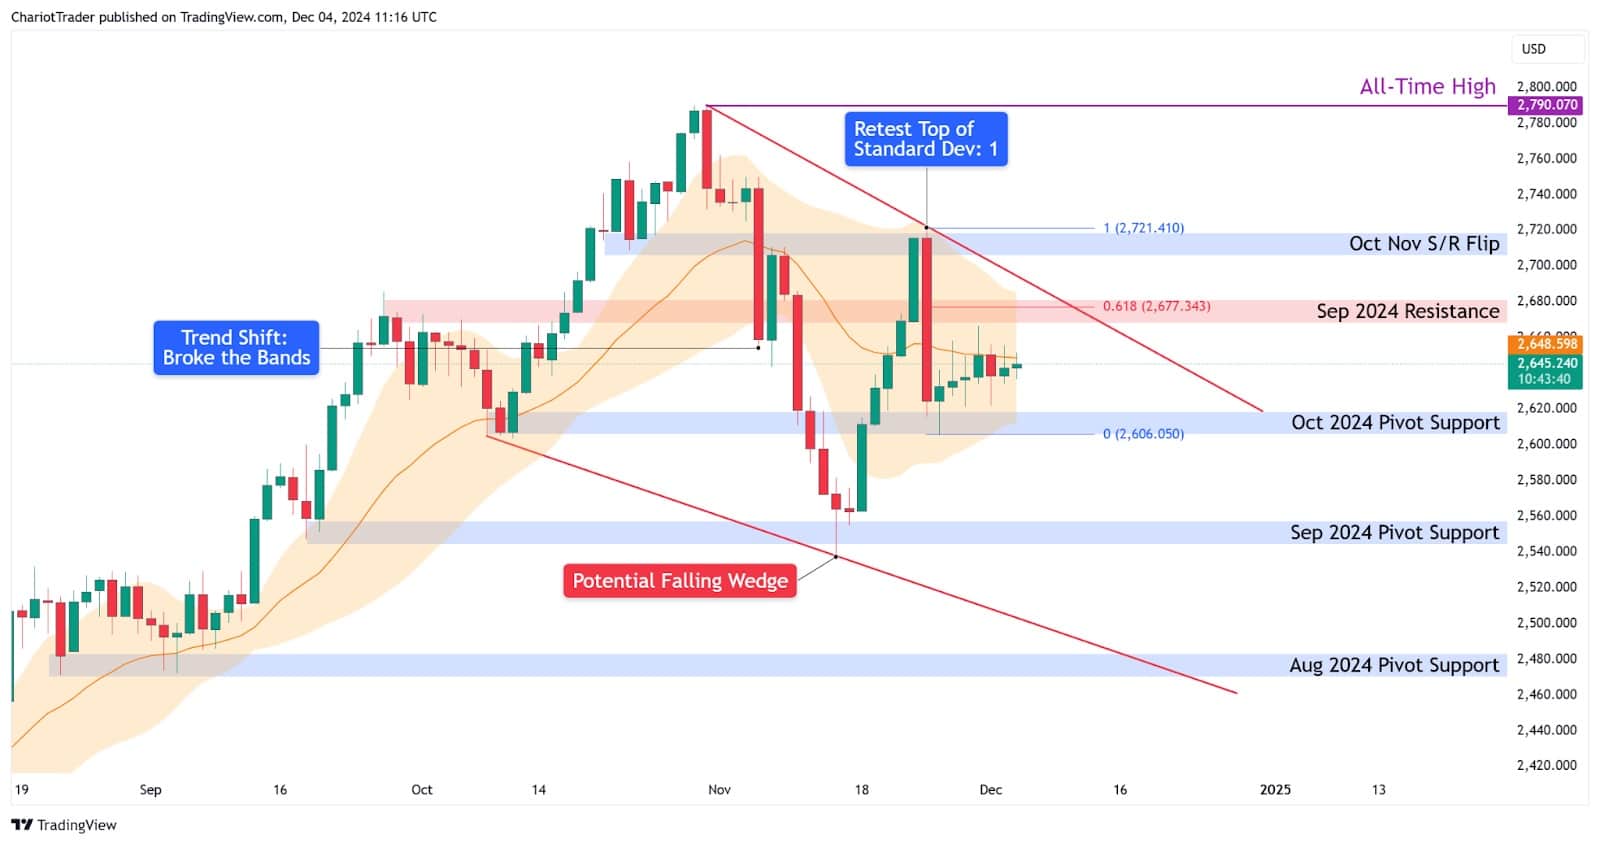
Looking at other indicators, we see the Exponential Moving Average-20, marked by the orange line in the chart, acting as a decent support for the uptrend of Gold from September to October. By applying it as the midline within a Bollinger Bands® – with standard deviation set to 1, we’re also able to filter out false signals whenever the price breaks the EMA-20.
Notice how in the Gold (XAU/USD) chart, Gold broke the Daily EMA-20 late November, only to be rejected by the top of the Outer Bands. This helps add validity that Gold is currently in a downtrend.
Prices to Watch
| Support levels to watch on Gold: 1. Oct 2024 Pivot Support – Approx. $2605 to $2619 2. Sep 2024 Pivot Support – Approx. $2544 to $2558 3. Aug 2024 Pivot Support – Approx. 2470 to $2484 |
| Resistance levels to watch on Gold: 1. Sep 2024 Resistance – Approx. $2668 to $2682 2. 61.8% Fibonacci Resistance – Approx. $2677 3. Oct Nov S/R Flip – Approx. $2706 to $2719 4. All-Time-High (Ultimate Test) – $2790.070 |
Bottom Line
If Gold cannot break above $2720 to change the market structure, then we may continue in this downtrend for the rest of December. The highs and lows in the chart also mark out a potential Falling Wedge pattern, which could bring us to as low as ~$2480 before a major bounce occurs.
Should the price of gold creep higher, the Sep 2024 Resistance Zone ($2668 – $2682) serves as an excellent price zone to watch for a short position. It also aligns with the top of the Bollinger Bands, and the 61.8% Golden Fib Retracement Level.
Alternatively, should Gold close above the Sep 2024 Resistance, hold the price zone, and come back for a retest – we may see further continuation to the upside. This scenario marks a possible retest of the upper trendline, but note that it would also invalidate the Falling Wedge, as there was no 5 wave consolidation within the pattern.
In such a scenario, the $2720 price level and the All-Time Highs at $2790 would serve as resistance zones to test Gold’s ability to move even higher.
You may also be interested in:


