Written by:


- Chart of the Day
- October 9, 2024
- 2 min read
Gold Flips Temporarily Bearish on 4H Timeframe
Gold has temporarily fallen from $2650, and is now potentially threatening a break of the $2,600 price zone. Though this break of structure is visible on the Daily timeframe, it is most prominent and actionable on the 4H timeframe – without further ado, let’s get into it.
Bearish Technical Factors on the 4H Gold Chart
Gold, or XAUUSD, has fallen as low as $2,604.70 as of the last 24 hours. This is due to a massive red candle formed on the 4H and Daily timeframe on Tuesday, October 8th.
With this price action, the gold price has officially broken its 20 and 50 Exponential Moving Averages on the 4H timeframe – with the former EMA crossing the latter to the downside (indicating a trend shift).
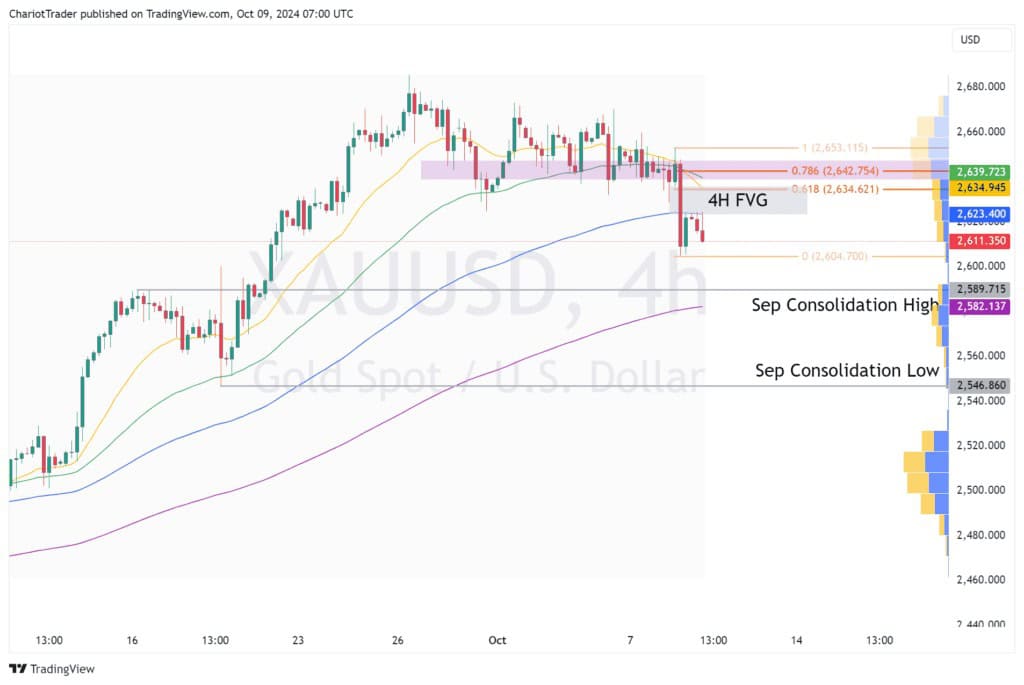
Observing key price levels, we can find several resistances lining up:
- Fibonacci retracement from the recent pivot high ($2,653.11) to the recent pivot low ($2,604.70)
- 0.618 Retracement at approx. $2,634.62
- 0.786 Retracement at approx. $2,642.75
- Anchored Volume Profile starting from August 16th, 2024 ($2,500 region)
- High Volume Node at approx. $2,640 to $2,650, aligns with 786 retracement
- High Volume Node at approx. $2,640 to $2,650, aligns with 786 retracement
- Fair Value Gap on 4-Hour Timeframe at approx. $2,623.32 – $2,636.10
These resistances could potentially push the price of Gold lower, towards the support levels formed in September of 2024:
- September Consolidation High at approx. $2,589.72
- Aligns with High Volume Node
- 4H-EMA-200 is slowly creeping up to meet this area
- September Consolidation Low (Pivot Low) at approx. $2,546.86
- Aligns with Daily EMA-50
What happens if Gold Breaks $2,600?
If the price of Gold cuts through $2,600 and does not bounce from the September Consolidation High, we will see a break of the Daily EMA-20, which is a significant dynamic support/resistance level for Gold.
However, a more significant level lies below at approximately $2,550 – the September Consolidation Low (Pivot Low), and the Daily EMA-50. Looking back historically, the Daily EMA-50 has always been an even more significant level for XAUUSD.
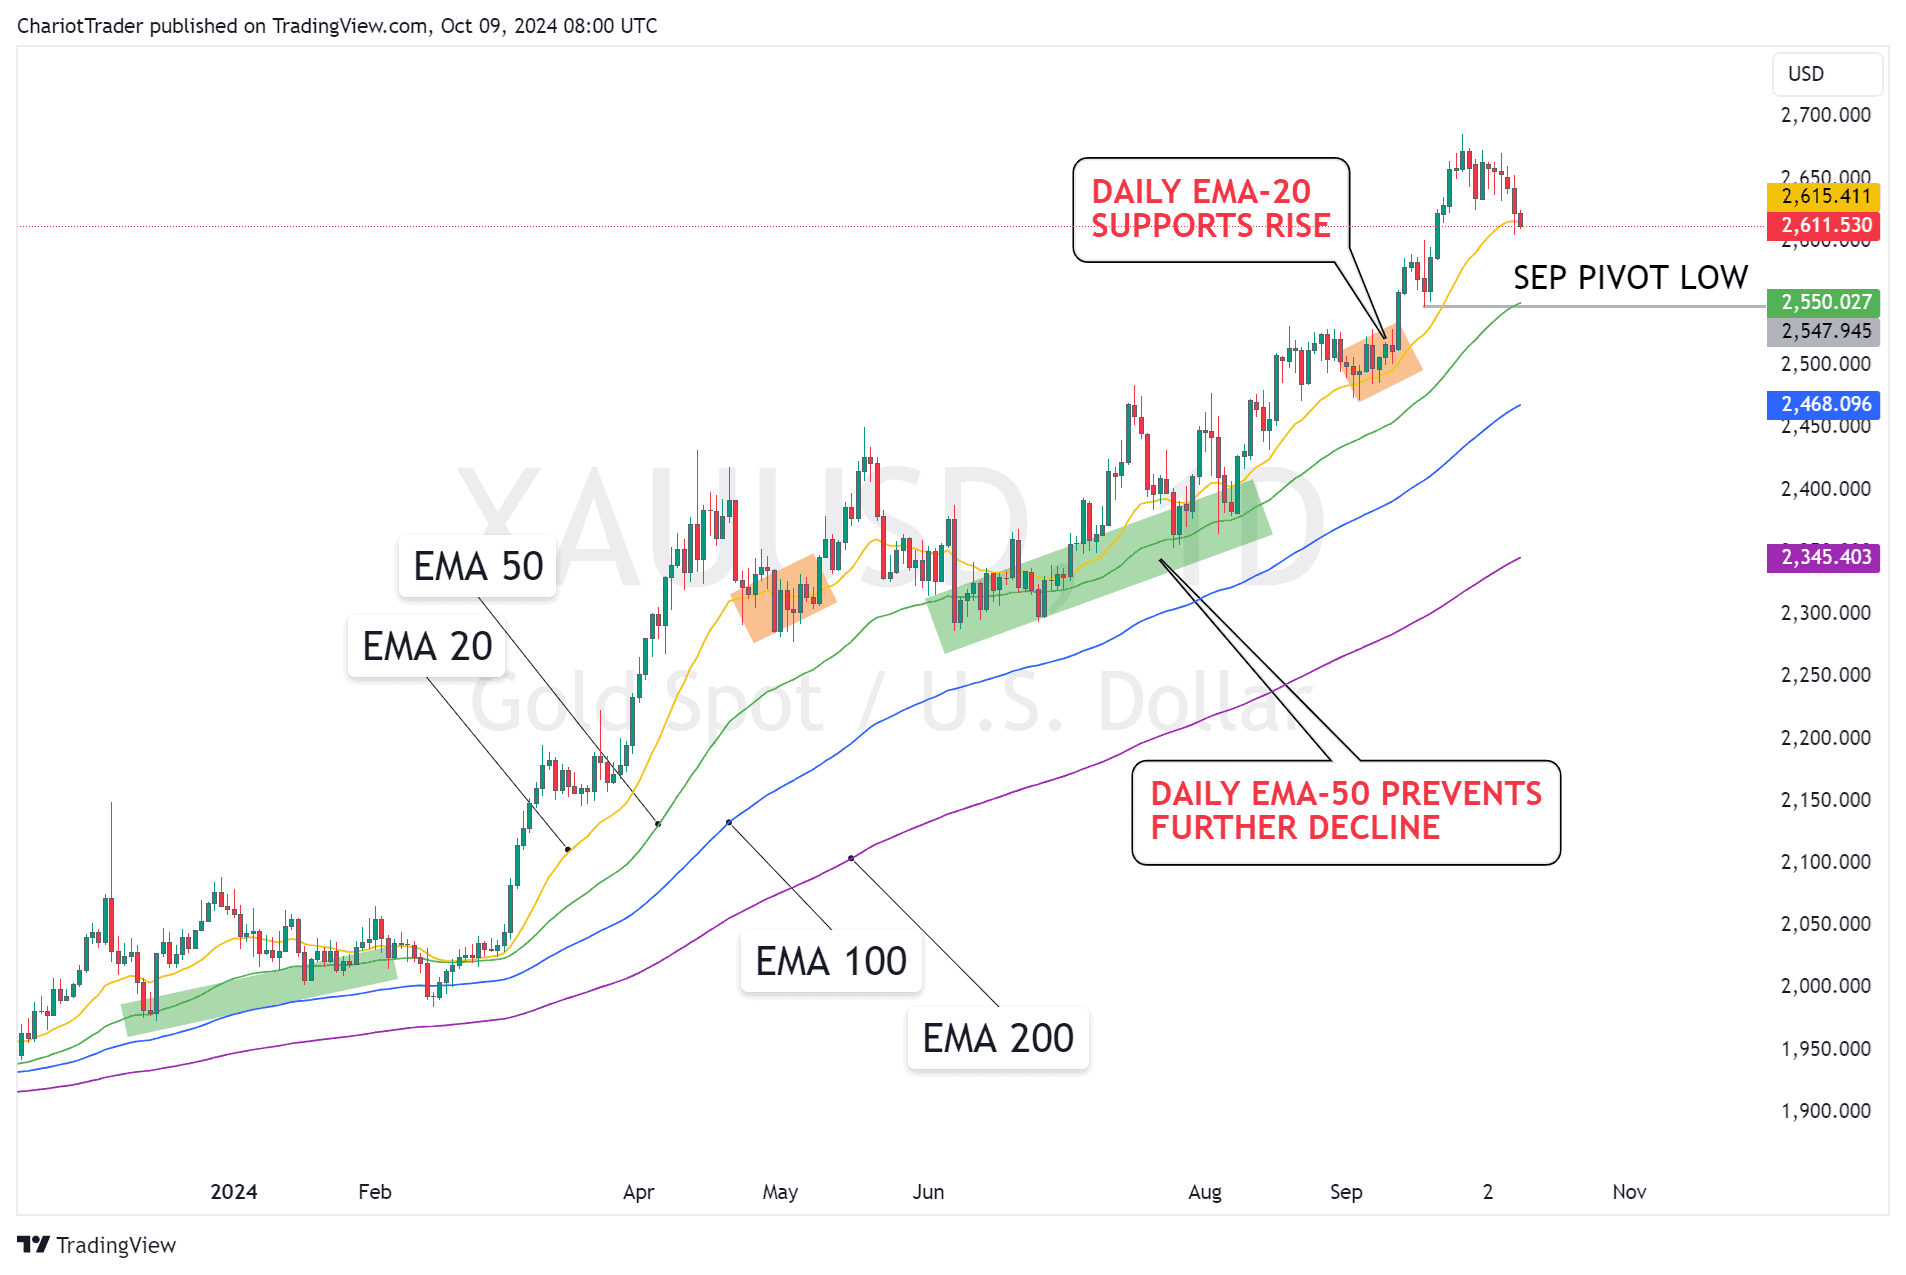
While the Daily EMA-20 supports the continued parabolic behavior on Gold, the Daily EMA-50 has served as a critical accumulation zone for Gold, allowing it to find its footing to move even higher.
Gold’s price action may depend on whether these two dynamic levels hold or break, within the next coming days or week.
You may also be interested in:
3M Stock Teases Pullback After Break of Falling Wedge
RBNZ Rate Cut Showdown – Cuts 50 BPS