- Chart of the Day
- December 17, 2024
- 3 min read
Mixed Signals: GBPUSD Bear Flag with Hidden Bullish Divergence

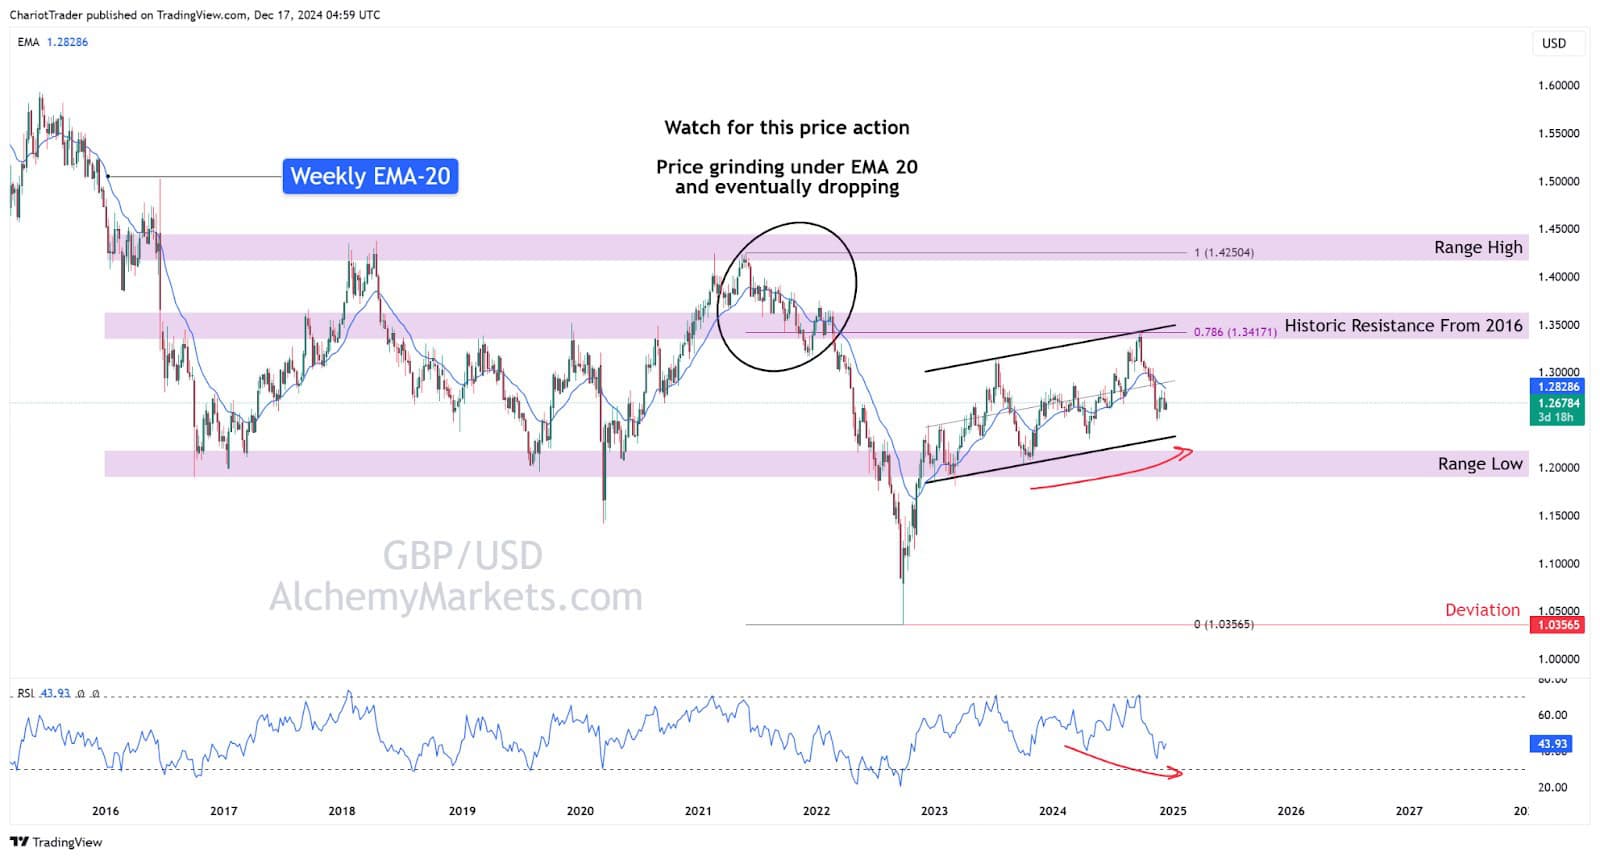
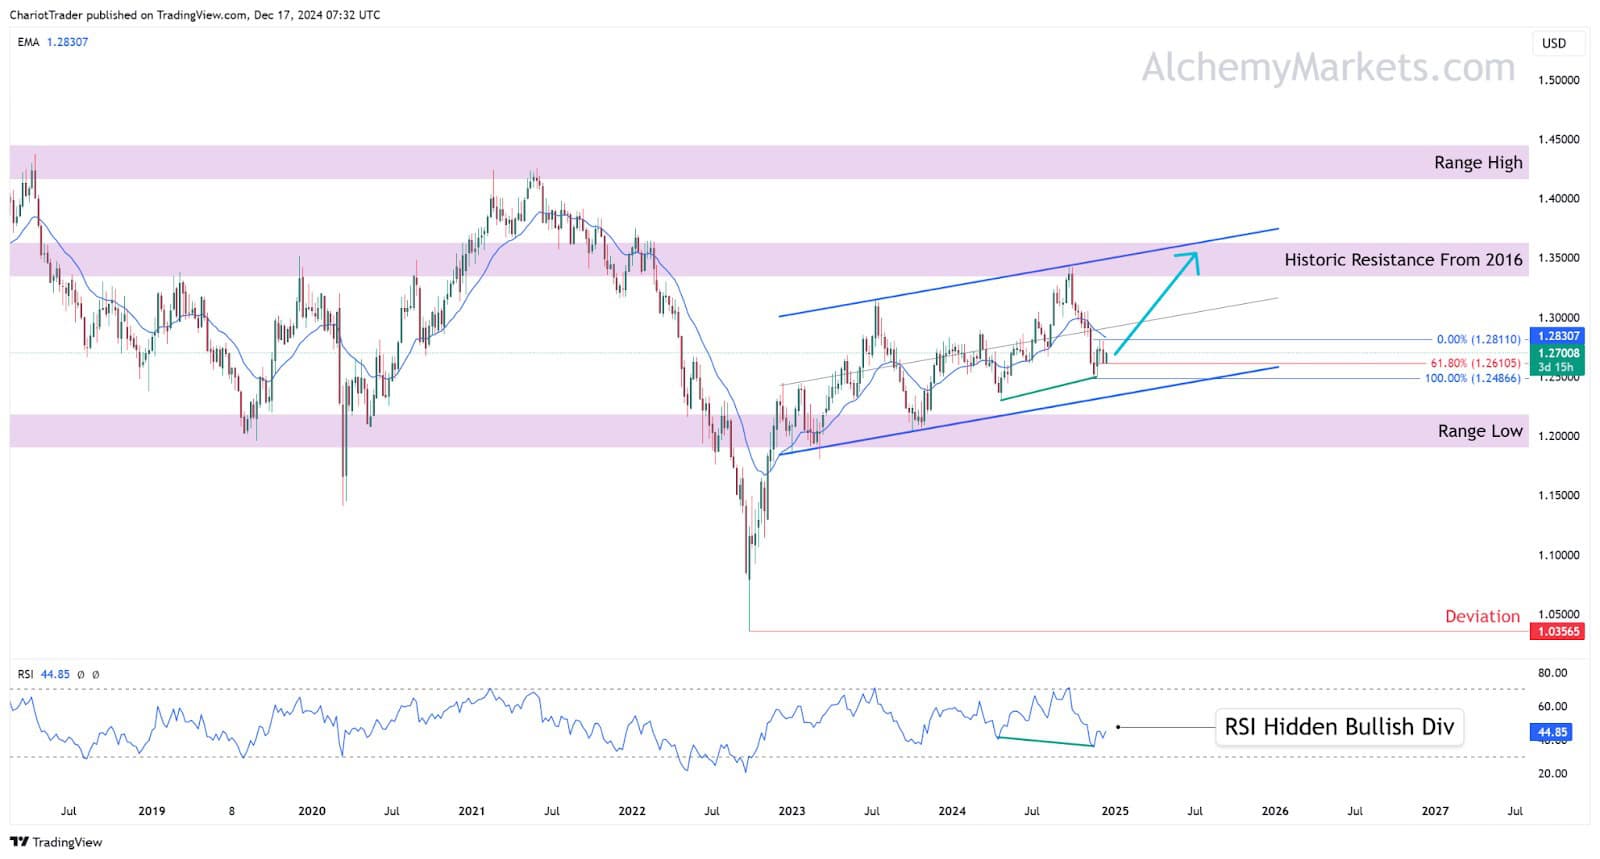
GBP/USD is currently moving within a rising parallel channel on the weekly timeframe.
This consolidation comes after a substantial downswing from 2021 to 2023, making this developing price action a potential bear flag.
However, signs of a hidden bullish divergence also signal at upside continuation, producing mixed signals on the GBP/USD chart.
With UK’s Claimant Count (Unemployment Claims), and Average Earnings Index data released today, GBP/USD could be set to move — finally picking a side in the short term and mid term.
Key Data Releases Today
Claimant Count Change measures the change in the number of people claiming unemployment benefits during the previous month.
The latest data shows that only 300 more people claimed unemployment benefits in November, compared to an increase of 26,700 in the previous month. This suggests a slowdown in unemployment, which is a positive sign for the British Pound as it reflects a potentially improving labor market.
| Data | Actual | Forecast | Previous |
| Claimant Count Change | 0.3K | 28.2K | 26.7K |
Average Earnings Index 3m/y measures the 3-month moving average of how much businesses are paying their employees.
The latest data shows that average earnings have risen by 5.2%, greater than the 4.6% forecast. This is yet again another positive sign for the GBP/USD, as this is a leading indicator for inflation, which the BoE (Bank of England) could reference to justify rate holds or rate hikes. When businesses pay more wages, the costs are passed down to the consumer in the form of higher prices.
| Data | Actual | Forecast | Previous |
| Average Earnings Index 3m/y | 5.2% | 4.6% | 4.3% |
Potential Upswing Towards Channel Highs
Given the positive news for GBP/USD’s growth, the Forex pair may begin to move higher towards a historic resistance zone formed since 2016, between $1.3338 to $1.3635.
Technical ideas supporting a potential upswing include:
- GBP/USD has risen after testing a local bullish 61.80% Fibonacci Retracement.
- Weekly Hidden Bullish Divergence on the RSI indicator, signalling a bullish continuation and a potential short squeeze.

Potential Resistances Overhead
The most important resistance up ahead are a potential larger descending channel’s upper trendline, which is coming lower to meet the Bearish Golden Pocket (Fib retracement) between $1.2960 – $1.3072.
Then, if this level is broken, the price could potentially meet some resistance at the previous pivot high at $1.3434, and amidst the broader historic resistance zone of $1.3338 to $1.3635.

Closing Thoughts
Should GBP/USD continue to rise, overcoming these key resistances will be crucial for the pair to reach the upper channel trendline, which would align with historic resistance from 2016.
You may also be interested in:


