


Written by:

- Chart of the Day
- September 24, 2025
- 2 min read
Copper vs Gold Ratio Hits 5 Decade Lows
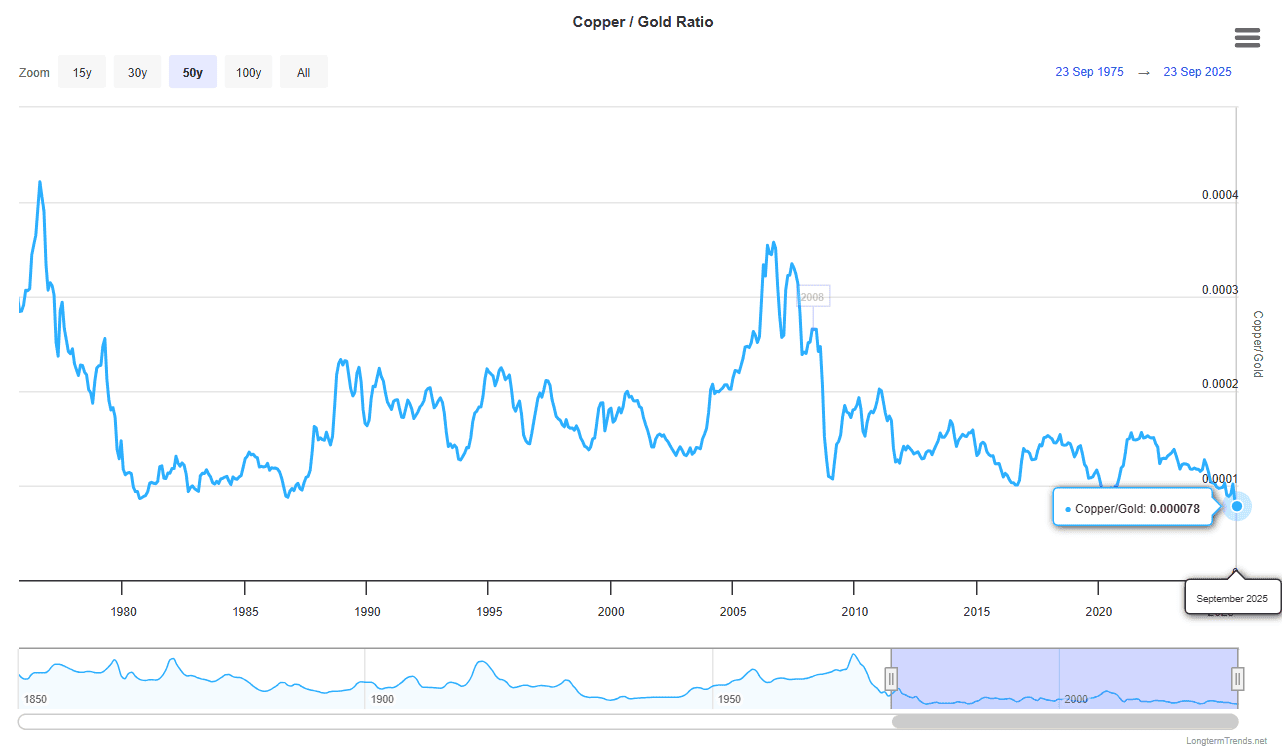
The Copper/Gold ratio has fallen to its lowest point in 50 years, highlighting just how defensive markets have become. Since the 1970s, this ratio has been a reliable guide to the balance between growth confidence (copper) and safety demand (gold). When copper rises relative to gold, investors are leaning into industrial expansion. When gold dominates, fear and risk aversion set the tone.
A Ratio with History
- In 1980, during the stagflation era, the ratio slumped to 0.00086 before rebounding as growth picked up.
- In 2008, it collapsed alongside the global financial crisis to 0.00110, only to surge back during the post-crisis recovery.
- In 2020, it dipped again during COVID to 0.00084 but recovered quickly as stimulus and reopening boosted demand.
Today’s levels are lower than all of those episodes, slumping down to 0.00078. The message is clear: markets are pricing in deep uncertainty, with gold holding its safe-haven bid while copper struggles to reflect any sustained industrial demand.
What Would Change the Picture?
For the ratio to recover, copper needs a growth story — whether that’s stronger Chinese stimulus, firmer US data, or structural demand from electrification. Otherwise, the ratio risks staying pinned at historically depressed levels, signalling prolonged caution.
Copper’s Technical Path (XCUUSD Daily)
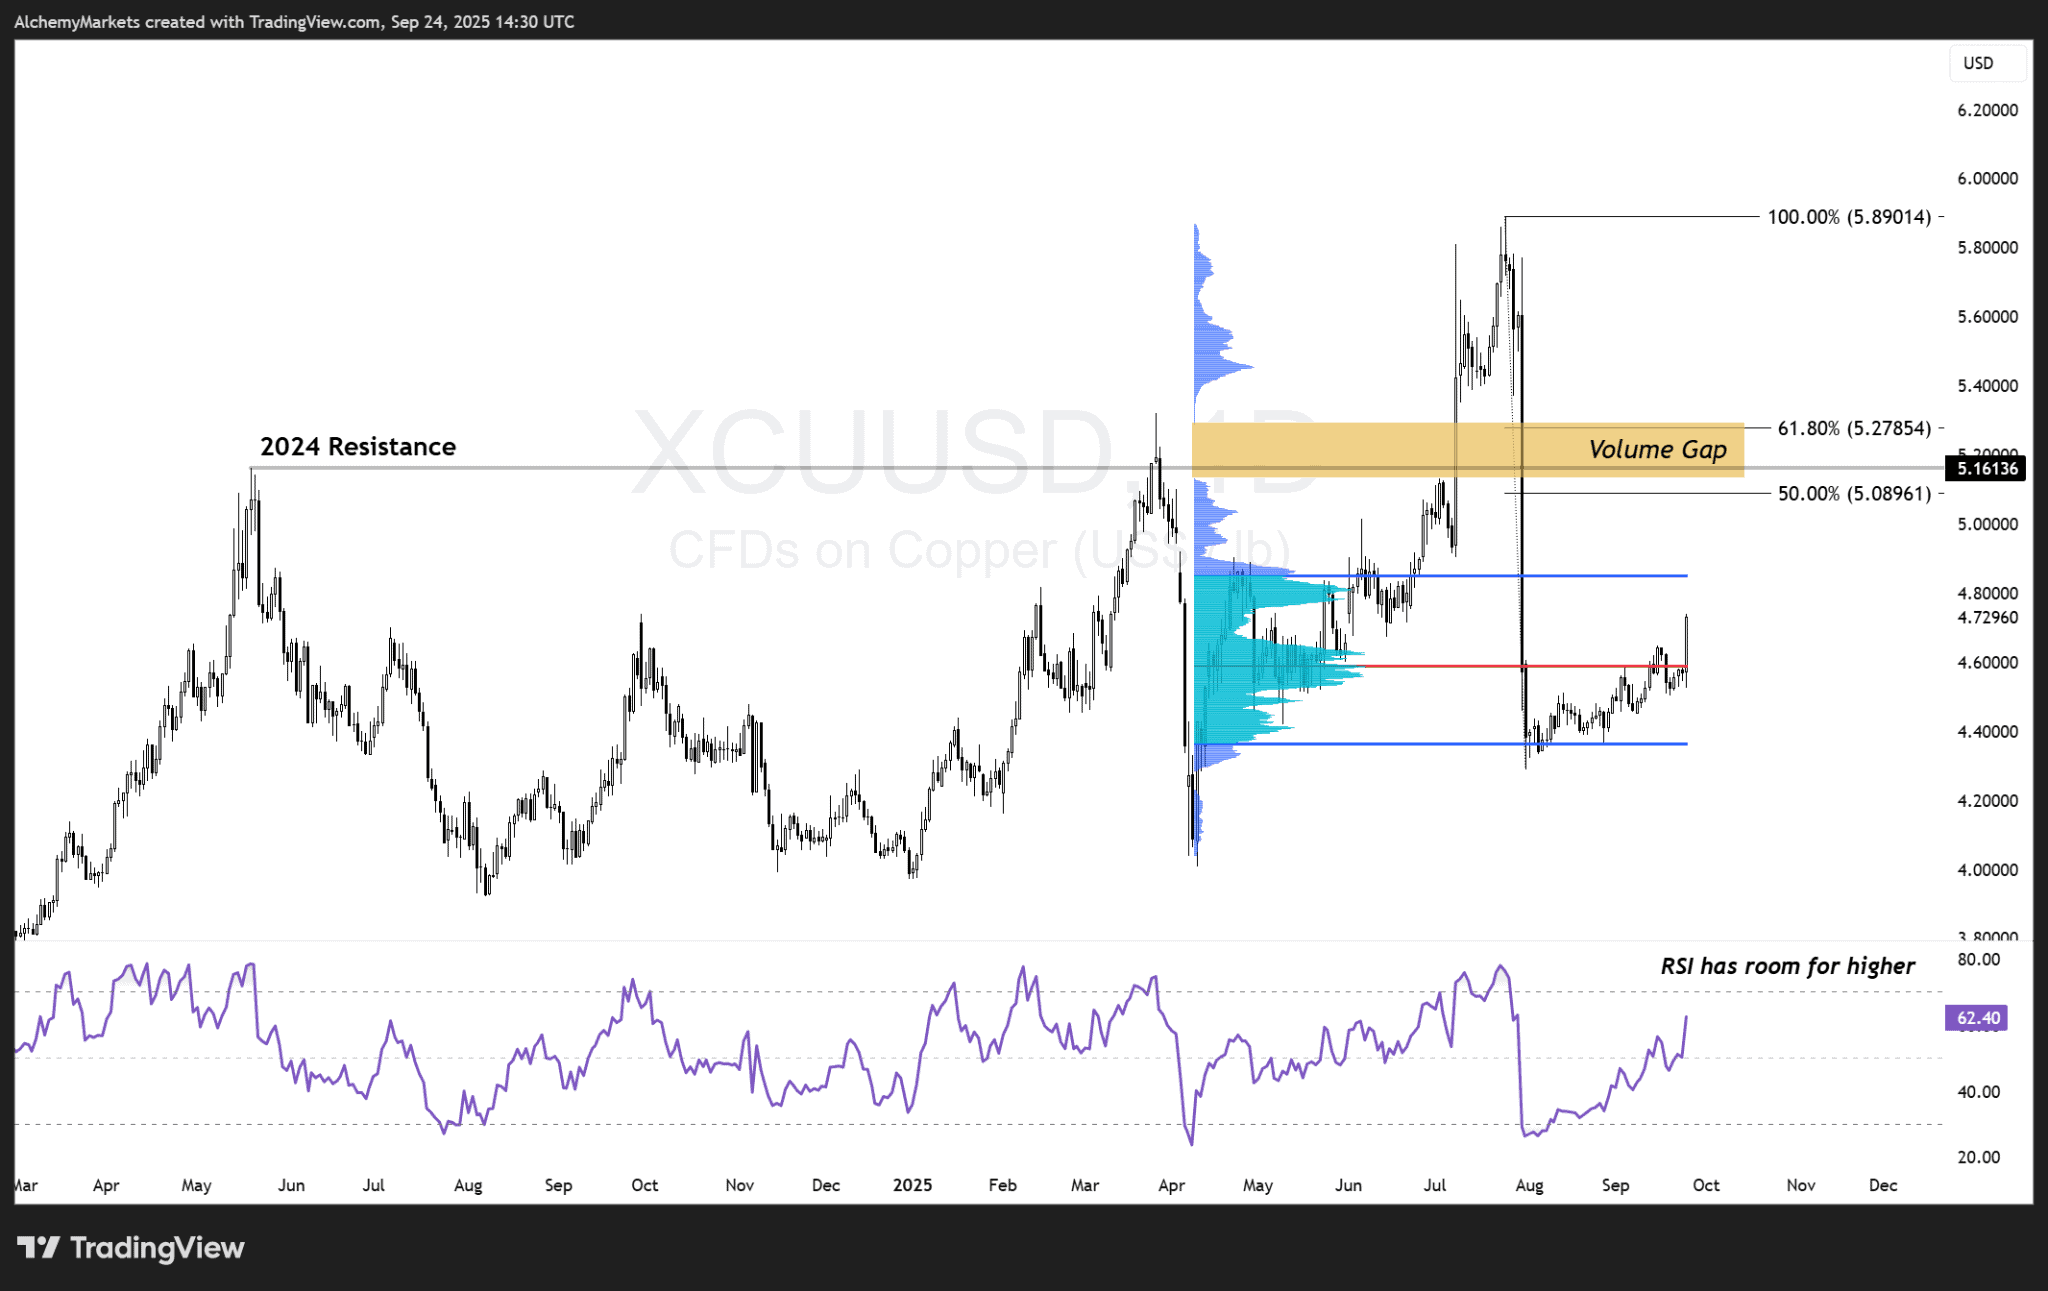
The copper daily chart provides the tactical detail in the short term:
- Price rebounded after a failed auction at the FRVP Value Area Low around $4.37, showing demand at the base.
- $4.85 (VAH) is the first resistance.
- Above lies the critical $5.16–$5.28 zone, where 2024 resistance converges with the 61.8% Fibonacci retracement and a major volume gap from the July 30 sell-off.
- If copper reclaims this gap, it would mark a decisive bullish shift and could pull the Copper/Gold ratio off its lows.
RSI momentum supports the bullish case, sitting in the low 60s with room to extend.
The Takeaway
The Copper/Gold ratio is sending the strongest risk-off signal in 50 years.
That doesn’t guarantee more downside, but it shows how much pessimism is already priced in. History suggests such lows often set the stage for sharp reversals, and copper’s chart now offers a roadmap for how that might unfold.


