- Chart of the Day
- November 28, 2024
- 4 min read
Global M2 Supply Chart Signals a Drop to $70,000 on Bitcoin

Over the past five days, Bitcoin has finally seen a much-needed correction after an impulsive run from approximately $66,800 to $99,690 – narrowly missing the widely speculated $100,000 target.
From the new all-time high of $99,690, Bitcoin has dropped by over 8% to $90,835.50. However, the following day (Wednesday), the price bounced back with a 4.22% green candle, creating a bullish engulfing candlestick – a reversal signal worth noting.
If you’ve been in the crypto space for a while, you’ll know this isn’t new. Bitcoin has a tendency to either front-run or overshoot major psychological targets like this.
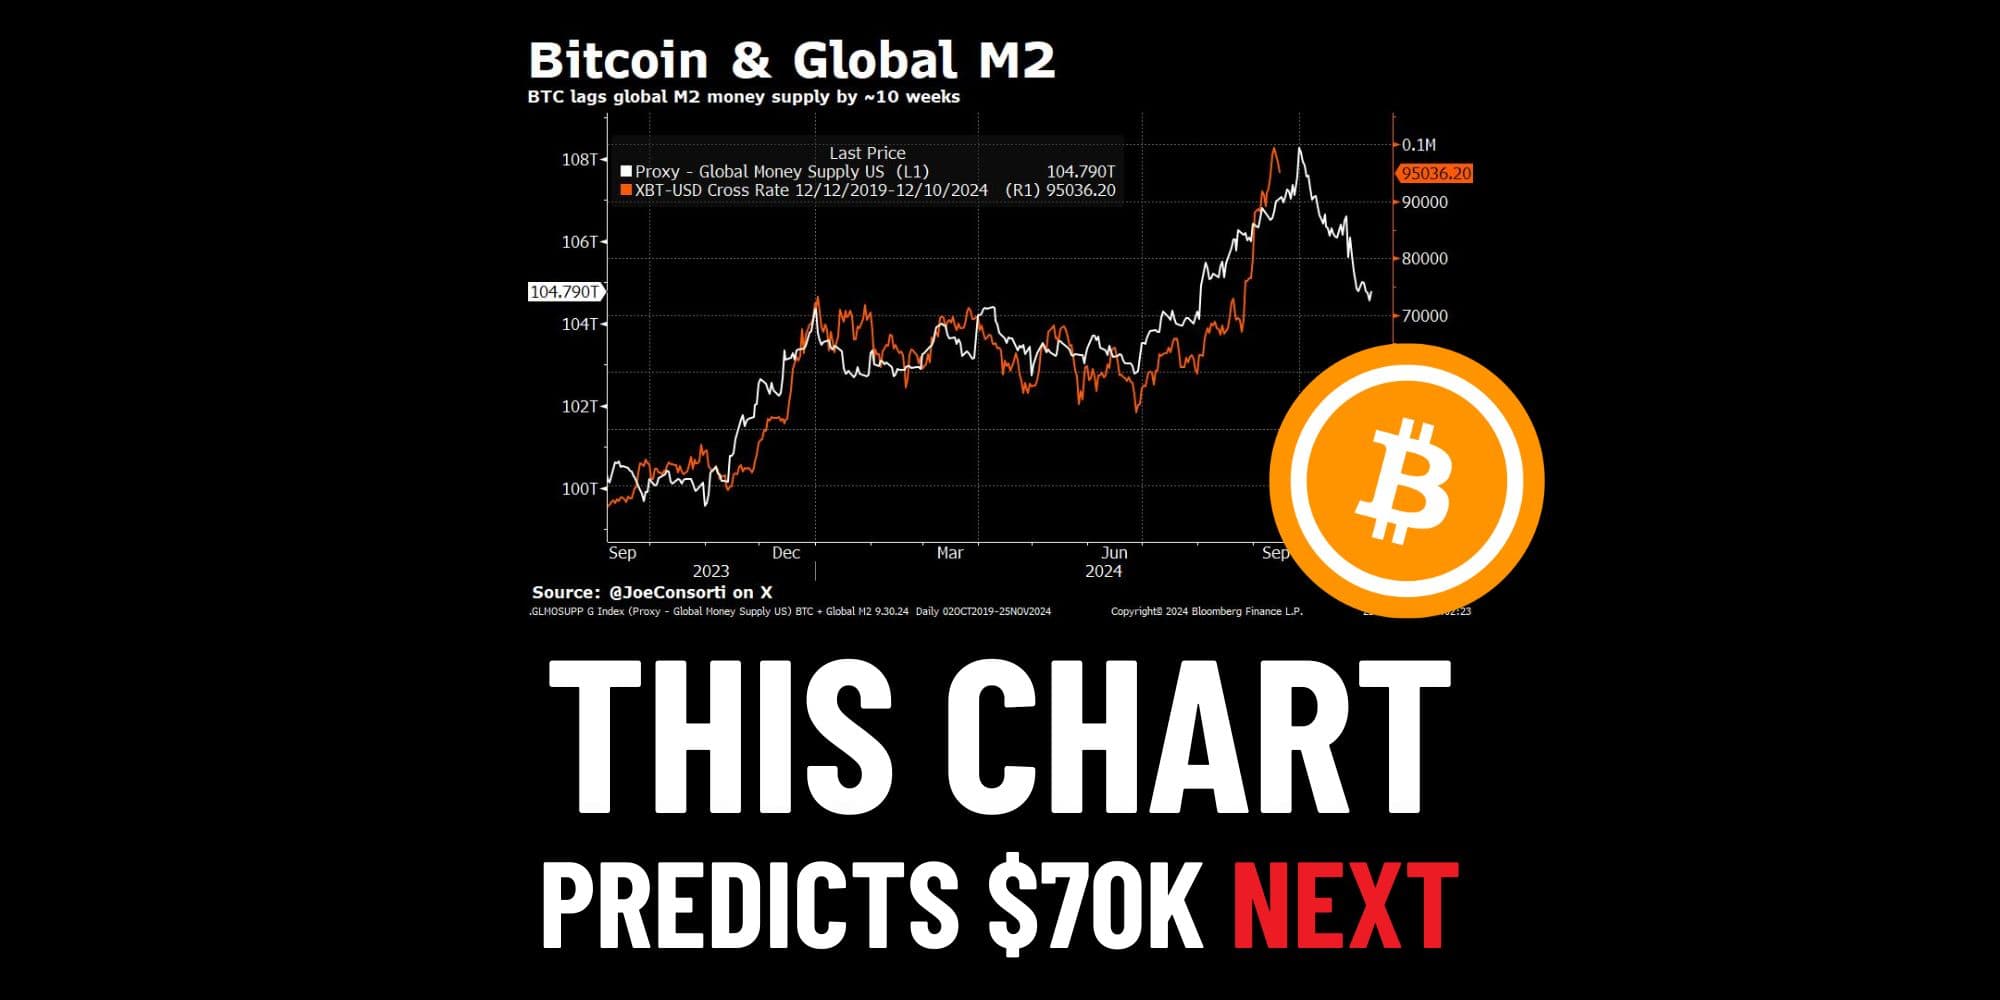
With the hype subsiding, speculation is brewing over the next move. According to analyst Joe Consorti, the Global M2 chart may hint at a larger correction, potentially sending Bitcoin down to sub-$70,000 levels.
How the Bitcoin & Global M2 Chart Works
Bitcoin has tracked global M2 with a ~70-day lag since September 2023.
— Joe Consorti ⚡️ (@JoeConsorti) November 25, 2024
I don't want to alarm anyone, but if it continues, bitcoin could be in for a 20-25% correction.
Global M2 in ⚪️
Bitcoin in 🟠 pic.twitter.com/PlPoaHUoFR
Joe Consorti identified a lagging correlation between Bitcoin’s price and the Global M2 (global money supply):
- When the global money supply increases, Bitcoin tends to rise roughly 70 days later.
- When the money supply decreases, Bitcoin often sees a lagging downturn.
The correlation is based on Consorti’s overlaying of Global M2 and Bitcoin’s price charts using custom scaling. This methodology has drawn scepticism, as the scaling adjustments could artificially align the two datasets. Despite these concerns, Bitcoin has shown signs of mirroring movements in the Global M2 chart since September 2023.
Technical Analysis on Bitcoin Daily Timeframe

On the daily timeframe, Bitcoin’s price movements align with critical support and resistance levels:
| Point of Control Zone Bitcoin has recently bounced from the $91,704.8 zone, identified as the Point of Control using a Fixed Range Volume Profile from the impulsive rally that began on November 4th, 2024. Bearish Fibonacci Retracement The rebound was rejected at the 0.618 Fibonacci Retracement Level ($96,326.80), reinforcing the possibility of a continued pullback. |
If the pullback continues within this uptrend, here are the key levels to watch:
| Daily EMA 20 Currently at $90,413.50, this level often acts as dynamic support in strong uptrends. Bitcoin may retest this zone to regain bullish momentum. Daily Fair Value Gap (FVG) A fair value gap exists between $81,651.3 and $85,205.4, coinciding with the Daily EMA 50 and the 0.5 Fibonacci Retracement Level ($83,249.00). This confluence strengthens the case for a bounce at these levels. Daily EMA 100 At $73,785.50, this level aligns closely with the Global M2’s projected sub-$70,000 correction. A drop to this zone would signal a deeper pullback, but it could offer a significant buying opportunity. |
Evaluating the Global M2 Chart’s Validity
The Global M2 chart offers a compelling macroeconomic perspective, but it shouldn’t be used in isolation. Combining it with robust technical analysis provides a more comprehensive view of potential price movements.
Instances Where the Correlation Worked
| January 2023 – March 2023 An increase in Global M2 during January 2023 coincided with Bitcoin’s significant rally in March 2023, aligning closely with the 70-day lag. |
| June 2023 – August 2023 Following a contraction in Global M2 in June 2023, Bitcoin’s price saw a marked decline in August 2023, again respecting the lag. |
Instances Where the Correlation Fell Short
| September 2022 – December 2022 During this period, Global M2 grew steadily, but Bitcoin remained largely stagnant, failing to reflect the lagging correlation. |
| May 2023 – July 2023 Despite a sharp rise in Global M2 in May 2023, Bitcoin prices showed no significant movement within the expected timeframe, breaking the hypothesised pattern. |
Criticisms of the Global M2 Correlation
| Subjectivity in Chart Scaling The custom scaling applied by Joe Consorti can retroactively adjust the alignment, potentially introducing bias. |
| Overemphasis on Macro Factors While macroeconomic indicators like M2 are crucial, Bitcoin’s price is also influenced by market sentiment, institutional activity, and technological developments. |
Closing Thoughts
Bitcoin remains in a critical zone as it continues its pullback. The interplay between technical levels like the EMA 20, FVG, previous all-time high, and Fibonacci levels will be pivotal in determining the next move. Meanwhile, the Global M2 chart adds an intriguing layer of macroeconomic analysis but should be approached with caution.
As always, trading decisions should be informed by a mix of technical and fundamental analysis to mitigate risks in this volatile market.
You may also be interested in:


