- Chart of the Day
- November 11, 2024
- 3min read
$80K Hit: Bitcoin Creates New ATH and Begins Crypto Bull Run
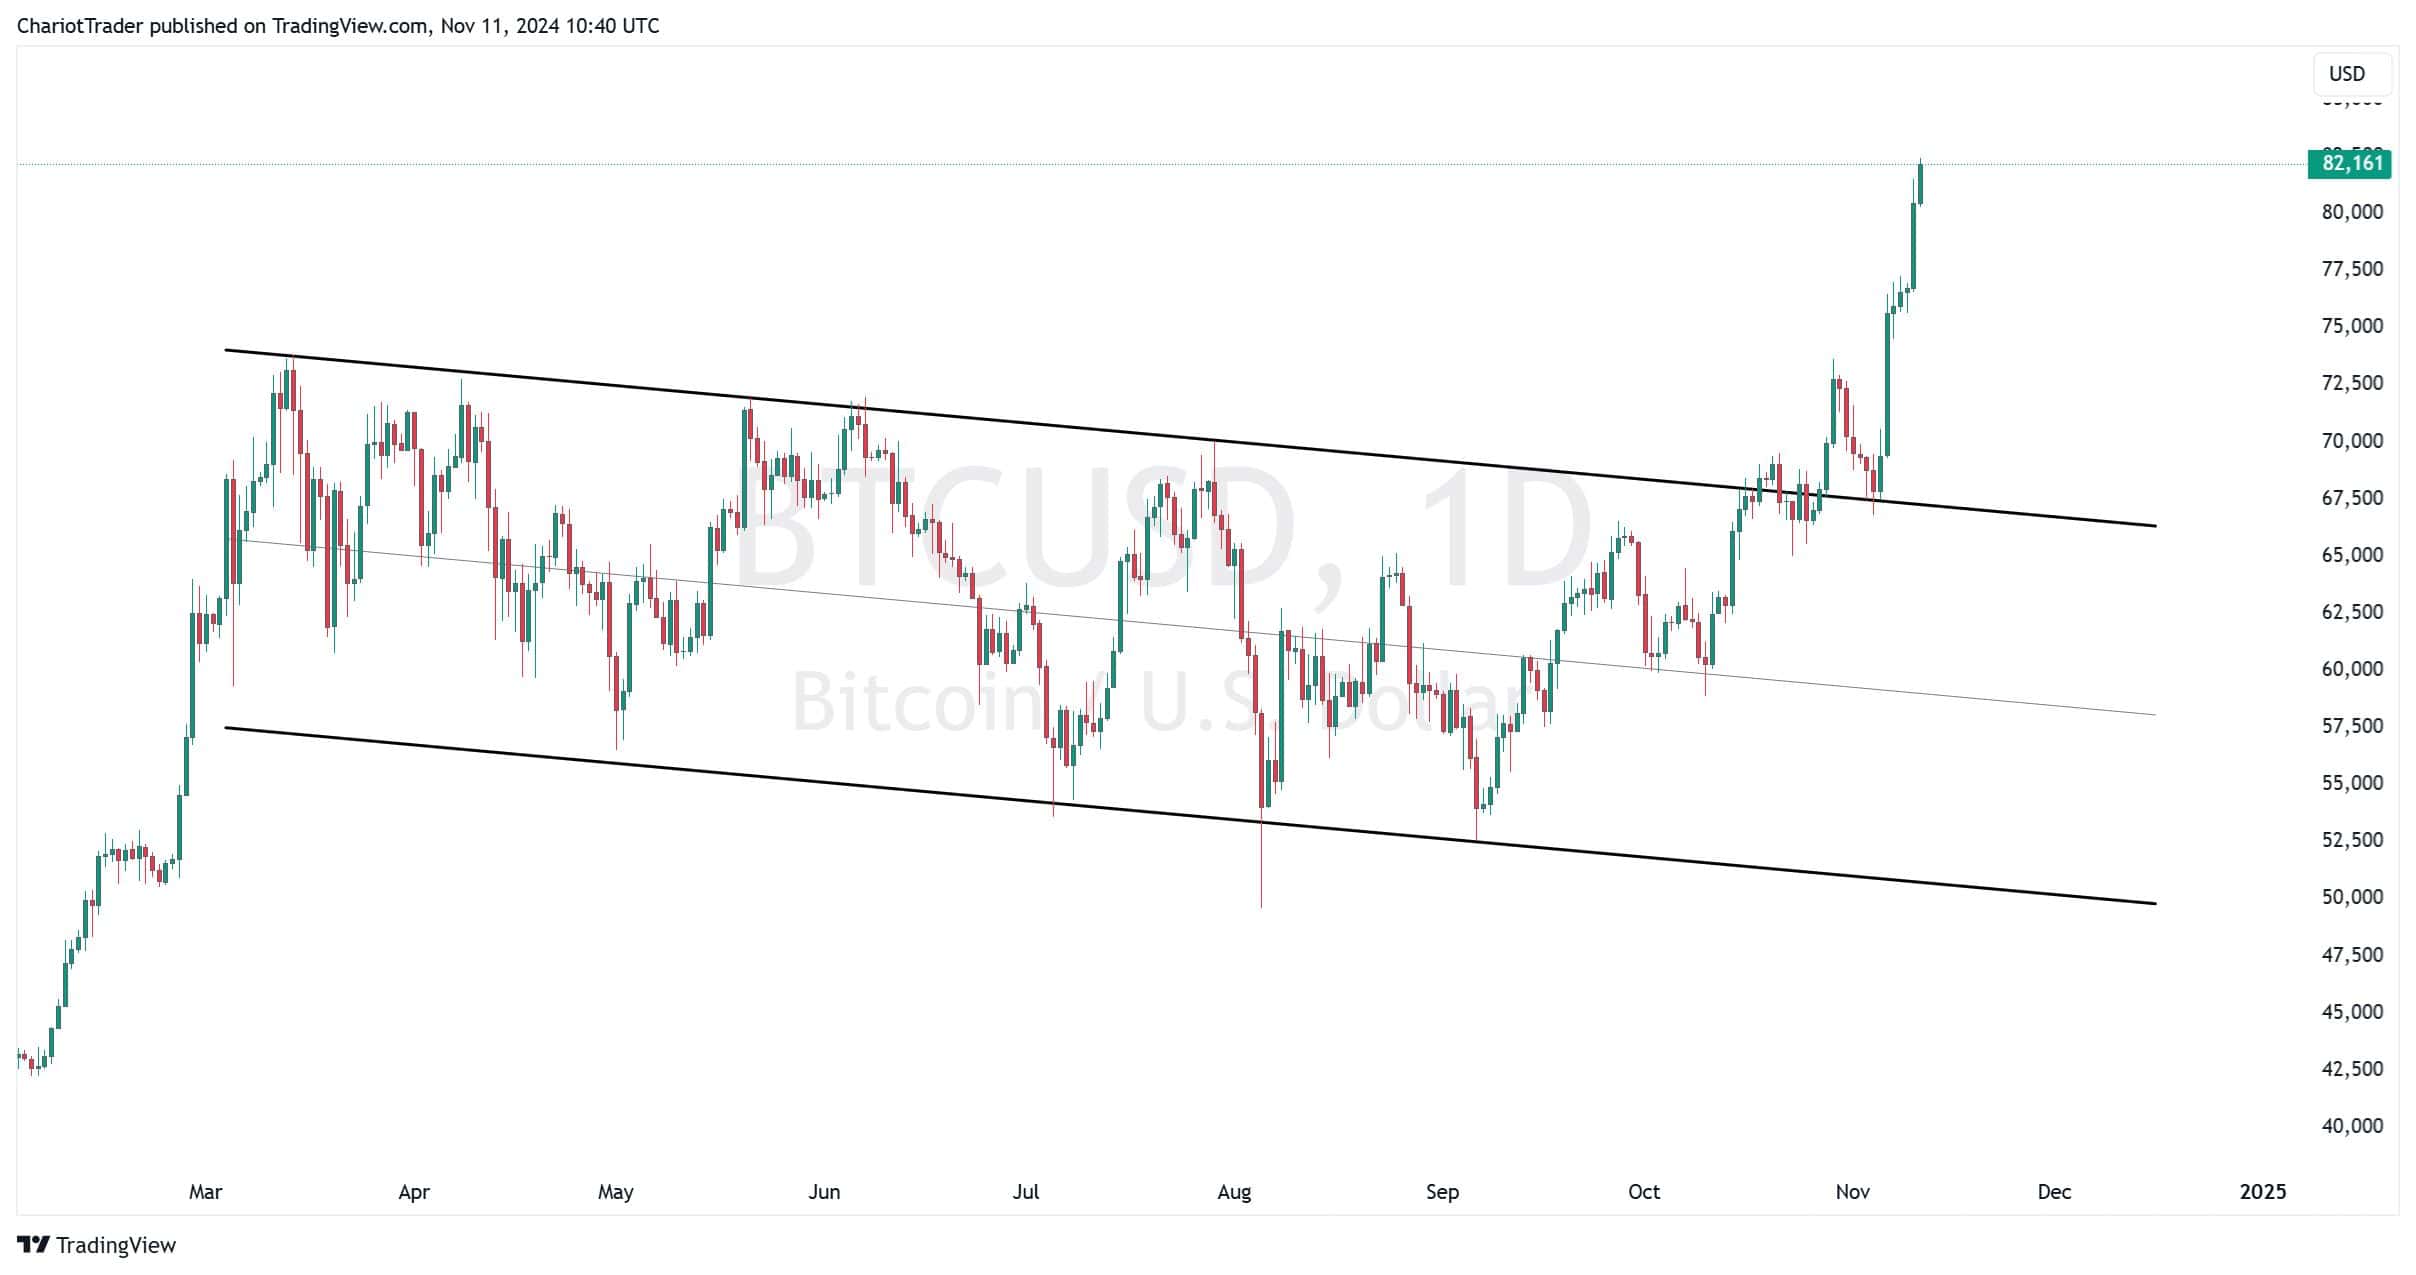
Over the last weekend, Bitcoin broke its $80K milestone – bringing much exuberance to the crypto holders.
This rise comes in tandem with the US president elect, Donald J Trump’s recent re-election. Trump is pro-crypto, and has previously made comments that he’ll make America “the crypto capital of the planet”.
Now that Bitcoin has breached the $80,000 target, what’s next for the king of cryptocurrency? And will the rest of the Altcoin market move up with Bitcoin?
Logarithmic Regression Curve Shows $116K as Key Target
Here’s a neat little tool known only to the most fanatical of Bitcoin hodlers: the Logarithmic Regression Curve (Weekly), which is available on TradingView.
Crypto hodlers (investors) use this tool to get a general idea of where to accumulate, and where to sell after setting the chart to logarithmic scale display.
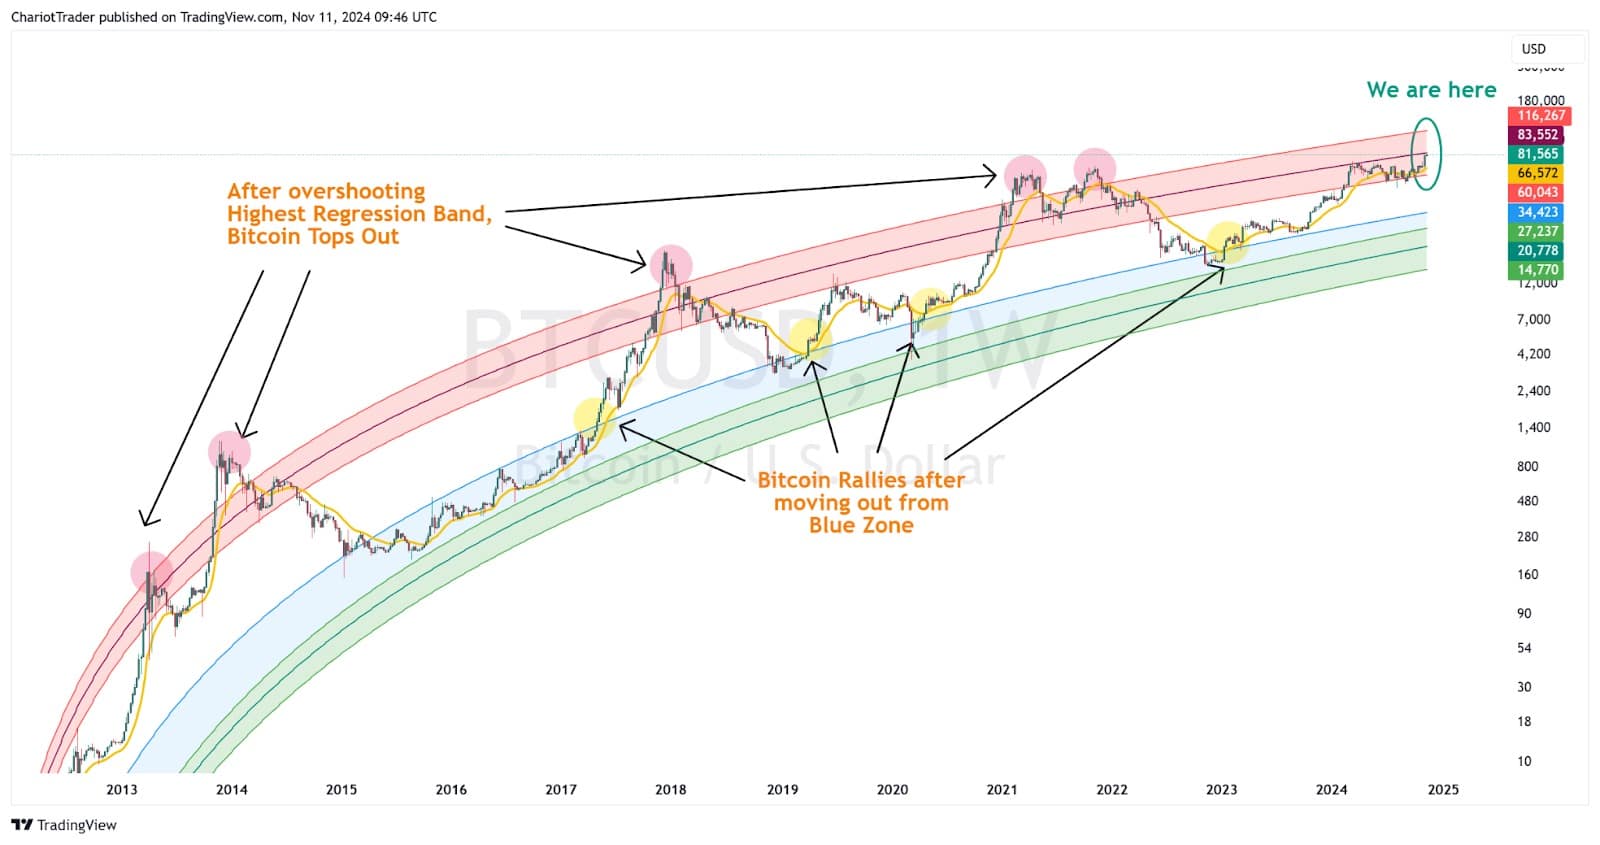
As it currently stands, Bitcoin is approaching the resistance provided by the first red band, at $83,552.
If broken, the next major price target would be the final outer red band, priced at $116,267.
How to use the Logarithmic Curve with Bitcoin
The logarithmic curve consists of three main zones that investors watch closely: blue, green, and red. These zones serve as broad indicators of support and resistance, capturing market trends and helping investors identify optimal times to buy and sell, although they aren’t exact price markers.
Blue and Green Zones:
When Bitcoin’s price enters these zones, investors often begin accumulating through dollar-cost averaging, as this range signals a strong long-term buying opportunity.
Exiting the blue zone and moving into the white (neutral) area typically suggests that a market bottom has been reached, often preceding a significant rally.
Red Zone:
When the price enters this zone, it signals a selling opportunity. The higher Bitcoin climbs within this range, the greater the potential profit for sellers.
If the price overshoots this zone, it often indicates a market top may be approaching. This was in the case in 2013, 2014, 2017 and most recently – 2020 and 2022.
Cup and Handle on Bitcoin
These logarithmic levels also align with several technical factors on the linear price chart of Bitcoin on the weekly level – where a cup and handle can be seen, with targets favouring the $120K region. This also aligns with our Fib Extension targets.
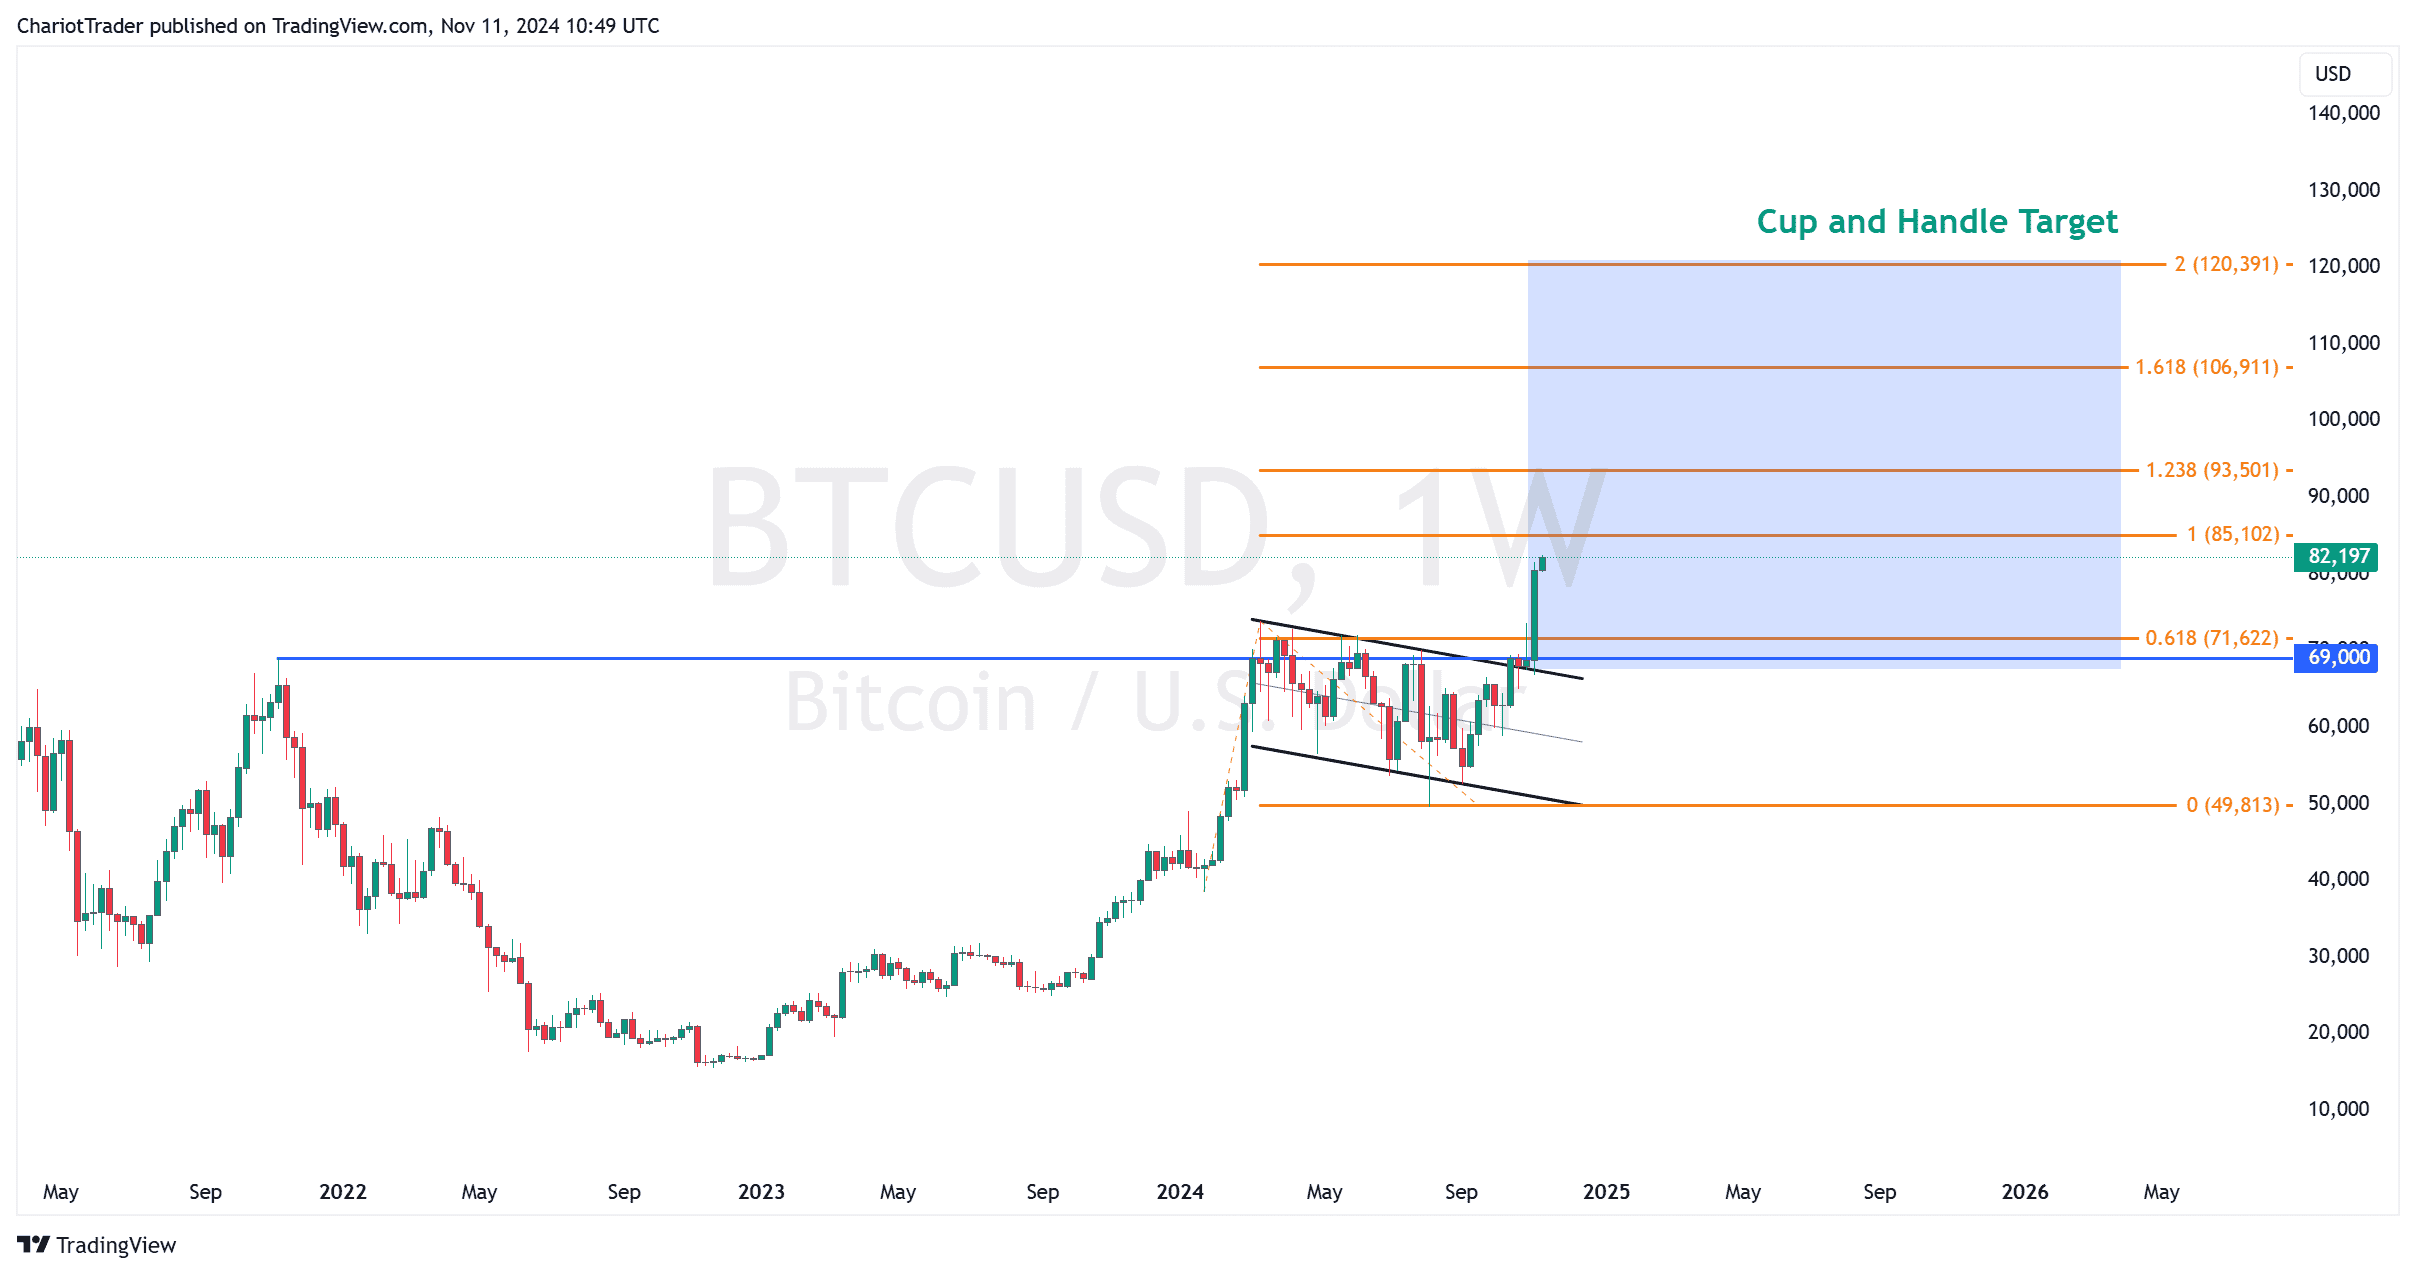
Drawing a Fib Extension from the flagpole of the bull flag, we can get the following price levels, which should act as resistance for the Bitcoin Price:
- Fib Extension 1 at $85,102
- Fib Extension 1.238 at $93,501
- Fib Extension 1.618 at $106,911
- Fib Extension 2 at $120,391
Crypto Fear & Greed Index: Market is in Extreme Greed, but…
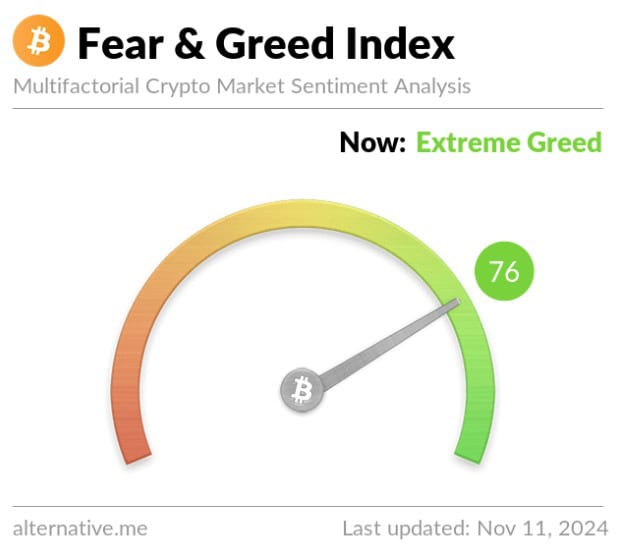
The current Crypto Fear and Greed Index reads 76 – signalling extreme greed. These readings are typical during Bitcoin bull markets, which can stay that way for an extended period of time.
Given that the top band of the logarithmic regression curve has not yet been tagged, this could translate into a temporary retracement before Bitcoin continues to make a further move higher in Q4 2024.
Altcoins are Favouring Upside with Bitcoin’s Rise
Source: Blockchain Center
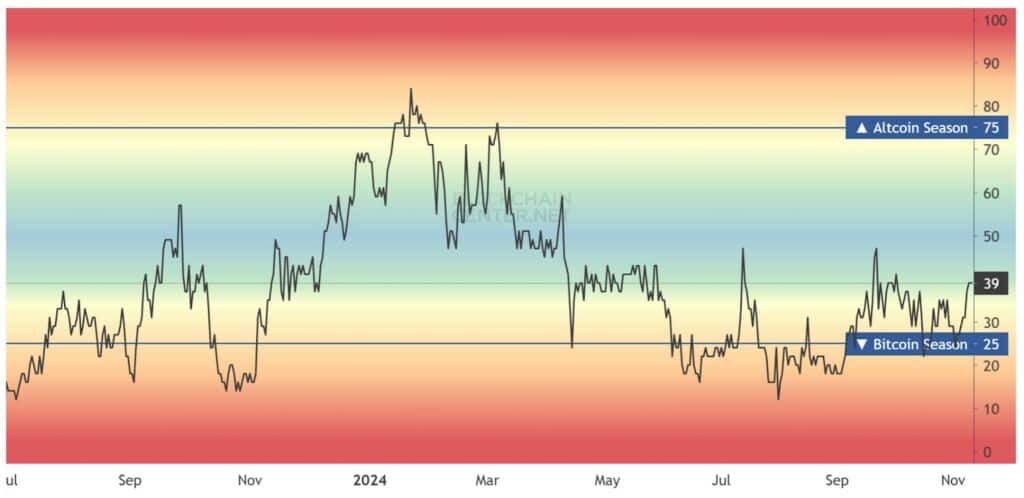
The Altcoin Season index is currently favouring more upside for Altcoin growth. Currently, it sits at a reading of 39, exceeding its previous high at 34.
When the Altcoin Season Index reaches 75 or above, it means that Altcoin season is fully in effect, with most of the Top 50 Altcoins (in market cap) outperforming Bitcoin in gains.
For Altcoin hodlers and traders, these are exciting times, as altcoins are entering an environment where massive upside swings are now more probable.
You may also be interested in:


