
- Chart of the Day
- July 29, 2024
- 3 min read
3M Company Soars By 20%, Falling Wedge on Monthly Timeframe
After a strong Q2 quarterly earnings report release on July 26th (Friday), the 3M stock gapped up by 5%, then continued its rally to form a >20% move higher.
With such a strong bullish opening, what could be in store for the 3M stock this week?
Most importantly, the MMM chart is currently consolidating within a monthly falling wedge pattern, a bullish reversal chart pattern, and we are quickly approaching the upper trendline resistance in this pattern.
Technical Analysis of MMM (July 29th, 2024)
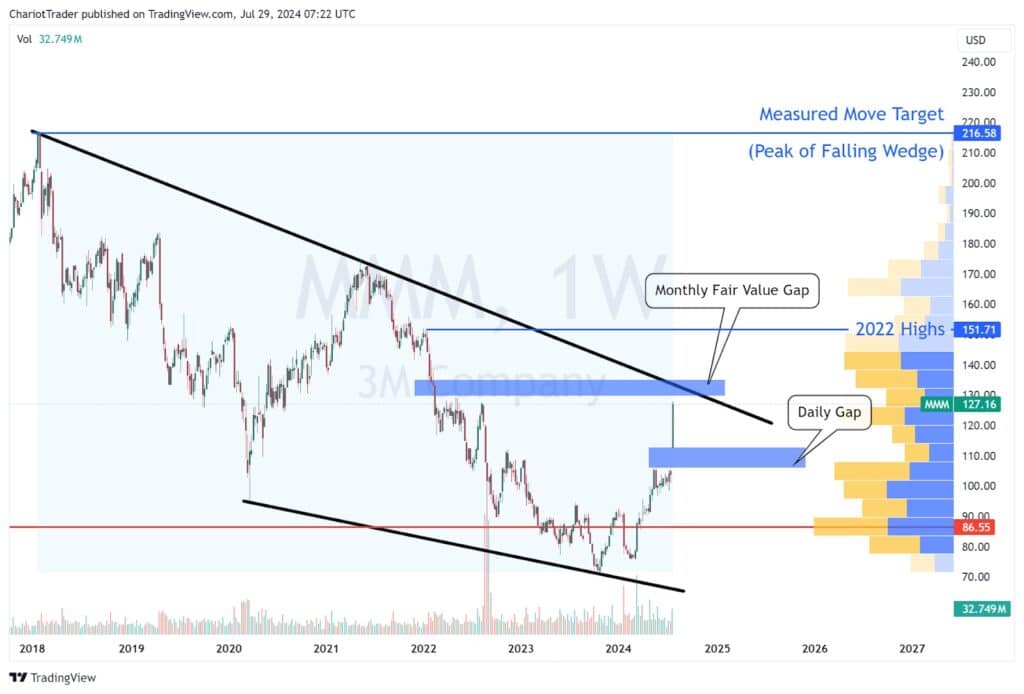
The key resistance to watch on MMM for now is the upper trendline resistance, which coincides with the monthly fair value gap located between $129.70 – $135.10. Having said that, it’s possible for MMM to break past the resistance zone and continue its rally.
In the case of a break and close above the monthly falling wedge, the measured move target would be $216.58, marking a move of over 8,000 pips.
On the flipside, if we do see a reaction from this significant resistance level, MMM could move lower to test the daily gap formed from July 26th for a bounce. This range is between $106 – $112.80.
Key Technical Levels to Watch:
- Falling wedge upper trendline: Approximately $129.70 – $13.50
- 2022 Highs: Approximately $151.71
- Daily Gap: Approximately $112.8 – $105.99
Is the MMM Chart Bullish or Bearish?
Going over to the monthly chart, we’ll see that MMM has formed a gigantic green monthly candle. If we can close the move green, without falling below the daily gap, then 3M should remain bullish.
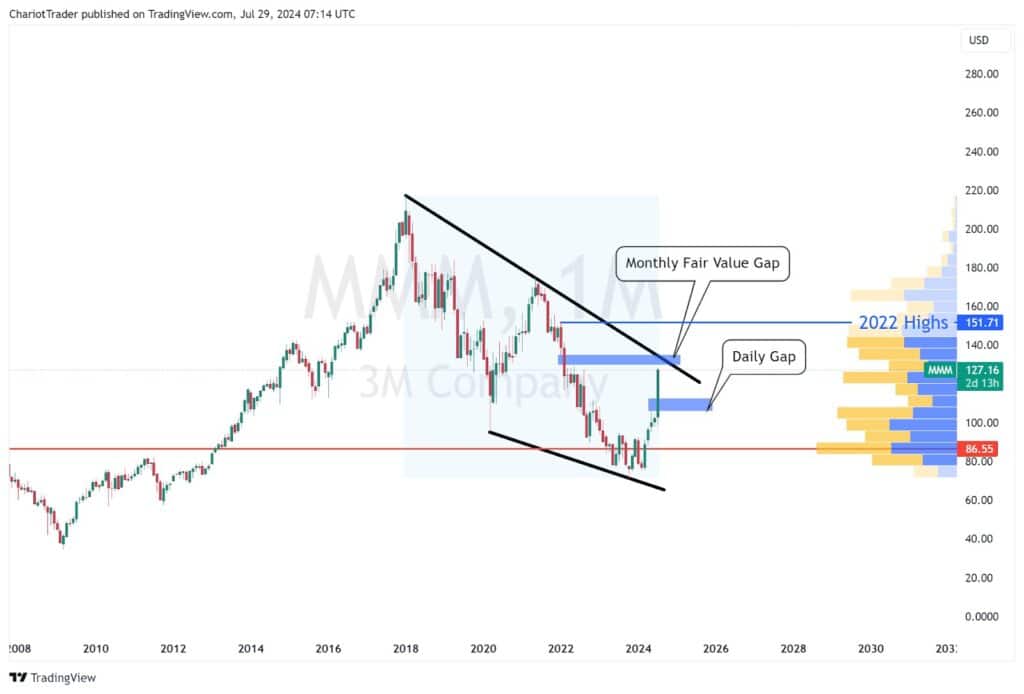
Moreover, the 3M stock appears to have completed an ABC Zig-Zag pattern, potentially starting the first leg of Elliott Wave 5-wave impulse.
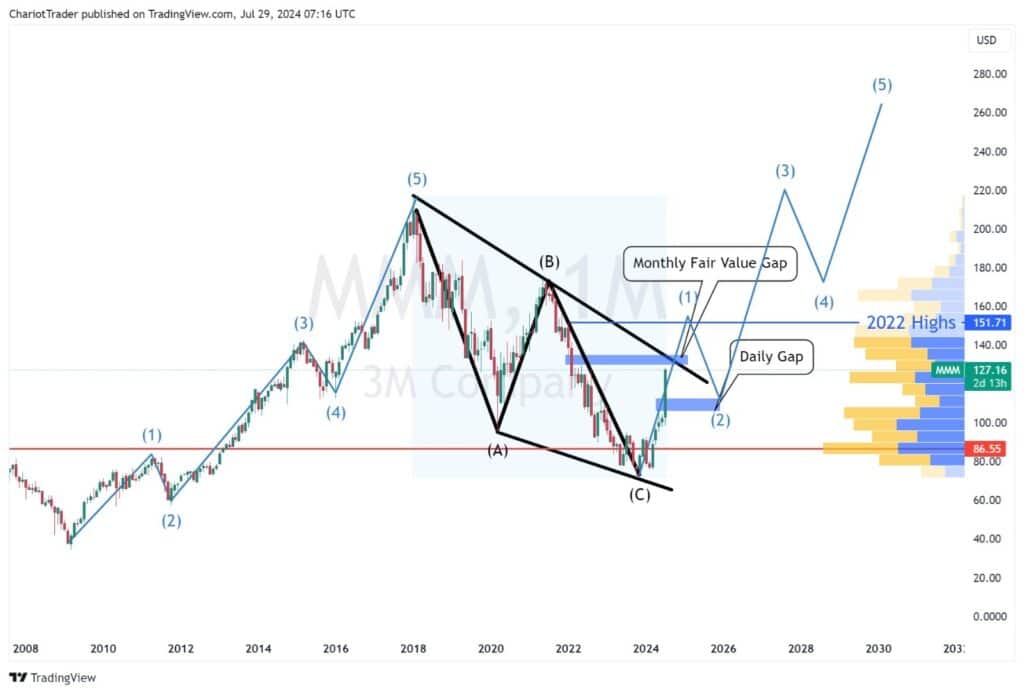
With these factors in mind, I would hold a bias towards the upside for the MMM stock.
However, on a rejection of the monthly fair value gap and upper trendline, we could see a temporary reversal. Adventurous day traders can attempt a short position here and realize some profits quickly – somewhere between $122.00 (previous consolidation range) to $112.80 (top of daily gap).
FAQ: What is a Fair Value Gap?
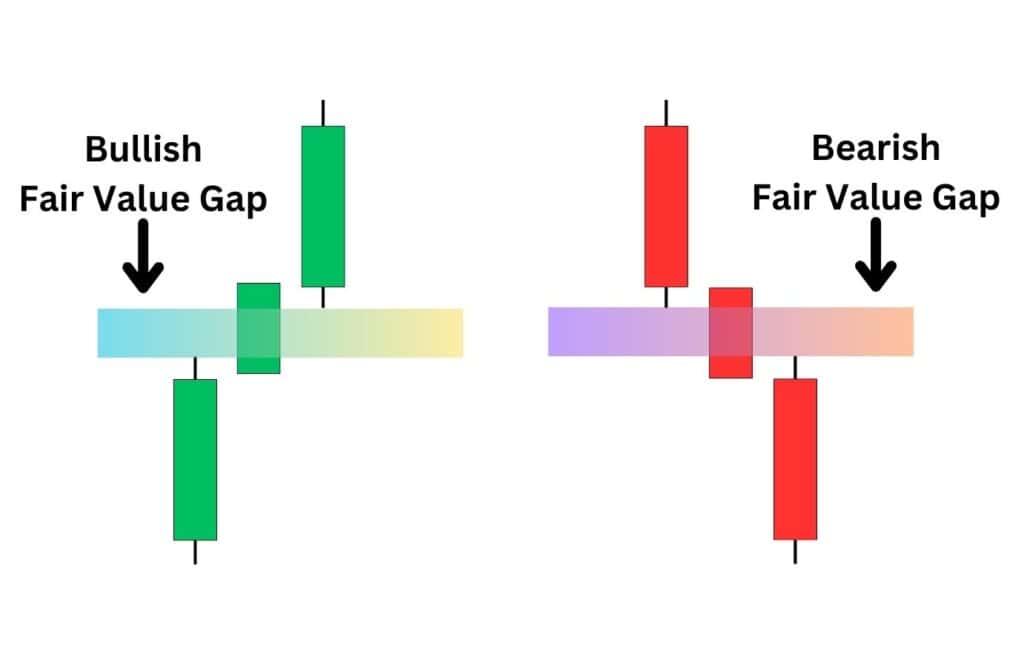
| A Fair Value Gap (FVG) is an “Air pocket” between 3 consecutively higher or lower candlesticks. It represents an area which the price has cut straight through – making it effectively an untested price zone. They work similarly to market gaps, in that price typically will return to the gap and test the market’s intentions. If the price rejects from a Fair Value Gap, it signifies that buyers or sellers are interested in defending the price from going any higher or lower. |
You may also be interested in:
Weekly Outlook for July 29th – Aug 2nd
Revisiting AUDUSD – The Beauty of Elliott Wave Analysis


