


Written by:

Reviewed by:


- February 17, 2025
- 23 min read
Dow Theory: Understanding its Key Principles and Strategies
What Is The Dow Theory?
The Dow Theory is a technical framework for understanding market trends by analysing rotation between major indices like Dow Jones Industrial Average (DJIA) and Dow Jones Transportation Average (DJTA). The Dow Theory was developed by Charles Dow. Charles Dow also partnered with Edward Jones to make foundational contributions to the stock market as they co-founded the Dow Jones & Company and the Wall Street Journal.
Though Dow never formally documented his ideas, later analysts refined his work into six core principles, including the existence of primary, secondary, and minor trends, the confirmation of trends across averages, and the role of trading volume in validating market movements.
At its heart, the Dow Theory asserts that markets move in discernible patterns driven by collective investor psychology and economic conditions. This methodology provides investors with a disciplined approach to identifying trends, timing trades, and managing risk, laying the foundation for many modern technical analysis practices. Despite being over a century old, the Dow Theory remains a relevant and valuable tool for understanding the cyclical nature of financial markets.
How Does Dow Theory Work?
At its heart, Dow Theory is about understanding the collective psychology of the market. It views the stock price as a reflection of all available information in the market, embodying human behaviour—fear, greed, optimism, and doubt—all playing out in price movements. The purpose of Dow Theory is not just to identify trends but to interpret the underlying sentiment driving those trends, providing a window into the market’s “emotional state.”
The Meaning Behind Trends

In Dow Theory, trends are not just patterns—they represent the market’s collective mindset. A primary uptrend reflects optimism and confidence, as participants expect future economic growth. Conversely, a downtrend captures fear and pessimism, where investors brace for economic challenges. By analysing these movements, Dow Theory provides a way to “read” the mood of the market and anticipate how it may shift over time.
Purpose of Confirmation
One of the theory’s key elements is the idea of confirmation between the Dow Jones Industrial Average (DJIA) and the Dow Jones Transportation Average (DJT). This reflects the interconnectedness of different parts of the economy. If the DJIA (representing industrial production) rises while the DJT (indicating the health of goods transportation) lags, it suggests a mismatch between production and distribution, potentially signalling that market optimism lacks substance. This divergence is a warning sign that investor sentiment may be overly hopeful or that cracks are forming in the broader economic narrative.
The Power of Divergence and Reversals
When trends diverge, Dow Theory interprets this as a shift in collective psychology. A market nearing a reversal often shows signs of indecision—optimism in one area (e.g., large-cap stocks in the DJIA) but hesitation or doubt in another (e.g., transportation stocks in the DJT). This psychological tug-of-war reveals cracks in the consensus and often precedes major changes in direction.
Dow Theory’s Deeper Purpose
Beyond identifying trends, Dow Theory teaches us to approach the market with humility. By understanding that the market reflects millions of individual decisions, it encourages traders and investors to look beyond the numbers and consider the broader economic story. Are businesses producing and distributing goods effectively? Are investors overestimating growth or underestimating risks? Dow Theory is ultimately about connecting the dots between market action and the human emotions driving it.
In this way, Dow Theory works as both a market tool and a psychological compass, helping traders align with the market’s rhythm while avoiding the pitfalls of emotional decision-making.
Importance of Dow Theory
The Dow Theory remains a cornerstone of technical analysis, offering invaluable insights for understanding and navigating stock market dynamics. Over a century after its introduction, it continues to guide investors in making informed decisions. Here are some of the key reasons why the Dow Theory is vital in modern investing:
- Understanding Market Trends
At its core, the Dow Theory helps investors decode the direction of market trends, whether primary, secondary, or minor. By recognising these trends, investors can align their strategies with the broader market movement, improving their chances of success. - Identifying Individual Stock Trends
Beyond market-wide analysis, the Dow Theory aids in identifying trends within individual stocks. This insight allows investors to determine optimal entry and exit points, maximising profits and minimising losses. - Enhancing Technical Analysis
Technical analysts use the Dow Theory to enhance their technical analysis by providing a framework for pinpointing support and resistance levels, tracking trend lines, and analysing market momentum. This enhances the precision of investment strategies. - Improving Risk Management
By understanding prevailing trends, investors can better manage risk, adjusting their portfolios to safeguard against market downturns. Whether by reallocating assets or diversifying holdings, the Dow Theory offers a roadmap for proactive risk mitigation. - Supporting Long-Term Investment Decisions
For long-term investors, the Dow Theory provides insights into sustained market movements. This helps in selecting stocks poised for long-term growth, aligning investment decisions with broader economic cycles.
In essence, the Dow Theory is not merely a historical relic but a living, practical tool that empowers investors to navigate the complexities of the stock market with clarity and confidence.
Fundamental Principles of the Dow Theory
The Dow Theory is built upon six fundamental principles that provide a framework for understanding market behaviour and guiding investment decisions.
1. The Market Discounts Everything
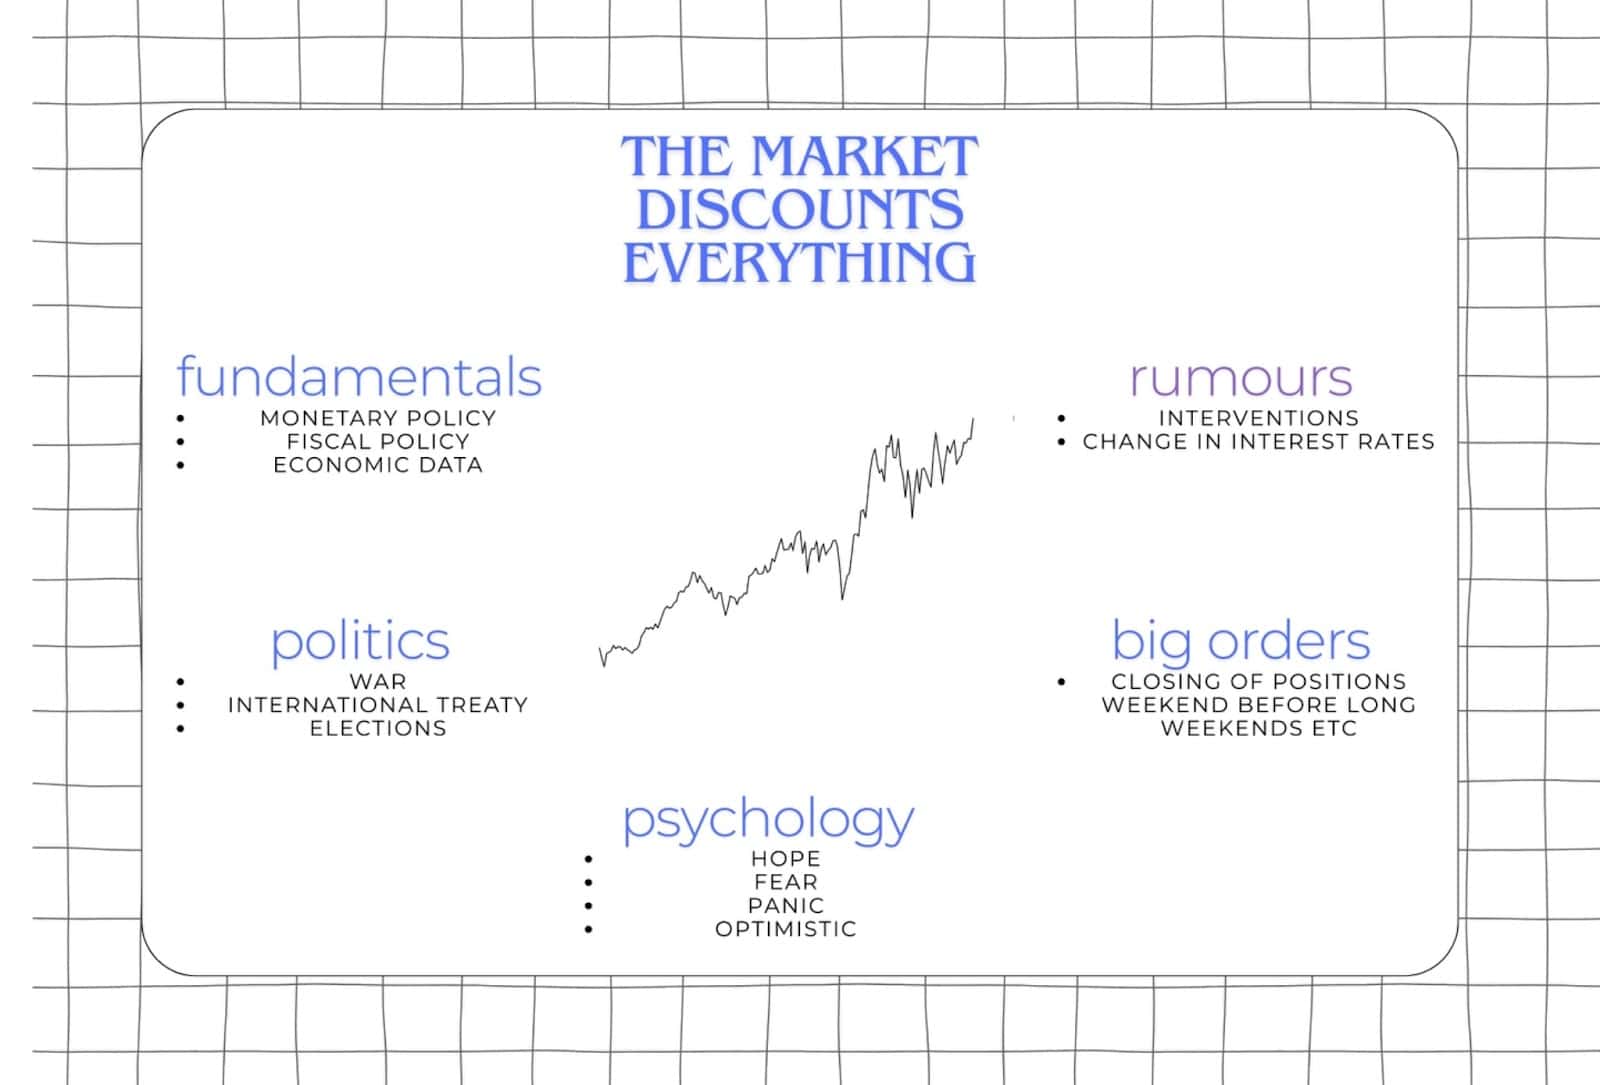
This principle asserts that all available information—economic data, political events, natural disasters—is already reflected in stock prices. According to the Dow Theory, the market efficiently processes and incorporates all known information, making price movements a comprehensive indicator of market sentiment and conditions.
2. Classification of Market Trends
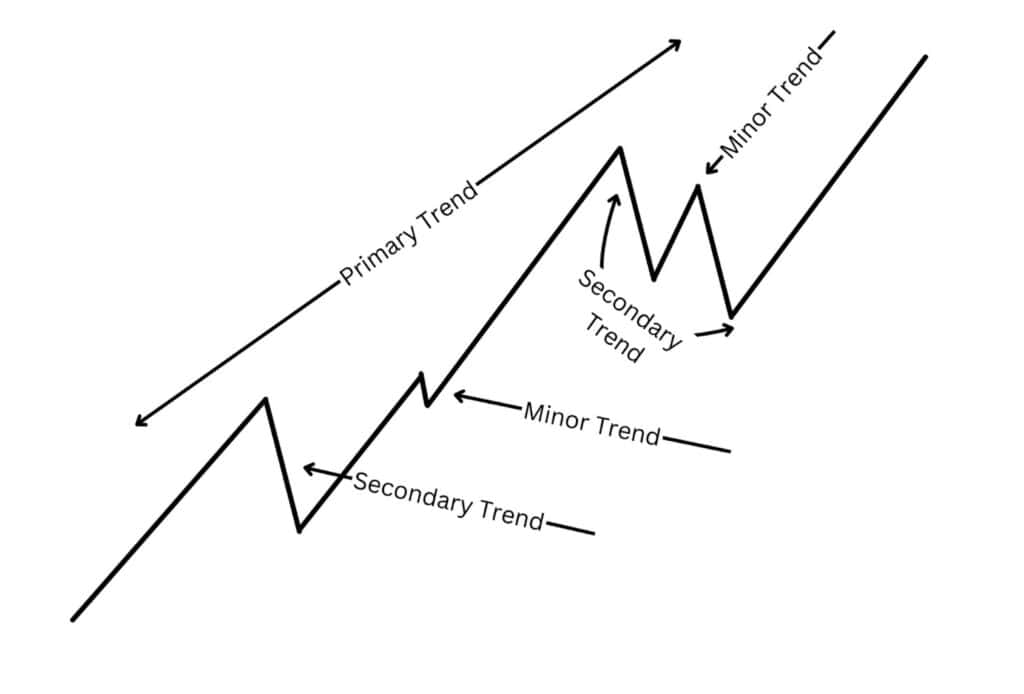
The Dow Theory identifies three types of market trends:
- Primary Trends: Long-term movements lasting from a year to several years, indicating the overall direction of the market—either bullish (upward) or bearish (downward).
- Secondary Trends: Shorter-term corrections within the primary trend, lasting from a few weeks to a few months, typically retracing 33% to 66% of the primary trend’s movement.
- Minor Trends: Short-term fluctuations lasting from days to weeks, often seen as market noise and less significant in the broader analysis.
Understanding these classifications helps investors identify the current market phase and make informed decisions.
3. Primary Trends Have Three Phases
Each primary trend comprises three distinct phases:
- Bull Market Phases:
- Accumulation Phase: Informed investors begin to buy assets against the prevailing market sentiment, anticipating a trend reversal.
- Public Participation Phase: The broader market recognises the emerging trend, leading to increased participation and more pronounced price movements.
- Excess Phase: Market activity becomes rampant, often leading to overvaluation before the trend reverses.
- Bear Market Phases:
- Distribution Phase: Informed investors start to sell off their holdings, anticipating a downturn.
- Public Participation Phase: The broader market begins to sell, accelerating the downward trend.
- Panic Phase: Widespread selling occurs, often leading to undervaluation before stabilisation.
Recognising these phases aids investors in timing their market entries and exits effectively.
4. Indices Must Confirm Each Other
The Dow Jones Industrial Index plays a crucial role in confirming trends along with the Dow Jones Transportation Average. For a trend to be considered valid, both the Dow Jones Industrial Average (DJIA) and the Dow Jones Transportation Average (DJTA) should move in the same direction. If one index reaches a new high or low and the other fails to follow, the trend might lack strength, signalling potential divergence.
5. Volume Must Confirm the Trend

Trading volume serves as a secondary indicator to confirm trends. A strong trend is typically accompanied by high trading volume, indicating robust investor participation. Conversely, if price movements occur on low volume, it may suggest a lack of conviction and a potential weakening of the trend.
6. Trends Persist Until a Clear Reversal Occurs
The Dow Theory posits that a trend remains in effect until there is definitive evidence of its reversal. This means that temporary market fluctuations or corrections are not considered trend reversals unless confirmed by significant and sustained movements in the opposite direction.
By adhering to these principles, investors can analyse market behaviour to identify trends, assess their strength, and make informed decisions regarding entry and exit points in their investment strategies.
Signal Theorems
The Dow Theory provides a structured approach to interpreting market signals, enabling investors to make informed decisions based on trend analysis and market behavior. Key components of this approach include:
Identification of the Trend
Recognising the prevailing market trend is a cornerstone of the Dow Theory, enabling investors to align their strategies with the broader market direction. Instead of focusing solely on the types of trends, the emphasis in this step lies in identifying the start, continuation, or reversal of a trend.
Key indicators of a trend include consistent higher highs and higher lows in an uptrend, or lower highs and lower lows in a downtrend. The Dow Theory relies on analysing price action and confirming the trend using additional metrics, such as trading volume and the movement of related indices. Recognising whether the market is in a phase of accumulation, public participation, or distribution provides further clarity on the strength and sustainability of the trend.
This ability to detect and validate trends allows investors to make informed decisions about timing their entries, exits, or portfolio adjustments.
Both Averages Must Confirm
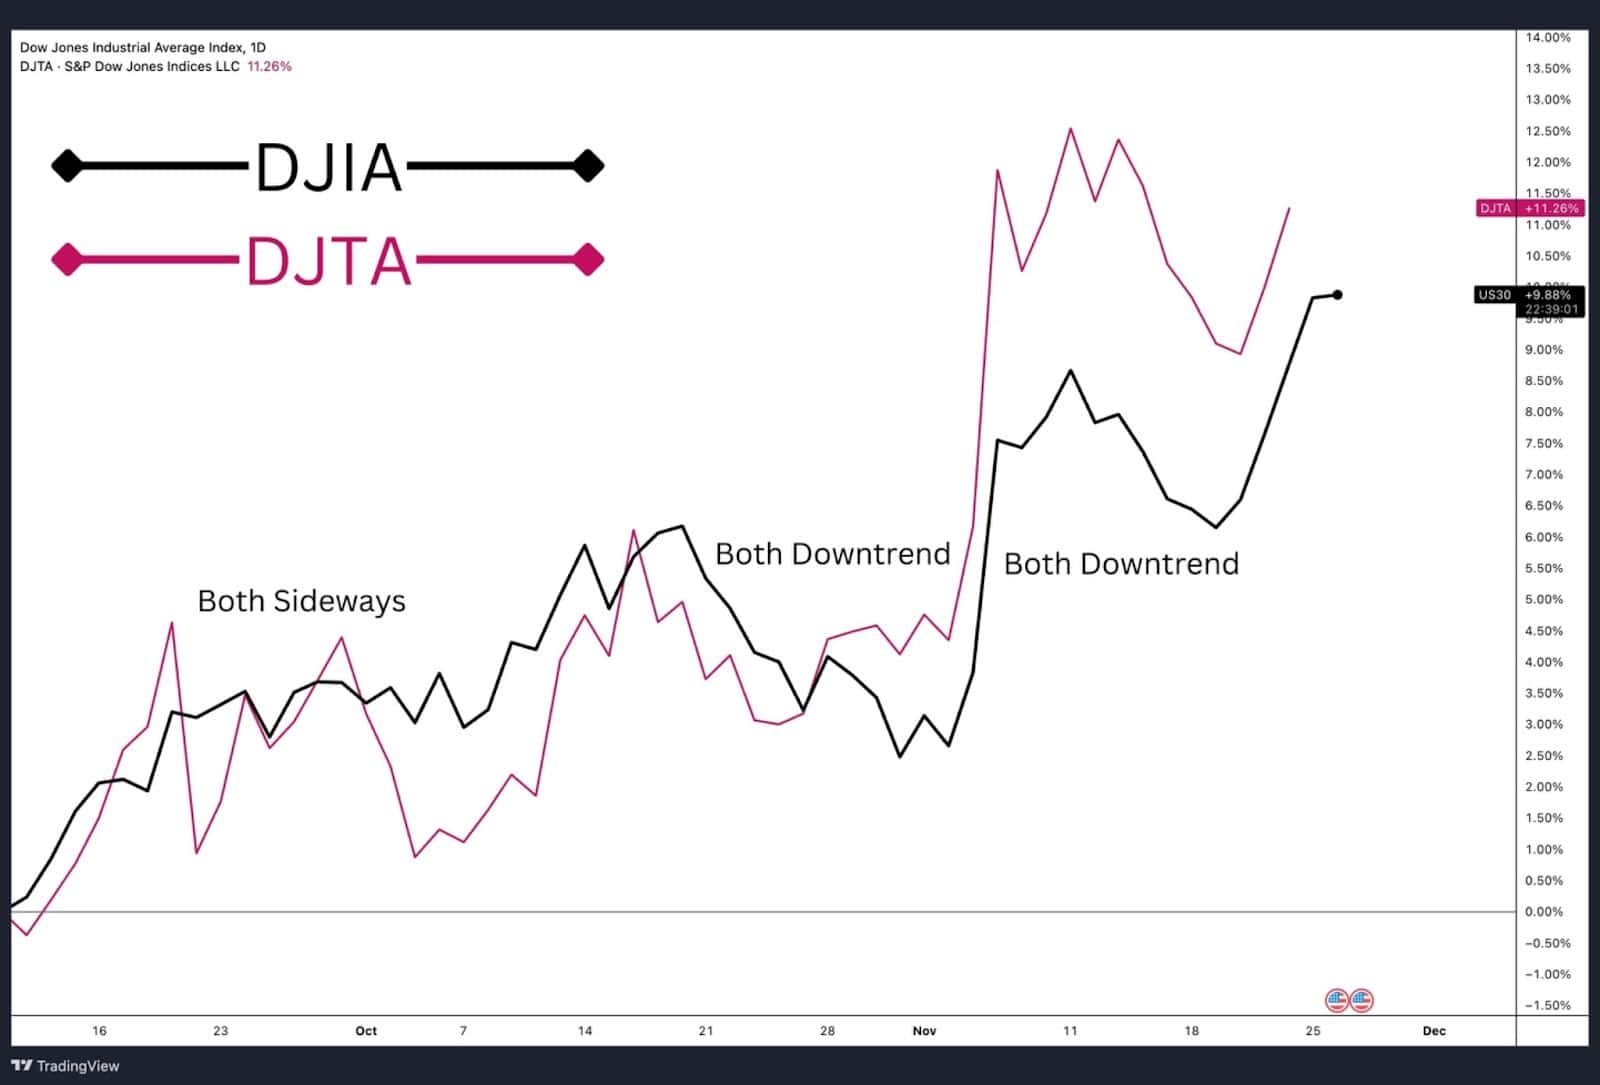
For a trend signal to be considered valid, both the Dow Jones Industrial Average (DJIA) and the Dow Jones Transportation Average (DJTA) should move in the same direction. If one index reaches a new high or low and the other fails to follow, the trend might lack strength, signaling potential divergence.
The Role of Volume
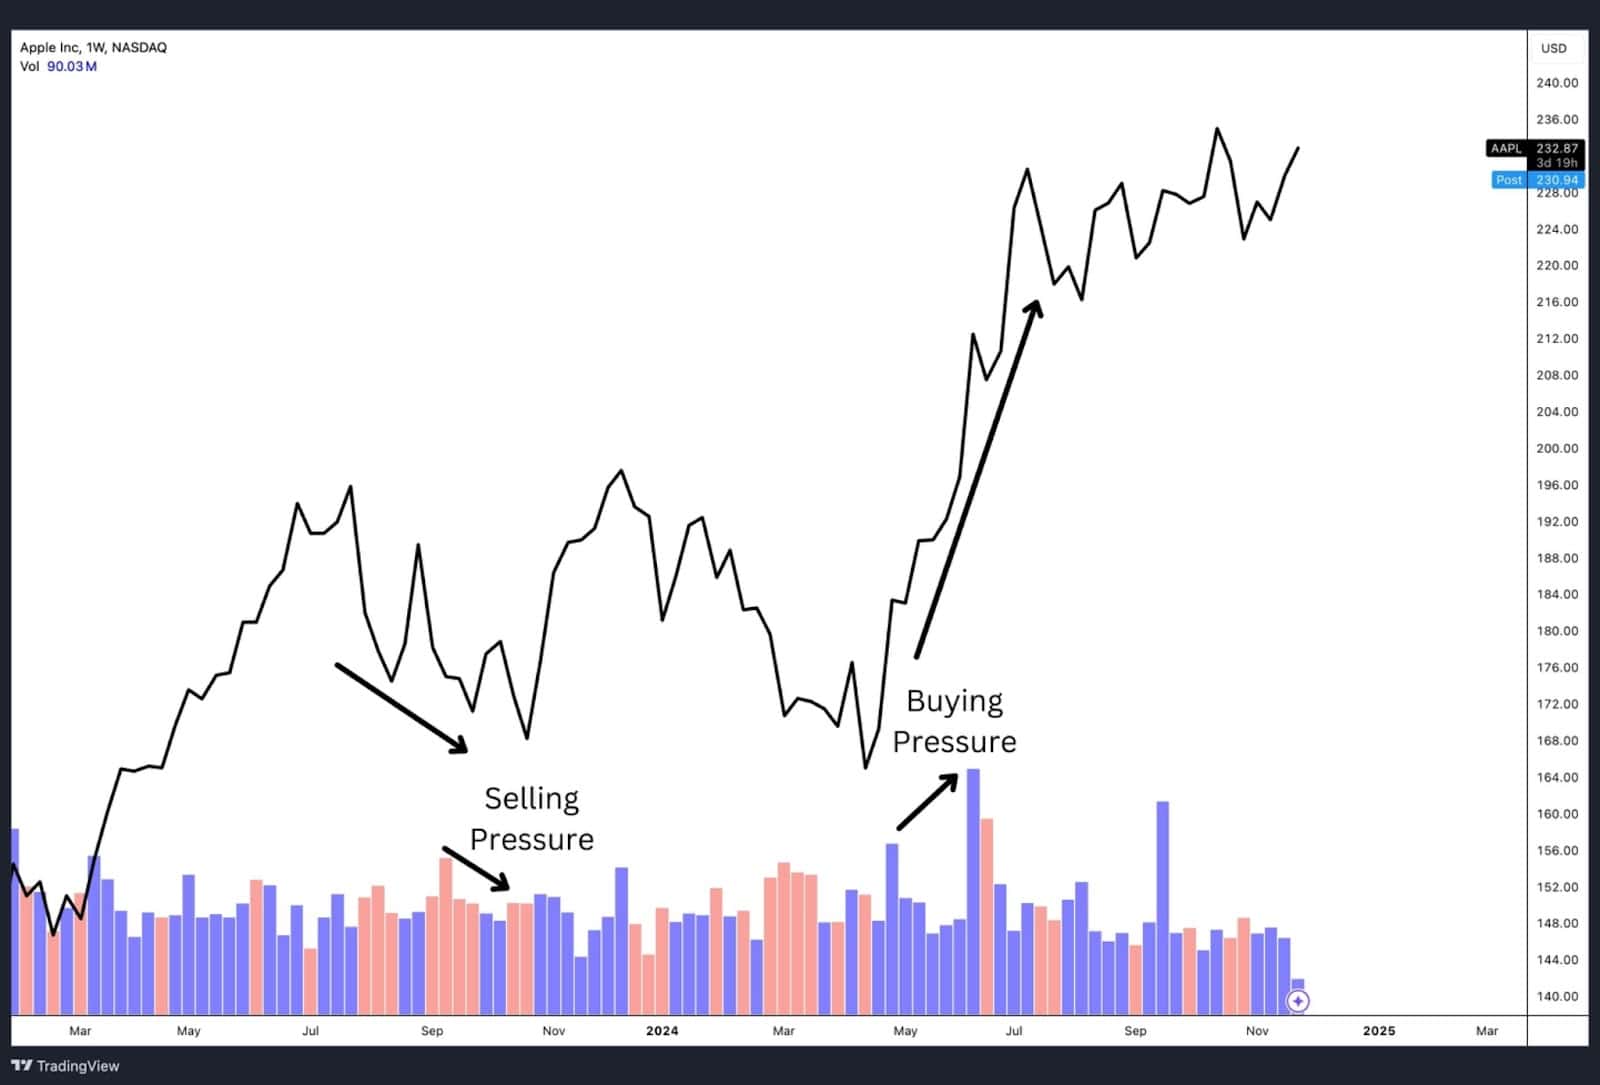
Trading volume serves as a secondary indicator to confirm trends. A strong trend is typically accompanied by high trading volume, indicating robust investor participation. Conversely, if price movements occur on low volume, it may suggest a lack of conviction and a potential weakening of the trend.
Lines (a.k.a. Trading Ranges)
In the Dow Theory, “lines” refer to periods where the market moves sideways within a narrow range, indicating indecision among investors. These trading ranges can precede significant price movements, as a breakout above or below the range often signals the beginning of a new trend. Identifying these lines helps investors anticipate potential market shifts.
By understanding and applying these signal theorems, investors can enhance their ability to interpret market movements and make strategic investment decisions.
Dow Theory Examples
Dow Jones Industrial Average vs DJT (2019–2020)
Scenario:
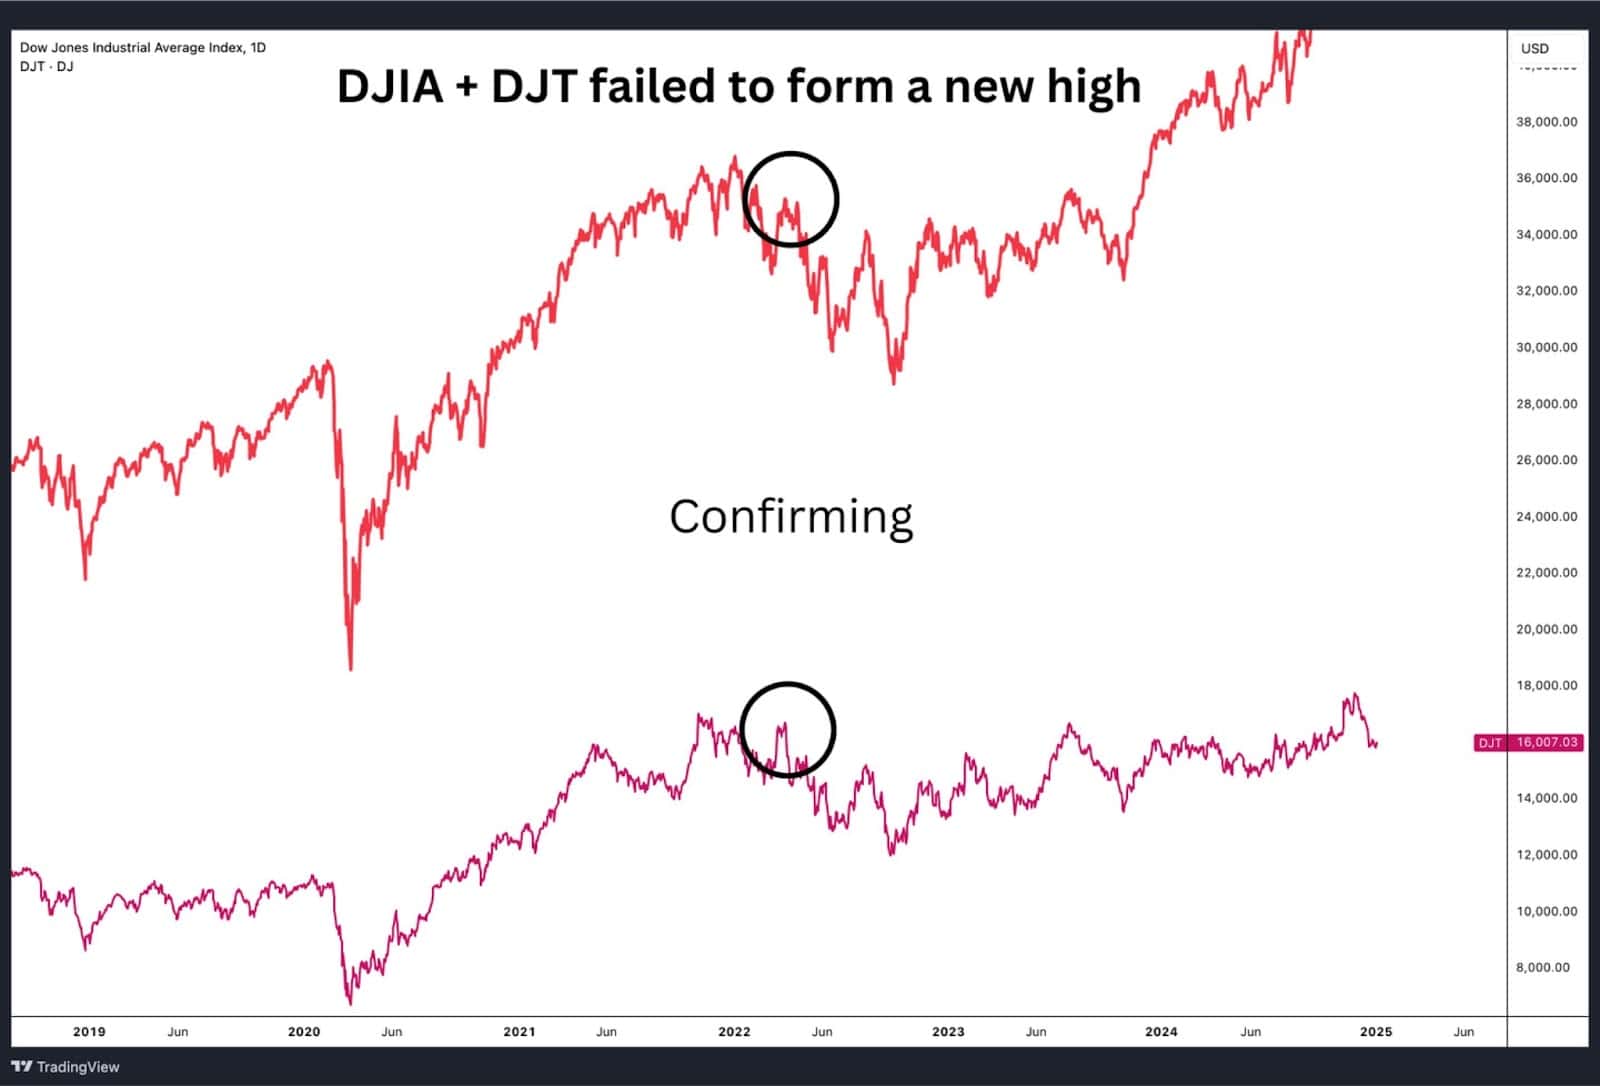
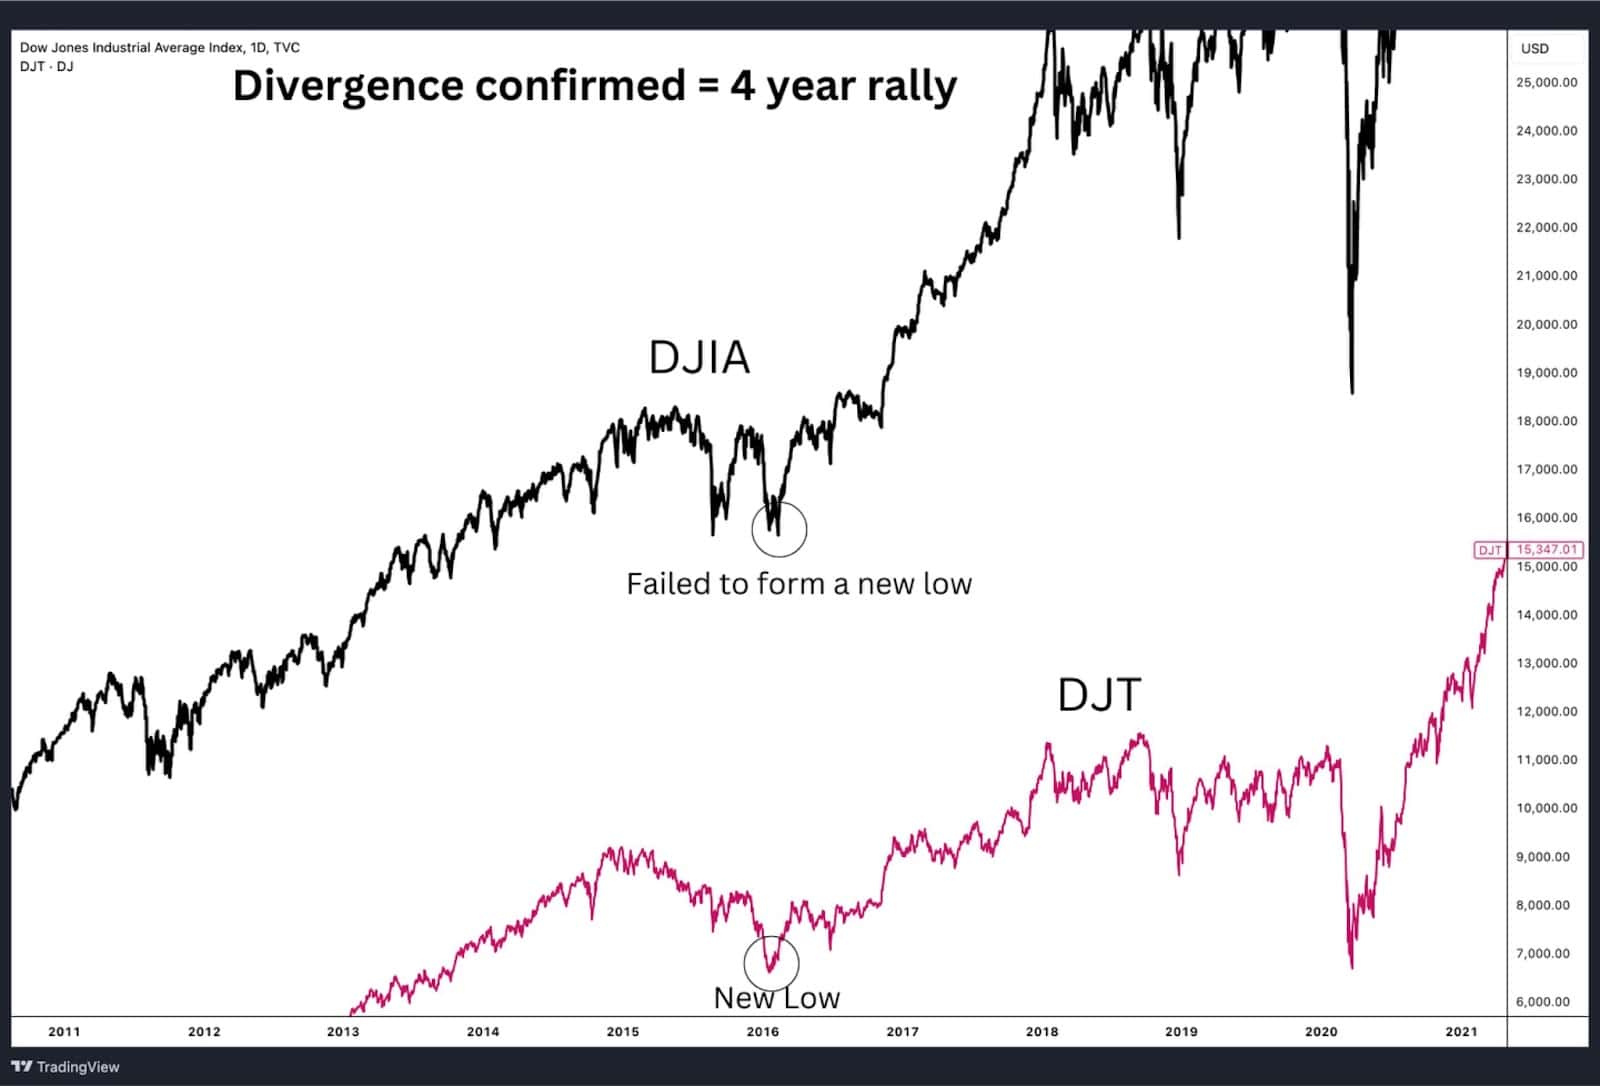
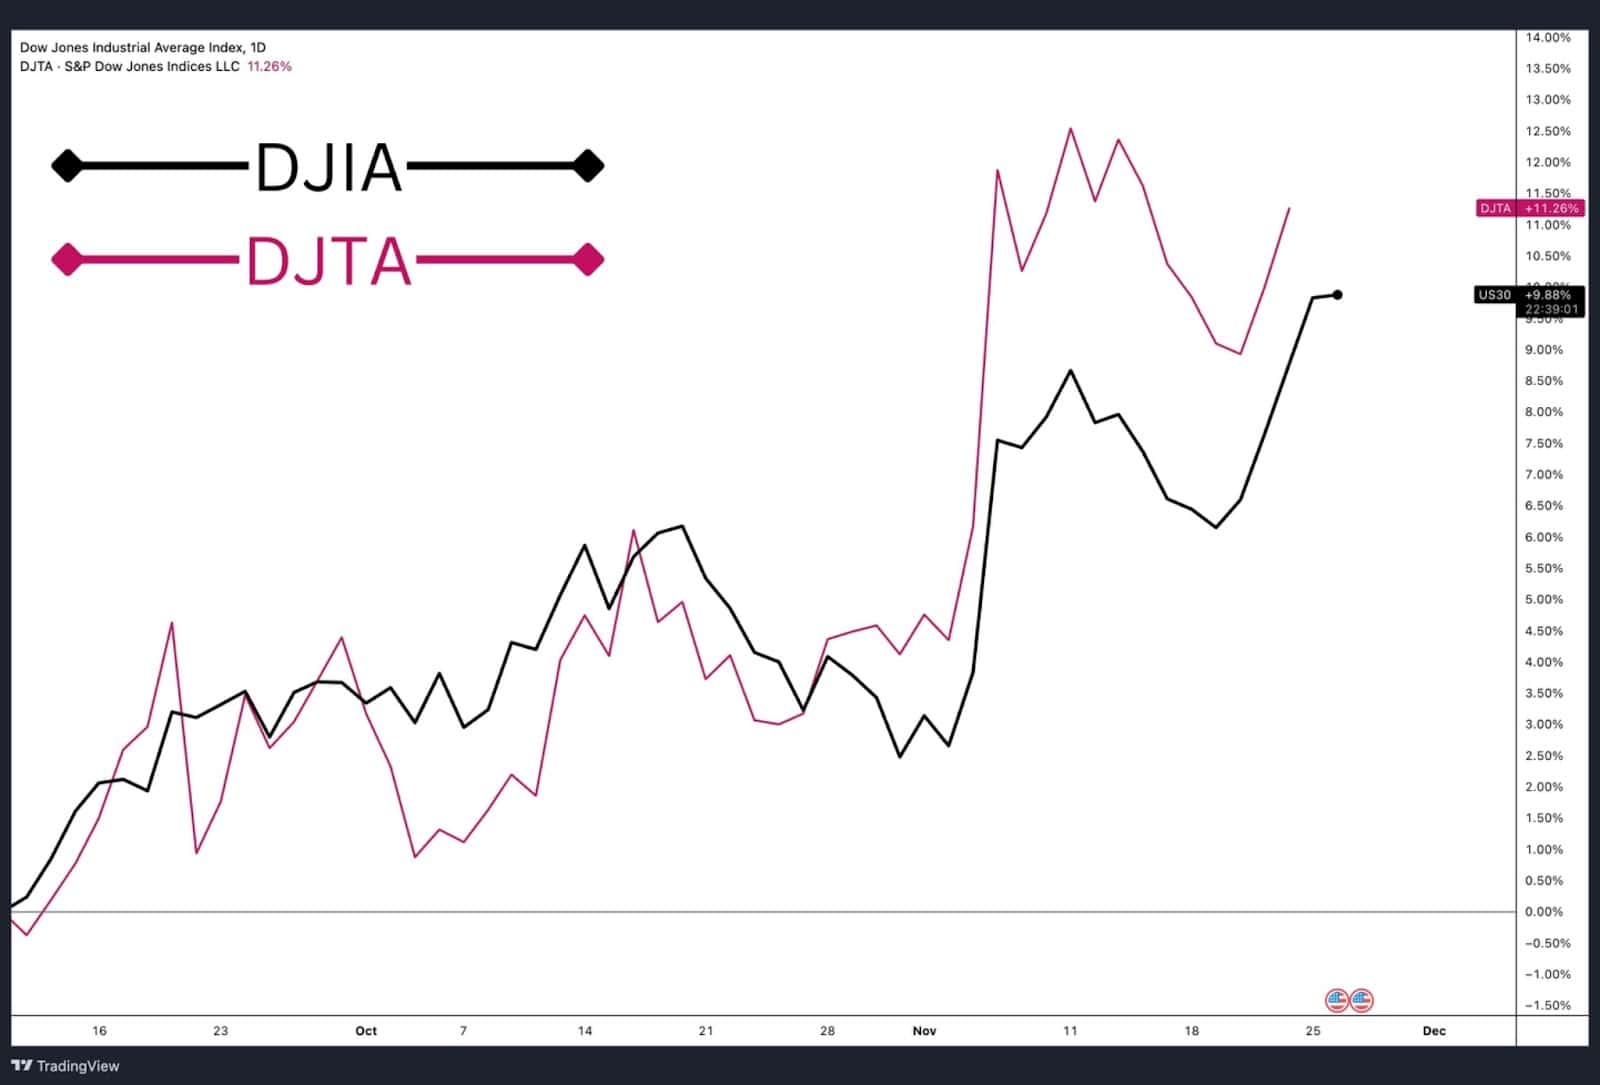
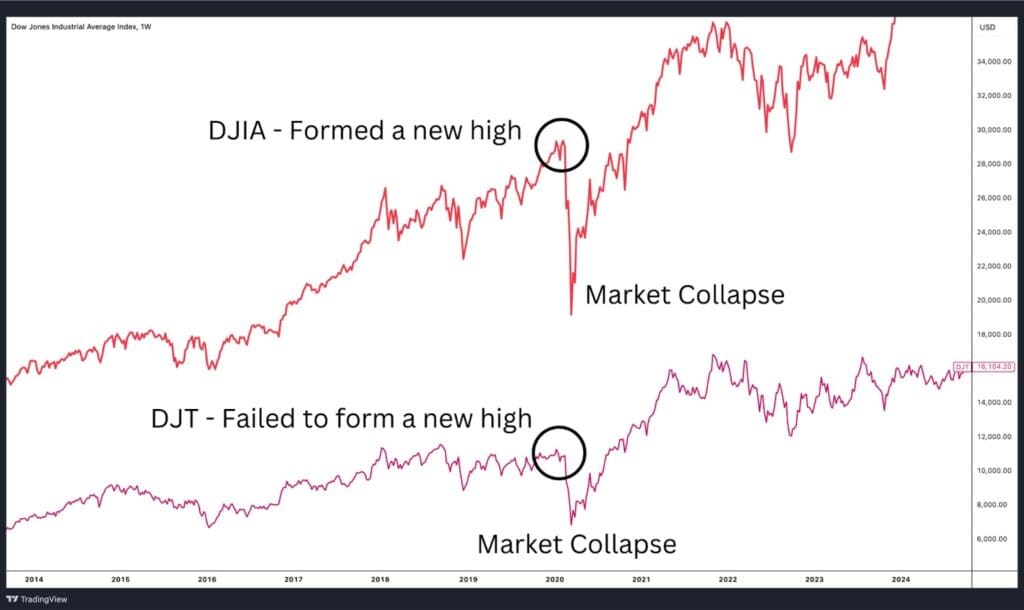
In early 2020, just before the market collapse caused by the global pandemic, the Dow Jones Industrial Average in red (DJIA) and Dow Jones Transportation Average in pink (DJT) exhibited a divergence. According to Dow Theory, such divergences can signal a weakening trend and potential market instability.
Example:
In late 2019, the DJIA reached a new high, continuing its upward trend. However, the DJT failed to confirm this move and did not form a new high during the same period. This divergence between the two indices highlighted a lack of alignment in the broader market. Dow Theory emphasises that for a trend to be valid, both the DJIA and DJT must confirm the movement.
As shown on the chart, the lack of confirmation from the DJT was a warning sign of underlying weakness in the market. Shortly after, the market experienced a significant collapse in early 2020. This divergence serves as a textbook example of how Dow Theory can provide early warnings of potential trend reversals or market downturns.
By recognising this divergence, traders and investors could have taken precautionary measures to protect their portfolios or reassess their market positions.
DJIA Post-COVID Recovery Trend (2020–2025)
Scenario:
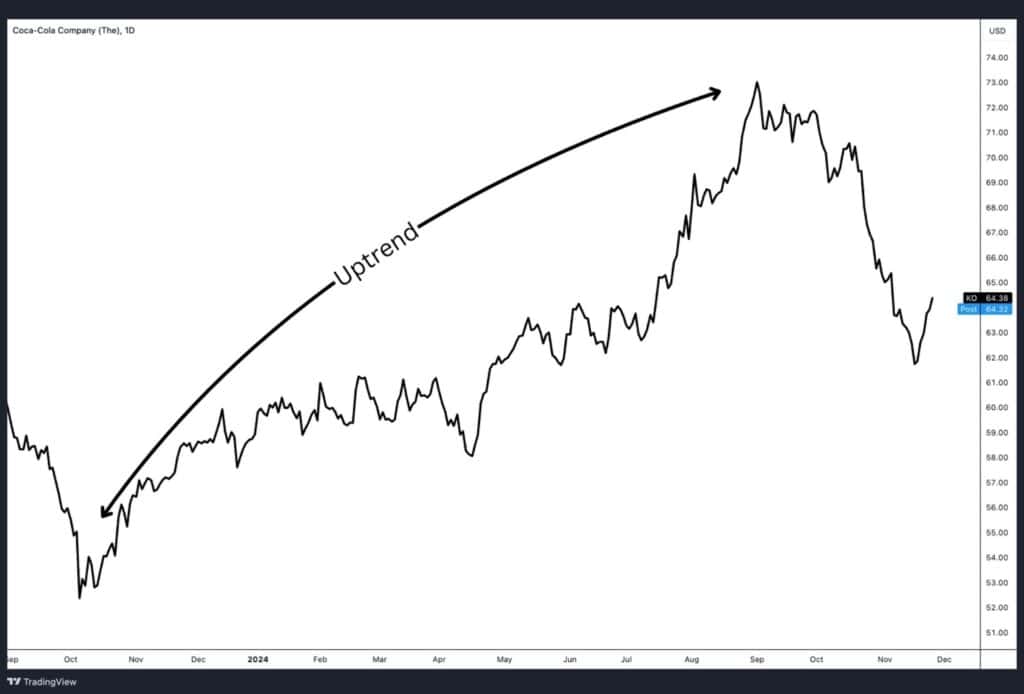
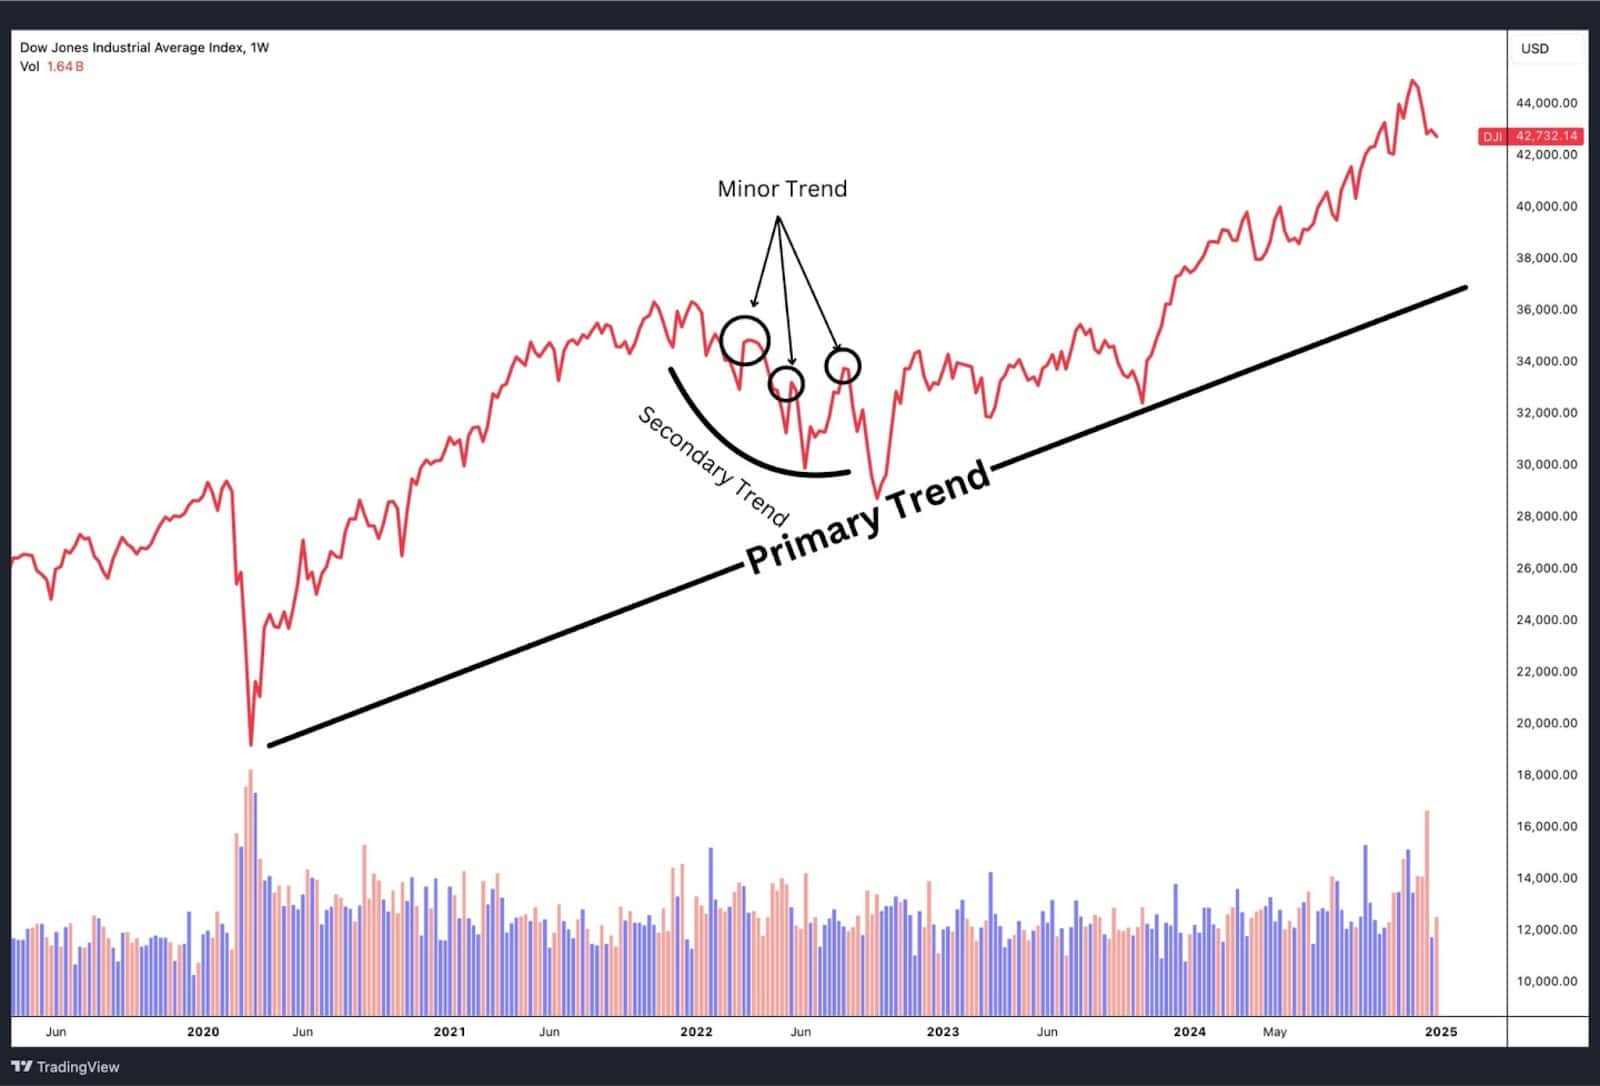
Following the market crash in early 2020 due to the COVID-19 pandemic, the markets began a strong recovery. Using Dow Theory principles, the recovery trend can be broken down into distinct primary, secondary, and minor trends, reflecting the behaviour of the Dow Jones Industrial Average (DJIA).
Example:
- Primary Trend:
Starting in March 2020, the DJIA established a long-term bullish primary trend, characterised by consistent higher highs and higher lows. This trend persisted for several years, signalling a strong and sustained recovery in the broader market. - Secondary Trends:
Throughout the recovery, notable corrections occurred, such as in late 2021 and early 2022. These pullbacks were medium-term retracements within the broader upward trend, typically retracing 33-66% of the previous upward move. These secondary trends confirmed the resilience of the primary trend as the market rebounded each time without breaking key support levels. - Minor Trends:
Short-term fluctuations, such as the brief price action and corrections within secondary trends in early 2023, represent minor trends. These movements are typically just market noise on a day-to-day basis and can sometimes last up to a couple of weeks. While they hold little significance for long-term investors, they can be critical for traders focused on shorter timeframes.
Dow Theory Trading Strategies
Chart patterns are essential tools in technical analysis, and many align seamlessly with the principles of the Dow Theory trading strategy, which uses trend analysis to inform investment decisions. These patterns help traders identify trend reversals, continuations, and potential breakout opportunities. While the patterns discussed below are some of the most popular, they represent just a sample of the tools traders can use alongside Dow Theory.
Each of these strategies can also be connected to Dow Theory’s emphasis on confirmation. When two related assets (e.g., the DJIA and DJT) fail to confirm one another, it often aligns with the emergence of these patterns, offering traders actionable insights.
Double Bottom & Double Top Formation
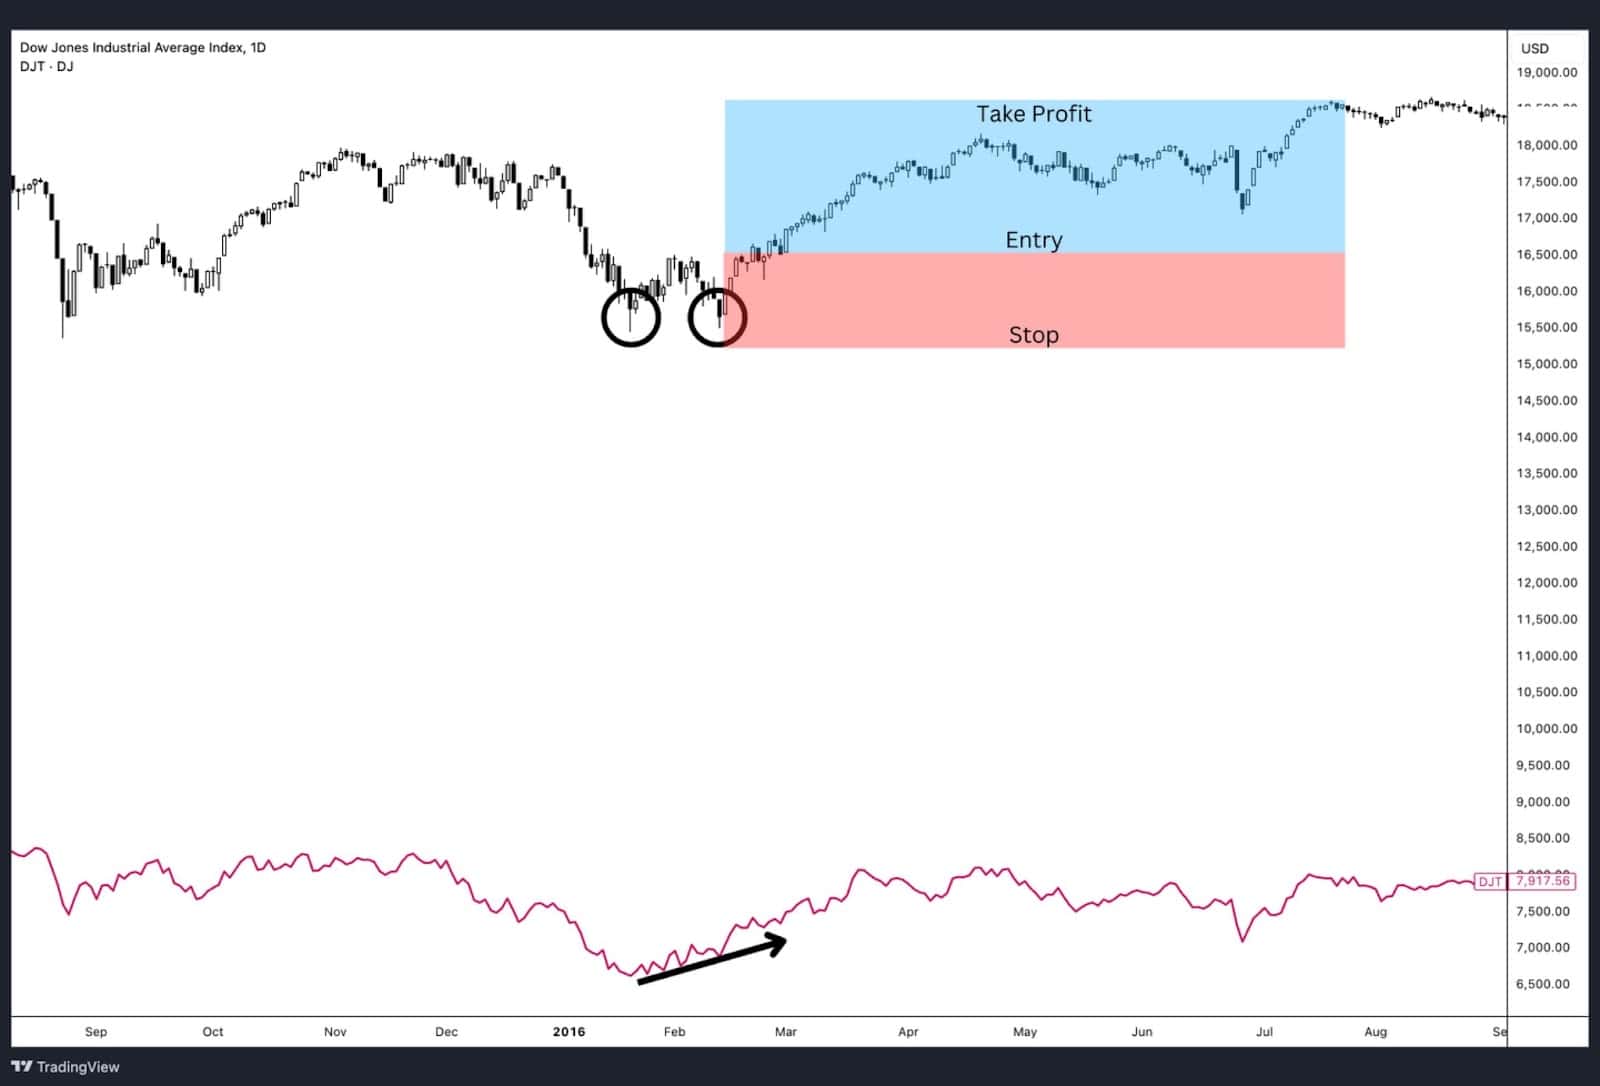
These patterns occur when prices test a support or resistance level twice without breaking through. A double bottom signals a potential bullish reversal, as prices bounce off support twice, confirming a lack of seller strength. A double top, on the other hand, suggests a bearish reversal, indicating resistance is holding firm.
Divergence between indices can strengthen the reliability of these formations. For instance, if the DJIA forms a double bottom while the DJT fails to confirm new lows, this divergence reinforces the potential for a bearish reversal.
Triple Bottom & Triple Top Formation
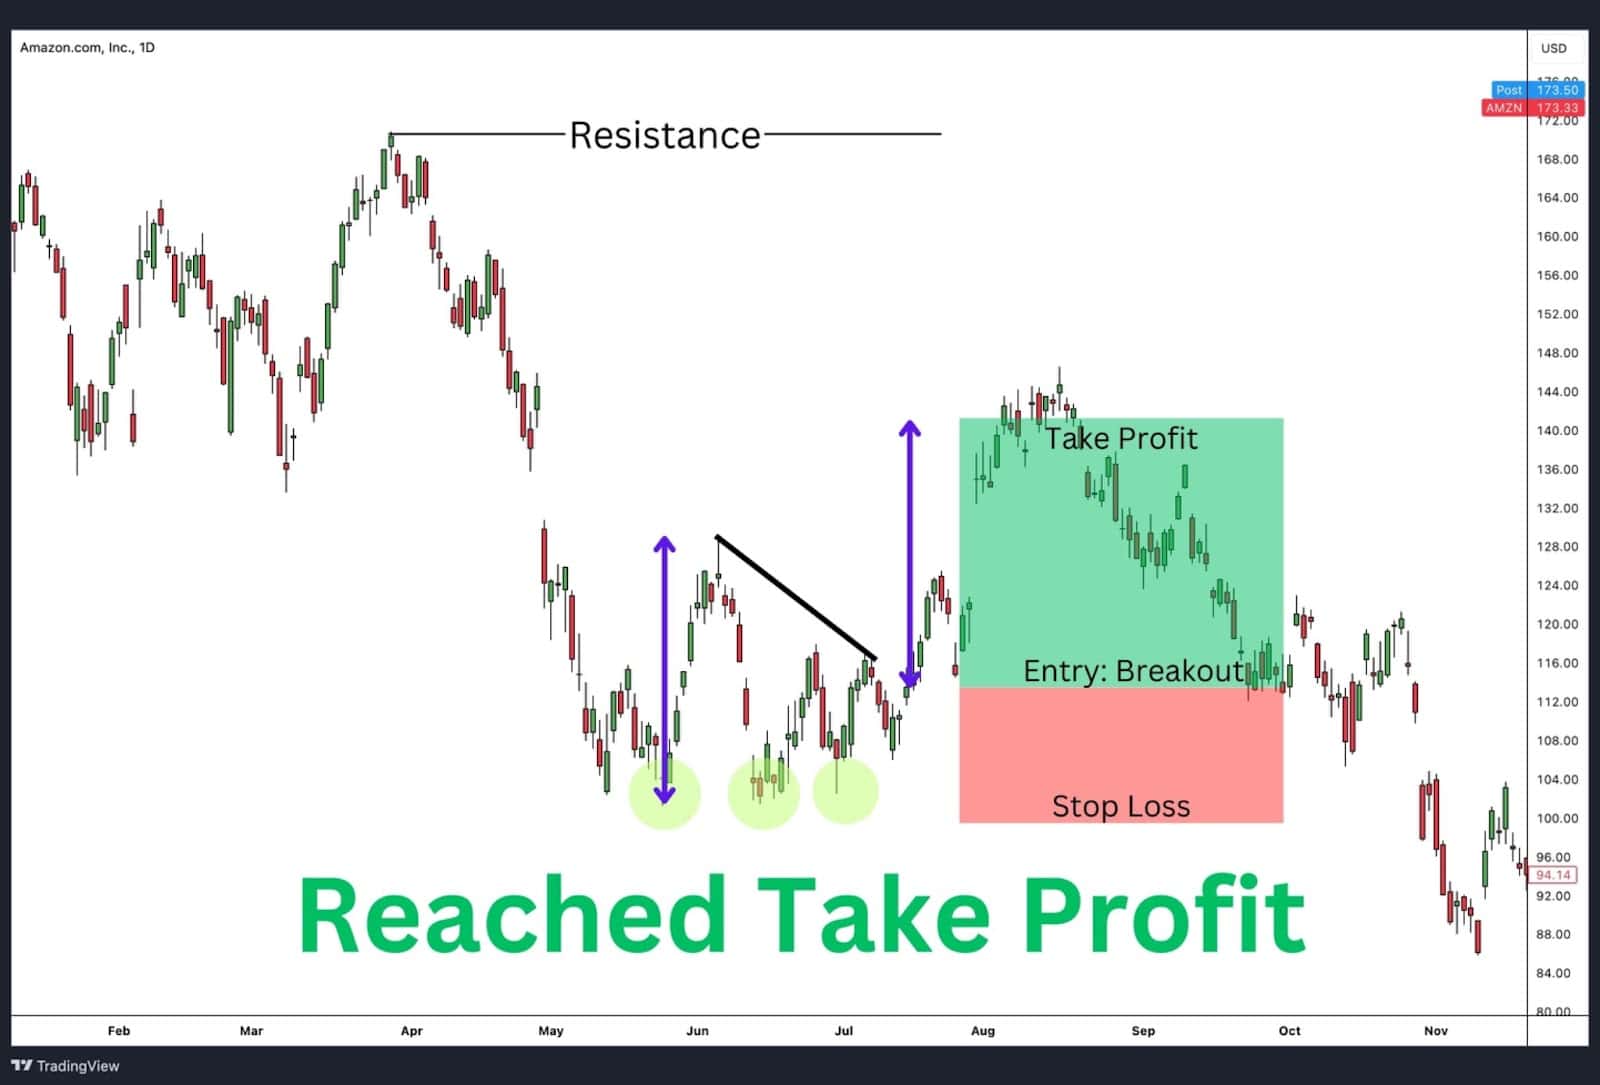
Similar to double formations, triple formations involve three tests of support or resistance. A triple bottom signifies a strong bullish reversal as buyers repeatedly defend a key support level. Conversely, a triple top indicates a robust bearish trend, as sellers consistently repel upward price attempts. These patterns are considered more reliable than double formations due to their repeated confirmations.
When the DJIA and DJT align in forming triple tops or bottoms, this agreement confirms the pattern’s reliability and strengthens the Dow Theory principle of trend validation through multiple tests.
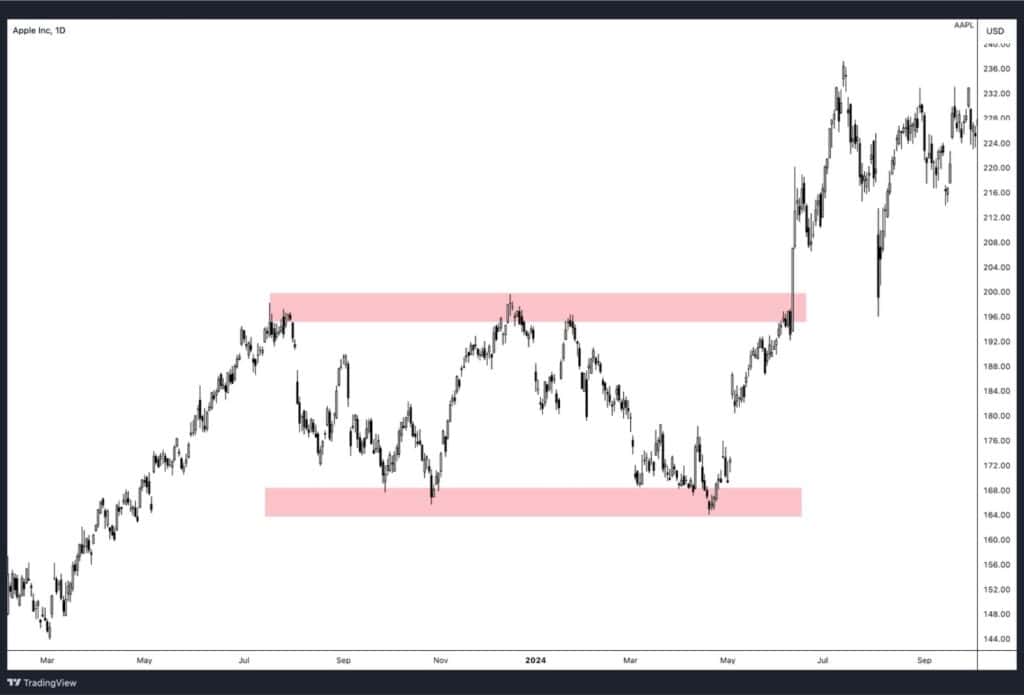
Range Formation
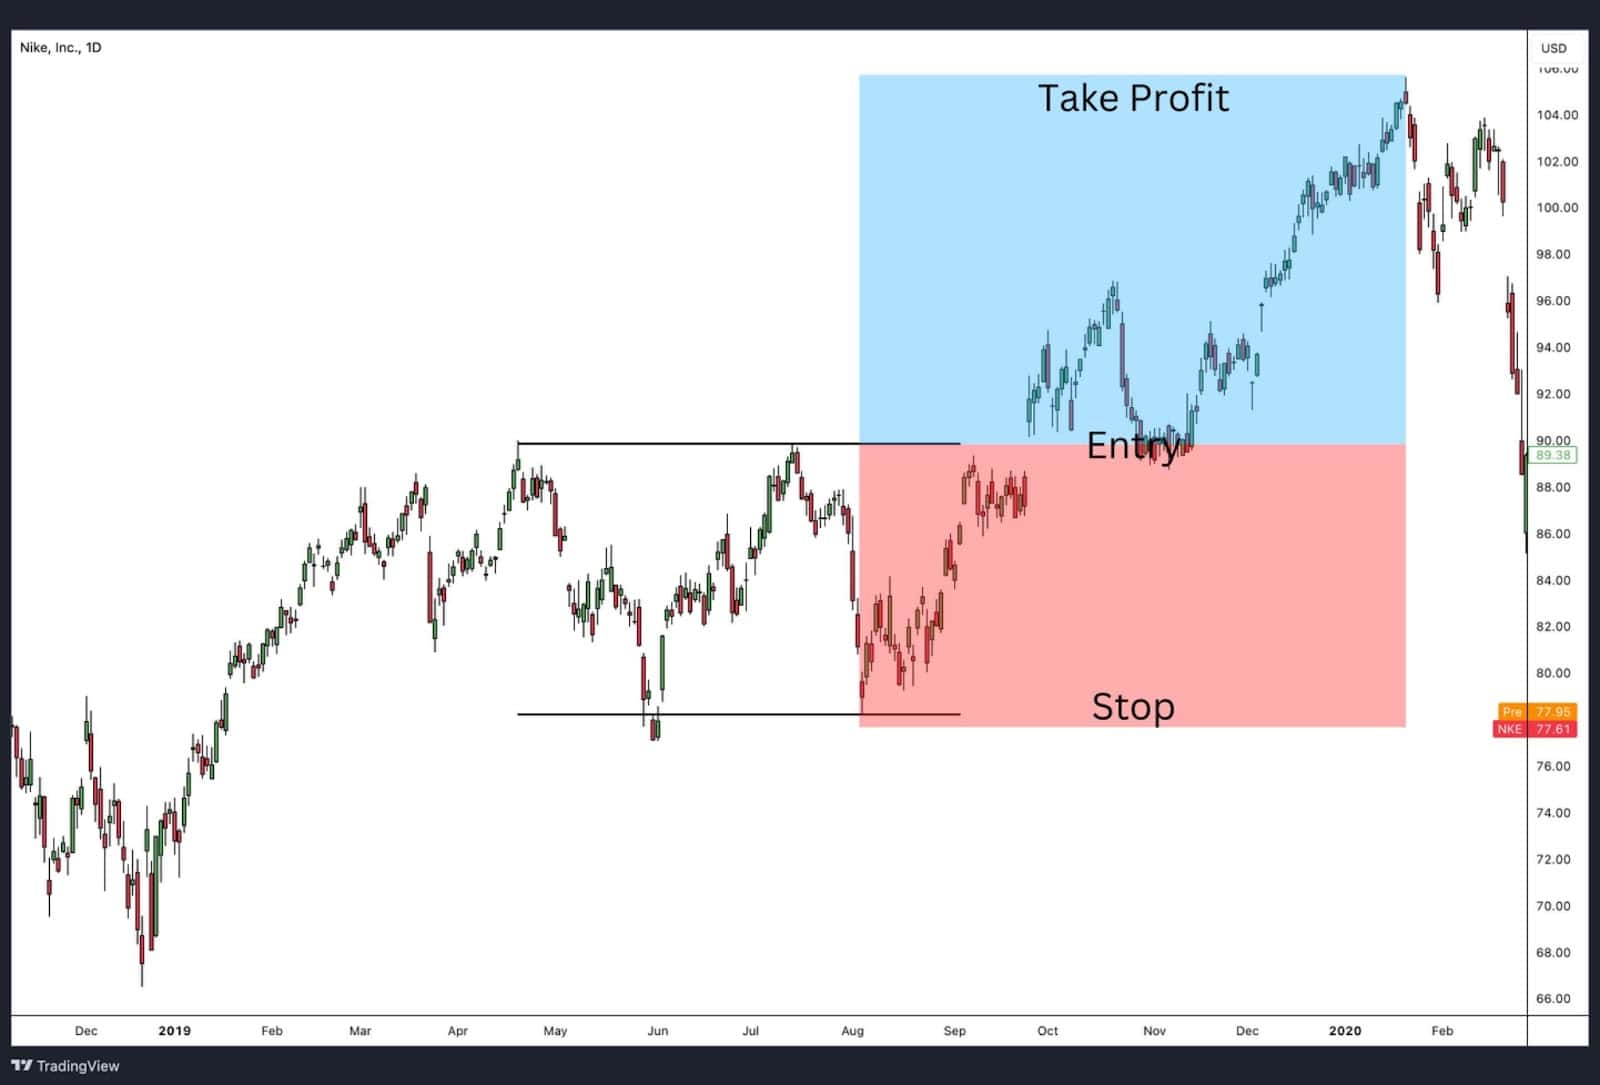
In a range-bound market, prices move sideways between well-defined support and resistance levels. Traders often buy at support and sell at resistance, waiting for a breakout to signal the beginning of a new trend.
Range-bound behaviour may reflect indecision between related indices. For example, if the DJIA remains in a range while the DJT shows weakness or divergence, this could indicate an impending breakdown or reversal.
Flag Formation
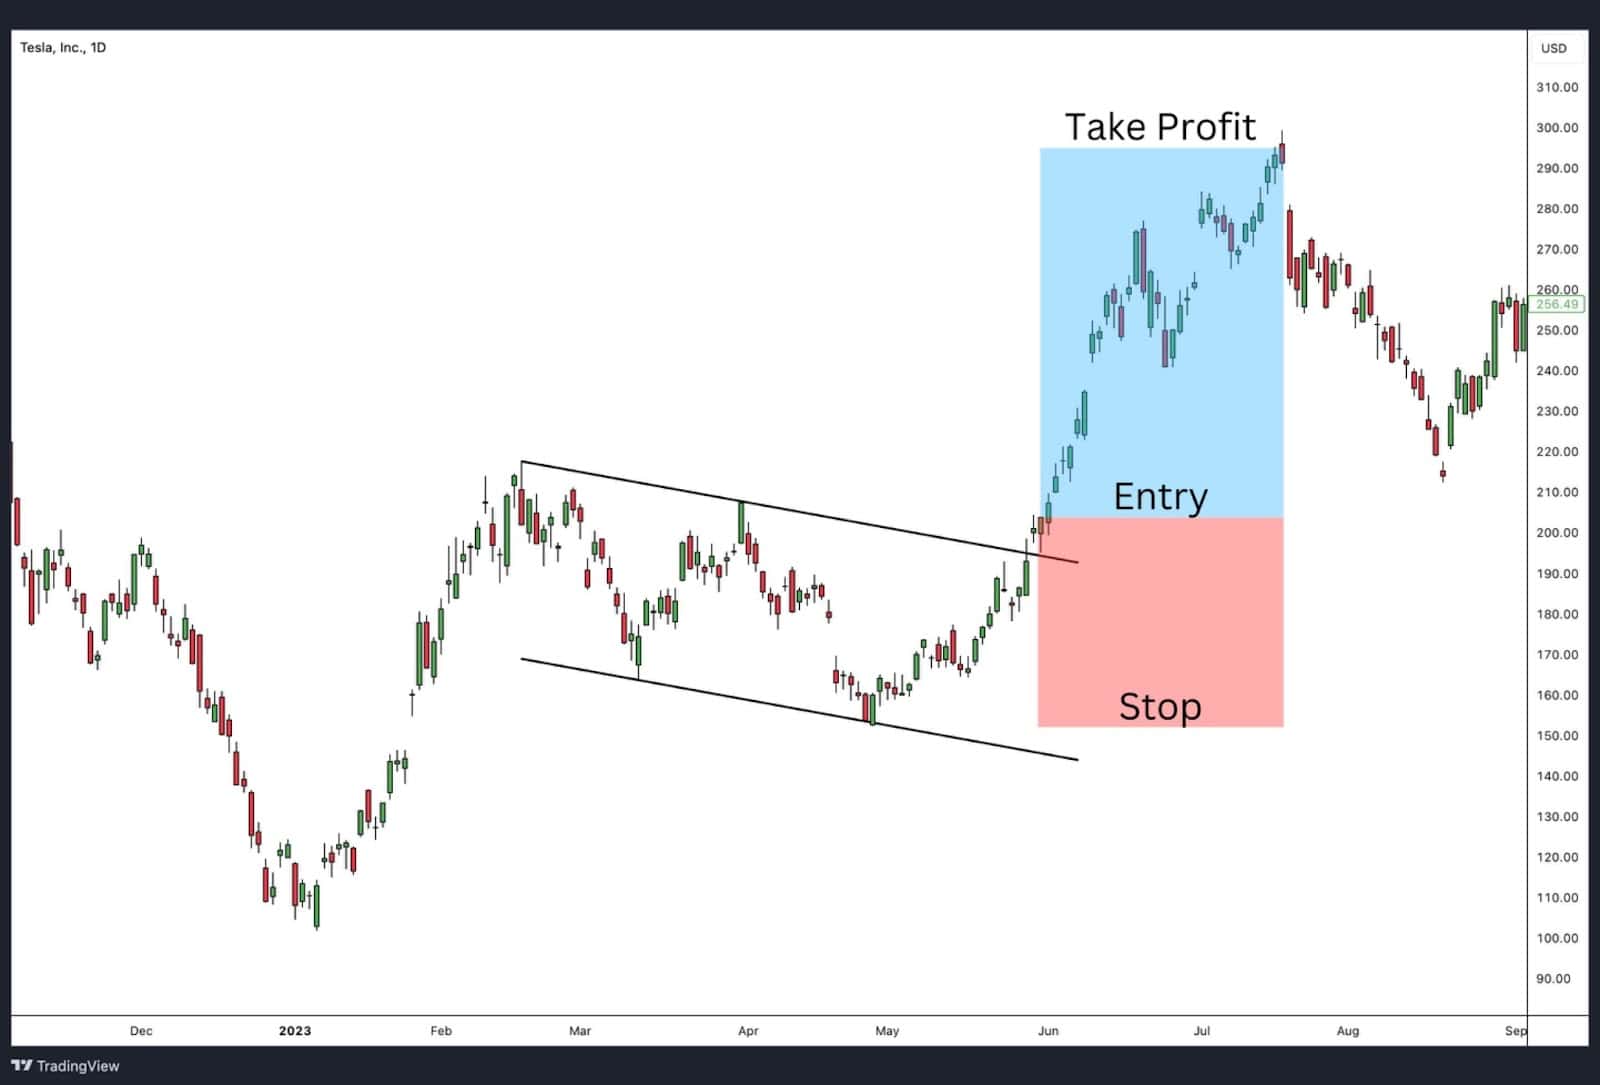
A flag pattern forms after a strong price movement, with prices consolidating in a narrow range, creating a “flagpole” appearance. Flags are typically continuation patterns, with traders entering positions in the direction of the breakout.
Flags often emerge in primary or secondary trends identified by Dow Theory. If both the DJIA and DJT align with a flag pattern, it confirms the continuation of the broader trend.
In the example above we see a bull flag pattern that eventually broke higher.
Trading the Range Breakout

A range breakout occurs when prices break above resistance or below support, often signalling the start of a new trend. High trading volume typically accompanies such moves, validating their strength.
Range breakouts align with Dow Theory’s emphasis on volume as a confirming indicator. If a breakout is accompanied by alignment in related indices, such as the DJIA and DJT, it confirms the reliability of the new trend.
Advantages of Using Dow Theory in Trading
- Incorporates Investor Psychology
Dow Theory is deeply rooted in understanding market psychology, reflecting how collective sentiment drives price movements. By analysing phases of accumulation, public participation, and distribution, investors gain insights into behavioral trends that influence market cycles. - Emphasis on Volume Analysis
The theory integrates trading volume as a confirming indicator, ensuring that trends backed by significant participation are more reliable. This helps investors avoid false signals driven by low-volume movements. - Trend Persistence Principle
Dow Theory’s assertion that trends persist until a clear reversal occurs provides a disciplined approach to trading. This principle prevents premature reactions to minor corrections, allowing investors to stay aligned with long-term market movements. - Simplicity and Practicality
The framework’s straightforward principles, such as using price and volume data, make it accessible for both novice and experienced investors. Its reliance on observable market behavior rather than complex calculations ensures practical application.
Disadvantages of Using Dow Theory in Trading
- Challenges in Identifying Secondary Swings
Distinguishing between secondary trends and temporary corrections can be difficult, leading to potential misinterpretations of the market’s direction. This ambiguity can complicate timing decisions. - Tradeoff Between Secondary Swing Size and Signal Accuracy
Larger secondary swings may delay reversal signals, while smaller ones risk generating false signals. Striking the right balance between swing size and accuracy is a challenge for Dow Theory practitioners. - Simplistic Breakout as Reversal Signal
Relying on breakout movements as reversal indicators can lead to false positives, especially during periods of high market volatility or noise. - Disregard for Supply and Demand Dynamics
Dow Theory focuses on price movements and trends but largely overlooks supply and demand factors that drive these changes, potentially missing critical market drivers. - Expanding Pivot Formation Complexity
In volatile markets, expanding pivot formations—where price action widens without clear direction—can make applying Dow Theory principles challenging, as traditional signals may fail to emerge. - Arbitrary Confirmation Rule
The requirement for confirmation between indices like the DJIA and DJTA may seem outdated and arbitrary in today’s diversified and globalised financial markets. - Asymmetry Between Bull and Bear Markets
Dow Theory often performs better in identifying bullish trends than bearish ones due to differences in market behavior during rising and falling markets, leading to potential bias in signal interpretation.
Dow Theory vs Rational Choice Theory
Rational Choice Theory (RCT) is rooted in economics and sociology, focusing on the decision-making processes of individuals. It assumes that individuals act rationally, making choices that maximise their utility based on personal preferences and constraints. In the context of financial markets, RCT suggests that investors make decisions by weighing the costs and benefits of various options, aiming to achieve the most favourable outcomes. This theory underpins many economic models and is used to predict behaviors such as consumer spending, investment choices, and voting patterns.
Key Differences
- Analytical Focus: Dow Theory centers on market trends and collective behaviors, analysing how groups of investors influence price movements. In contrast, Rational Choice Theory focuses on individual decision-making processes, examining how personal preferences and rational calculations drive actions.
- Methodology: Dow Theory relies on technical analysis, utilising historical price and volume data to forecast future market movements. Rational Choice Theory employs a more theoretical approach, using models to predict individual behaviors based on assumed rationality and utility maximisation.
- Application: Investors use Dow Theory to identify market trends and make trading decisions aligned with these trends. Rational Choice Theory is applied more broadly across various fields, including economics, political science, and sociology, to understand and predict individual and group behaviors.
In summary, while both theories offer valuable insights into financial markets, they operate from different perspectives. Dow Theory provides a framework for understanding market trends through technical analysis, whereas Rational Choice Theory offers a lens to comprehend individual decision-making processes based on rationality and utility maximisation.
Dow Theory vs Elliott Wave
Elliott Wave Theory, developed by Ralph Nelson Elliott in the 1930s, is a form of technical analysis that examines market price patterns to forecast future movements. Elliott proposed that market prices unfold in specific patterns, which practitioners today call Elliott waves, or simply waves. These waves are categorised into two types:
- Impulse Waves: Consisting of five sub-waves, these move in the direction of the prevailing trend.
- Corrective Waves: Made up of three sub-waves, these move against the prevailing trend.
Elliott’s theory suggests that these patterns are fractal in nature, meaning they repeat on various time scales, allowing analysts to predict future price movements by identifying current wave patterns.
Similarities Between Dow Theory and Elliott Wave Theory
- Trend Analysis: Both theories emphasise the importance of identifying and understanding market trends to make informed trading decisions.
- Market Phases: Each theory recognises that markets move in phases or waves, reflecting the cyclical nature of market behavior.
- Investor Psychology: Both frameworks acknowledge that market movements are influenced by collective investor sentiment and psychology.
Differences Between Dow Theory and Elliott Wave Theory
- Structure and Complexity: Dow Theory categorises trends into three types: primary, secondary, and minor, focusing on broad market movements. In contrast, Elliott Wave Theory offers a more detailed structure with specific wave patterns and sub-waves, providing a granular view of market movements.
- Predictive Capability: Elliott Wave Theory aims to predict future price movements by identifying current wave patterns, whereas Dow Theory is more descriptive, analysing past and present trends without explicit forecasting.
- Analytical Approach: Dow Theory relies on price action and volume data to confirm trends, while Elliott Wave Theory incorporates Fibonacci retracement levels and the fractal nature of markets to analyse wave patterns.
In summary, while both Dow Theory and Elliott Wave Theory offer valuable insights into market behavior, they differ in their complexity, analytical approaches, and applications. Traders may choose between them based on their individual preferences and the level of detail they seek in market analysis.
Dow Theory vs Wyckoff
The Wyckoff Method, developed by Richard D. Wyckoff in the early 20th century, is a technical analysis approach that focuses on understanding the intentions of large institutional investors, often referred to as the “Composite Man.” This method emphasises the analysis of price action and volume to identify market cycles, which are divided into four distinct phases:
- Accumulation: A period where informed investors begin to buy assets, anticipating a future uptrend.
- Markup: The phase where the broader market recognises the emerging trend, leading to increased buying activity and rising prices.
- Distribution: A stage where informed investors start selling their holdings, expecting a downturn.
- Markdown: The phase characterised by declining prices as the broader market follows the selling trend.
By analysing these phases, traders aim to align their positions with the activities of major market players, thereby enhancing their trading strategies.
Similarities Between Dow Theory and Wyckoff Method
- Trend Analysis: Both frameworks emphasise the importance of identifying and understanding market trends to make informed trading decisions.
- Market Phases: Each method recognises that markets move through distinct phases or cycles, reflecting the cyclical nature of market behavior.
- Volume Consideration: Both approaches incorporate trading volume as a critical factor in confirming trends and assessing market strength.
Differences Between Dow Theory and Wyckoff Method
- Analytical Focus: Dow Theory primarily analyses price movements and trends, focusing on the broader market direction. In contrast, the Wyckoff Method delves deeper into the behaviour of large institutional investors, aiming to understand their intentions and actions within the market.
- Market Phases Detail: While Dow Theory categorises trends into primary, secondary, and minor, the Wyckoff Method provides a more detailed breakdown of market cycles into accumulation, markup, distribution, and markdown phases.
- Application Approach: Dow Theory offers a more generalised framework for trend analysis, whereas the Wyckoff Method provides specific strategies for trading within each identified phase, offering a more tactical approach to market participation.
In summary, while both Dow Theory and the Wyckoff Method offer valuable insights into market behavior, they differ in their analytical focus and application strategies. Traders may choose between them based on their individual preferences and the level of detail they seek in market analysis.
What Common Mistakes Should Traders Avoid When Using the Dow Theory?
- Ignoring Secondary Trends:
Mistaking secondary corrections for trend reversals can lead to premature decisions. Traders should analyse the broader primary trend before reacting to short-term price movements. - Overlooking Volume Confirmation:
Failing to consider trading volume as a confirming factor may result in acting on weak or false signals. Volume should always support trend direction for a reliable signal. - Relying Solely on Index Confirmation:
While Dow Theory emphasises confirmation between indices like the DJIA and DJTA, traders should also consider sector and industry performance to gain a holistic view of the market. - Impatience with Trend Reversals:
Traders often misinterpret minor pullbacks as trend reversals. Dow Theory requires clear and sustained evidence before concluding a reversal has occurred. - Forgetting Market Context:
Applying Dow Theory without accounting for macroeconomic factors, such as interest rates or geopolitical events, can lead to incomplete analysis. - Neglecting Timeframes:
Misaligning the analysis with the intended trading timeframe can lead to poor decision-making. For example, long-term investors should prioritise primary trends, while short-term traders may focus on secondary or minor trends. - Overcomplicating the Analysis:
Dow Theory is straightforward by design. Overanalysing or seeking too many confirmations can delay decision-making and result in missed opportunities.
By avoiding these common pitfalls, traders can better leverage the Dow Theory to make informed and strategic market decisions.
FAQ
What is the goal of Dow Theory in the stock market?
The primary goal of Dow Theory is to identify and interpret market trends, enabling investors to make informed decisions by recognising the direction of the market—whether it’s bullish or bearish.
How is Dow Theory used in technical analysis?
Dow Theory forms the foundation of technical analysis by helping traders identify primary, secondary, and minor trends, analyse market phases, and confirm trends using volume and price action.
How does Dow Theory work in investment?
Dow Theory helps investors align their strategies with prevailing market trends by recognising phases such as accumulation, public participation, and distribution, reducing emotional decision-making.
What are the 3 trends of the Dow Theory?
Dow Theory identifies three types of trends: primary (long-term), secondary (medium-term corrections), and minor (short-term fluctuations).
What do the critics say about the Dow Theory in the stock market?
Critics argue that Dow Theory can be slow to signal reversals, relies heavily on historical data, and may not account for modern market dynamics or behavioural anomalies.
What is the performance of Dow Theory?
Dow Theory has shown consistent performance in identifying long-term trends but can lag during short-term reversals or volatile markets.
Which time frame to choose?
The time frame depends on your trading goals: long-term investors should focus on primary trends, while short-term traders might prefer analysing secondary or minor trends.
What is Dow Theory in Forex?
In Forex, Dow Theory applies similarly by identifying currency pair trends such as EUR/USD vs DXY, using phases like accumulation and distribution to anticipate price movements.
What is the origin of the Dow Theory?
The Dow Theory was developed by Charles H. Dow, co-founder of Dow Jones & Company, and later expanded by analysts like William P. Hamilton and Robert Rhea.
What is the other term for Dow Theory?
The Dow Theory is sometimes referred to as the “foundation of technical analysis” due to its significant influence on market analysis methodologies.
What Dow Theory books would you recommend for further study?
- The Stock Market Barometer by William P. Hamilton.
- The Dow Theory by Robert Rhea.
- Technical Analysis of Stock Trends by Robert D. Edwards and John Magee.


