


Verfasst von:

- Elliott Wave
- Juni 1, 2026
- 2 Min. Lesezeit
Silver Elliott Wave Forecast: Bouncing Higher
Executive Summary
- Trend Bias: Silver’s weeklong rally appears incomplete.
- Current Wave Structure: Partial retracement higher wave ((b)).
- Key Level: 71.79, the May 28 low.
Current Elliott Wave Analysis
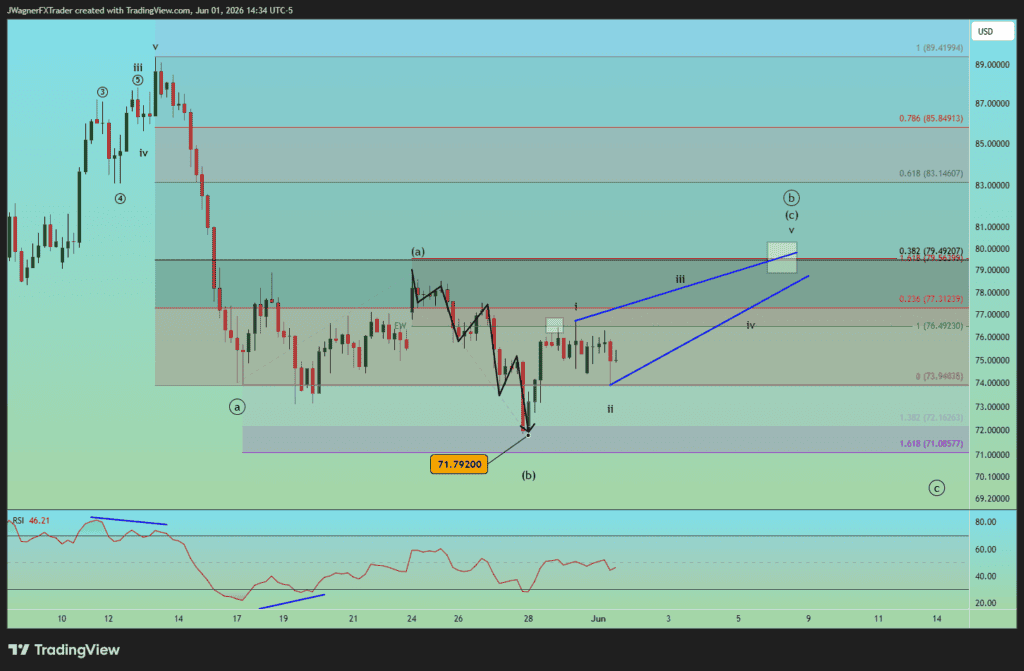
The Elliott wave analysis for Silver (XAG/USD) suggests it is currently in a corrective rally phase wave ((b)). This rally is the second wave of a large ((a))-((b))-((c)) decline. Wave ((b)) is a rally wave then followed by wave ((c)) a declining trend.
Wave ((b)) is shaping like an expanded flat pattern labeled (a)-(b)-(c). Currently, the rally is viewed within wave (c) of ((b)), possibly an ending diagonal.
This diagonal is shaped like a rising wedge and would be bearish as it approaches the May 24 high. The diagonal would have 5-waves labeled i-ii-iii-iv-v. It appears wave ii just finished so I suspect the next trend is higher.
There are a couple of wave relationships that appear near 79.50.
First, the 38% Fibonacci retracement level of wave ((a)) sits at 79.49.
Additionally, using the Fibonacci extension tool, wave (c) is 1.618 times the length of (a) near 79.56…a common wave relationship.
Therefore, if silver is successful on grinding higher up to near 79.50, then we’ll be on the lookout for a top in wave ((b)) and a bearish reversal to carry below 71.79.
So long as the current rally holds above 71.79, then this wave count remains valid.
Bottom Line
Silver’s Elliott Wave structure suggests the current bounce is incomplete and could rally to 79.50. If silver prices fall below 71.79, then wave ((c)) down may already be in force.


