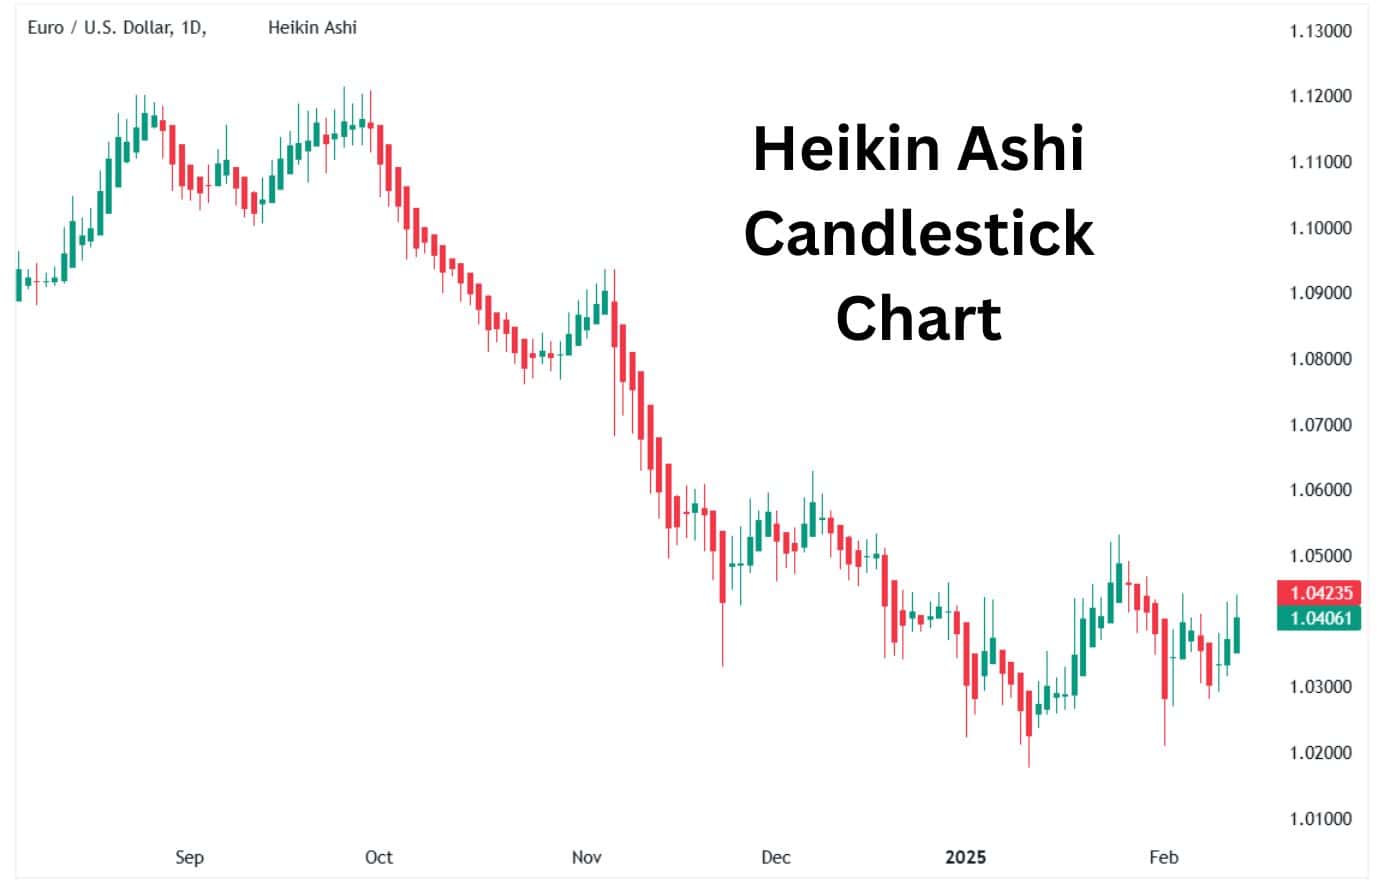
What is a Heikin Ashi?
Heikin ashi charts are used by technical traders to smooth out the Japanese candlestick patterns making it easier to spot trends and reversal points. Heikin ashi is a Japanese term meaning “average bar.” Heikin ashi candles plot the average price data for each period. They do not plot the exact price changes like regular Japanese candlestick charts. By plotting the average price data, heikin ashi charts help traders identify more significant trends.
Heikin Ashi Candle
A heikin ashi candle uses the foundational prices of the Japanese candle – the open, high, low, and close. The heikin ashi candle plots the average closing (using data from the previous candle), opening, high and low prices reached within a specific period. This means the color of the heikin ashi candle could be different from the Japanese candlestick. The result is a smoothed trend of color on the price chart making the trends easier to identify.
The Heikin Ashi Formula
The heikin ashi candles are calculated as follows:
Close Price = (Open + High + Low + Close) / 4
This is the average of the candle’s four central values.
Open Price = (Previous Candle’s Open + Previous Candle’s Close) / 2
This creates a smooth transition between candles.
High Price = The highest value among the High, Open, and Close.
Low Price = The lowest value among the Low, Open, and Close.
This formula generates candles that emphasise trends and filter out short-term fluctuations. They create a generally smoothed color of trends on the heikin ashi chart.
How to Calculate Heikin Ashi
To calculate Heikin Ashi candles, follow these steps for each period (e.g., daily, hourly):
- Calculate the Close Price
Close = (Open + High + Low + Close) / 4
This is the average of the current period’s four main price points. Unlike a normal candlestick chart, which shows real-time price data, Heikin Ashi uses averaged prices to smooth out transitions from the previous to current candle.
- Calculate the Open Price
Open = (Previous Open + Previous Close) / 2
The open value is a midpoint of the previous Heikin Ashi candle.
- Determine the High Price
High = max(High, Open, Close)
The high is the greatest value among the current period’s high, open, and close prices.
- Determine the Low Price
Low = min(Low, Open, Close)
The low is the smallest value among the current period’s low, open, and close prices.
Example of Heikin Ashi Calculation
- Suppose the following values for a period:
- Open: 1.1000
- High: 1.1200
- Low: 1.0900
- Close: 1.1100
- Previous Heikin Ashi Candle:
- Open: 1.0950
- Close: 1.1050
Using the formulas:
- Close = (1.1000 + 1.1200 + 1.0900 + 1.1100) / 4 = 1.1050
- Open = (1.0950 + 1.1050) / 2 = 1.1000
- High = max(1.1200, 1.1000, 1.1050) = 1.1200
- Low = min(1.0900, 1.1000, 1.1050) = 1.0900
The resulting Heikin Ashi candle has:
- Open: 1.1000
- Close: 1.1050
- High: 1.1200
- Low: 1.0900
This calculation smooths price data, making trends more evident for traders.
How to Identify the Heikin Ashi Pattern?
To spot and interpret Heikin Ashi patterns, focus on the characteristics of the candles as they reveal the market’s trend direction and momentum. These patterns help traders understand the overall price trend in the market.
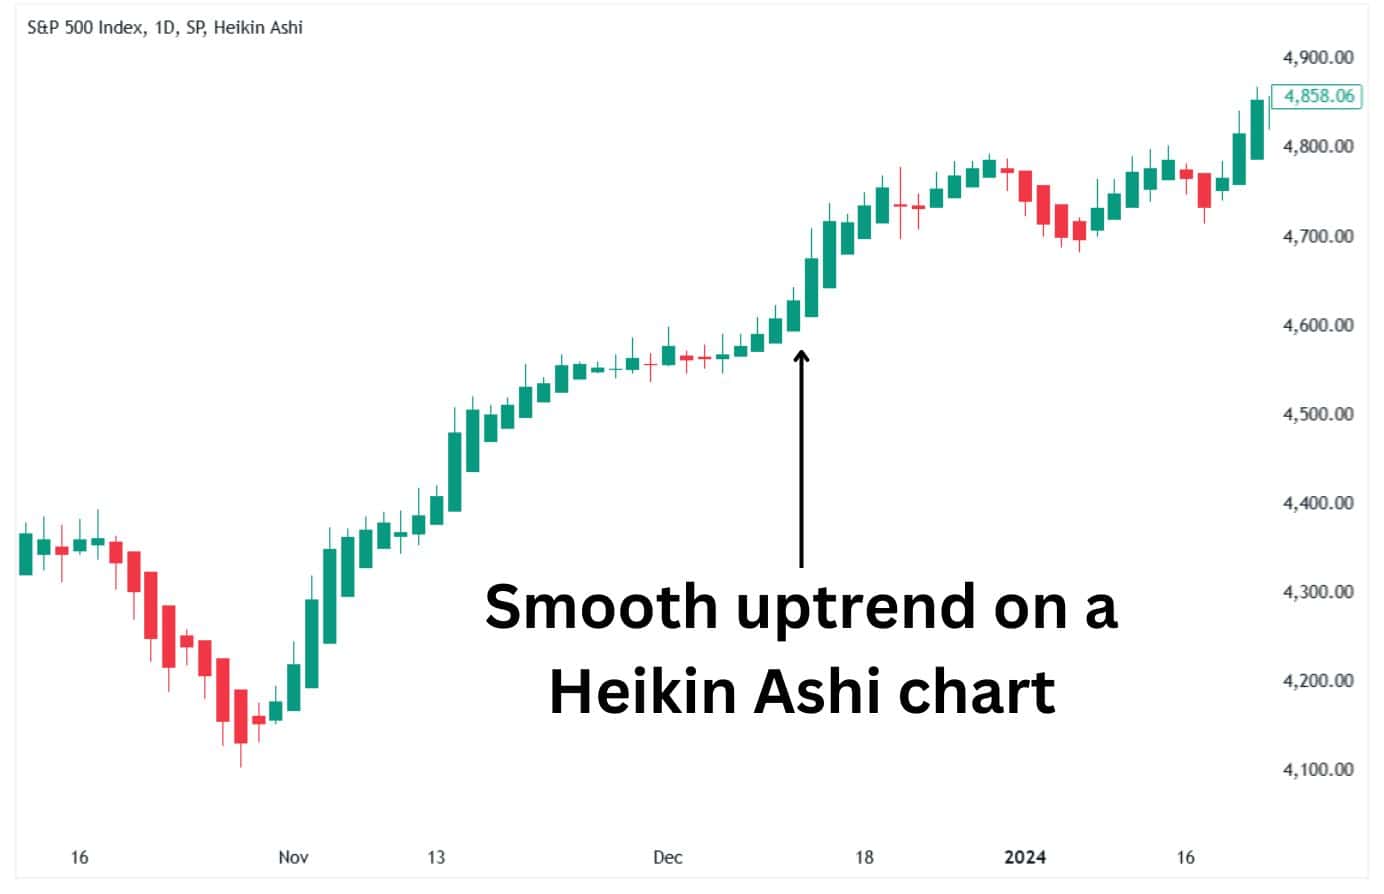
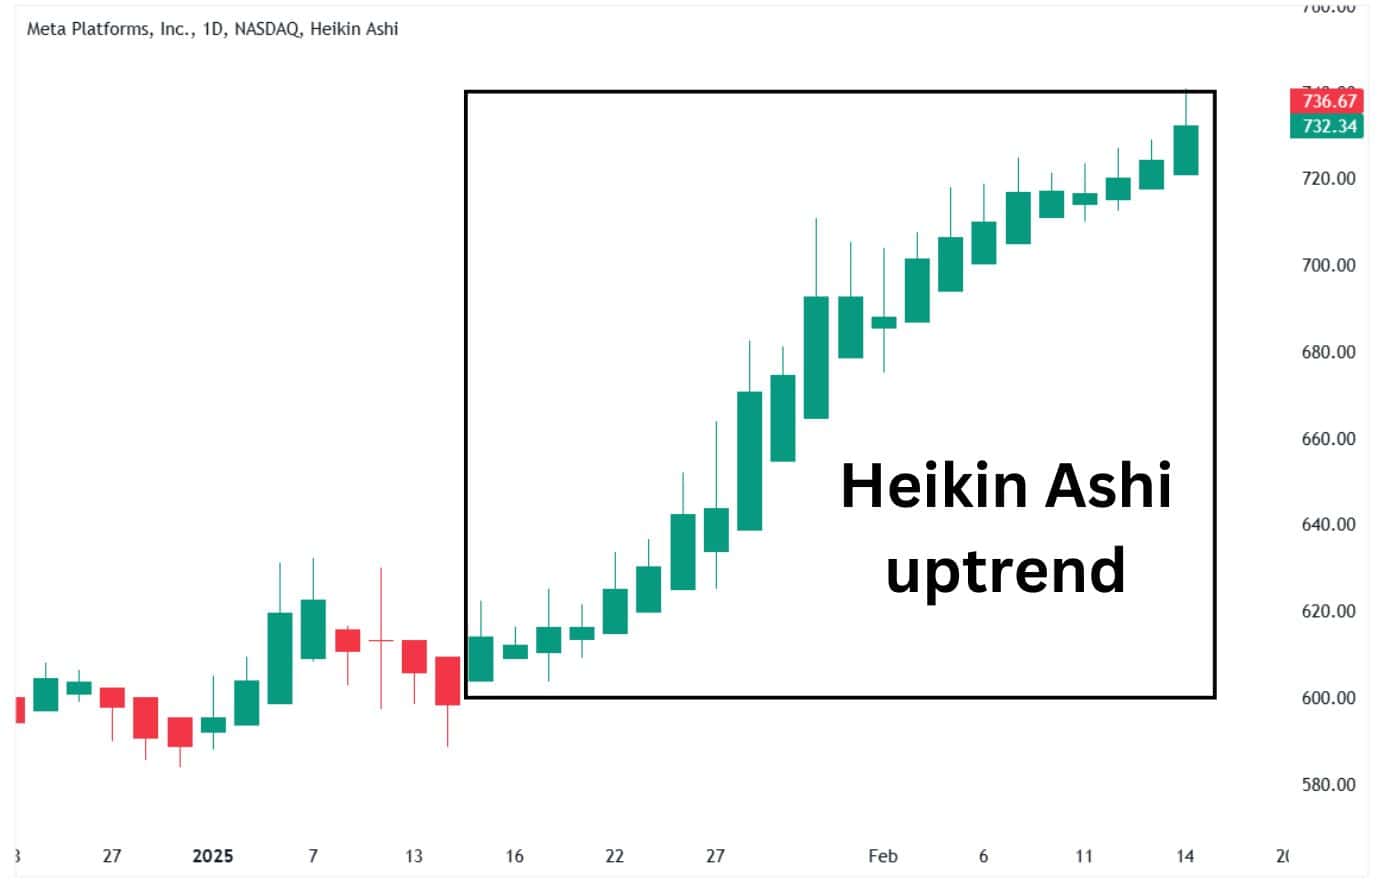
1. Strong Uptrend (Bullish Pattern)
- Appearance: A series of green candles with no lower shadows (or tiny ones).
- Interpretation: The market is powerfully moving upward. Buyers are in control, and momentum is steady.
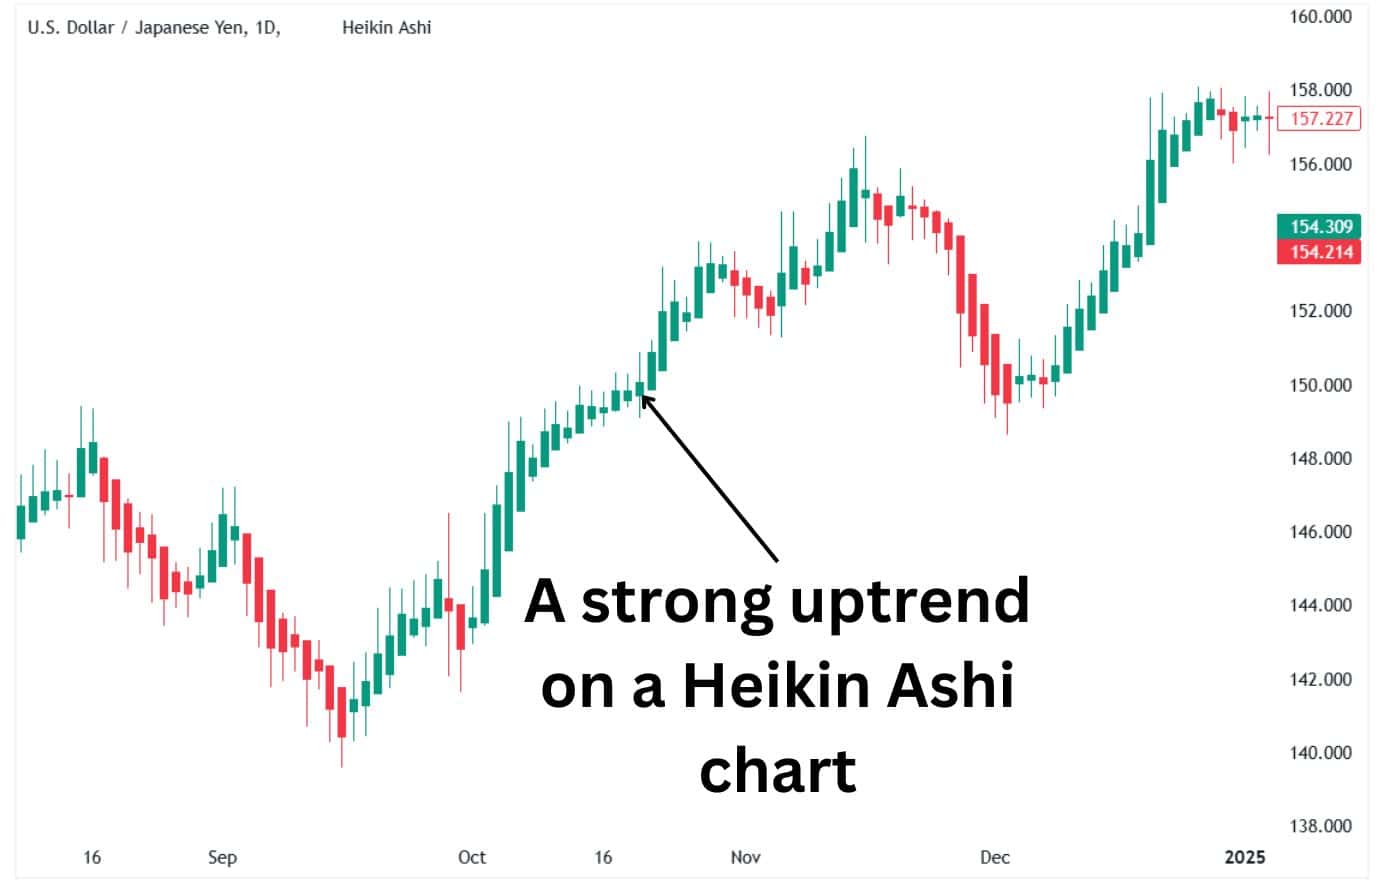
Action: Consider staying in long (buy) positions or entering if the trend has just begun.
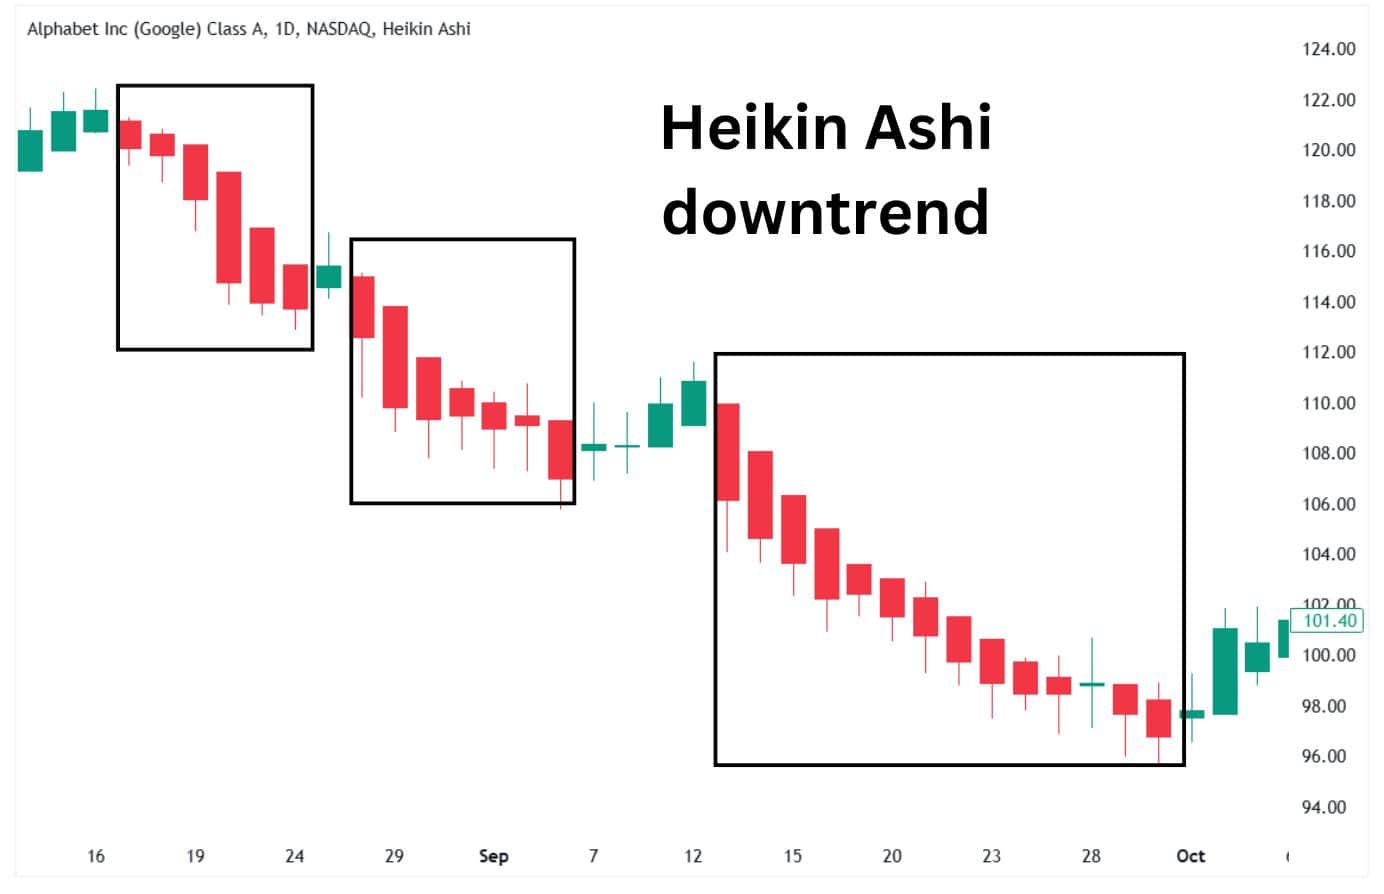
2. Strong Downtrend (Bearish Pattern)
- Appearance: A series of red candles with no upper shadows (or tiny ones).
- Interpretation: The market is in a steady downward trend. Sellers are dominant, and prices are falling consistently.
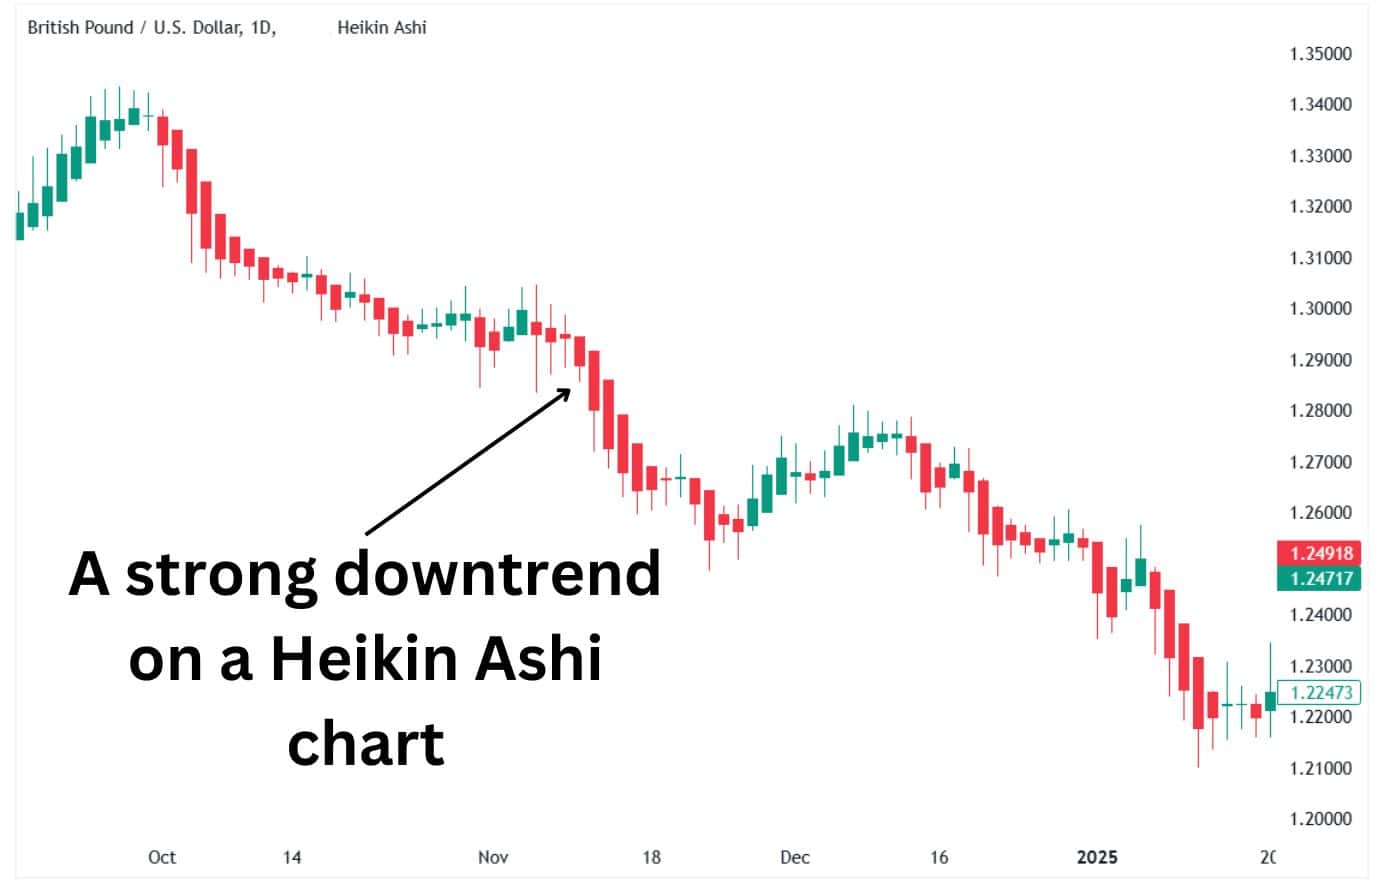
Action: Consider holding or entering short (sell) positions.
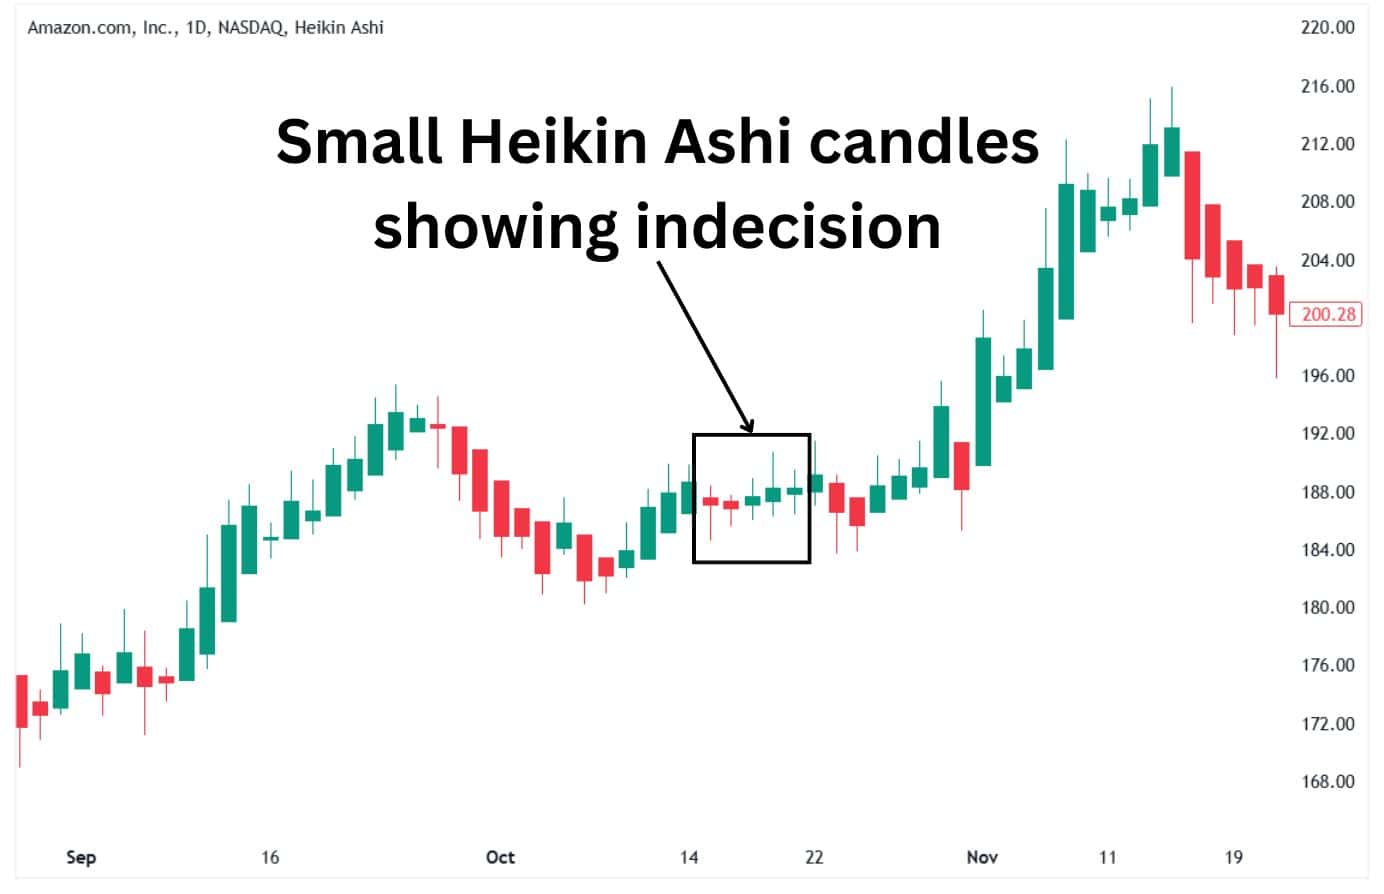
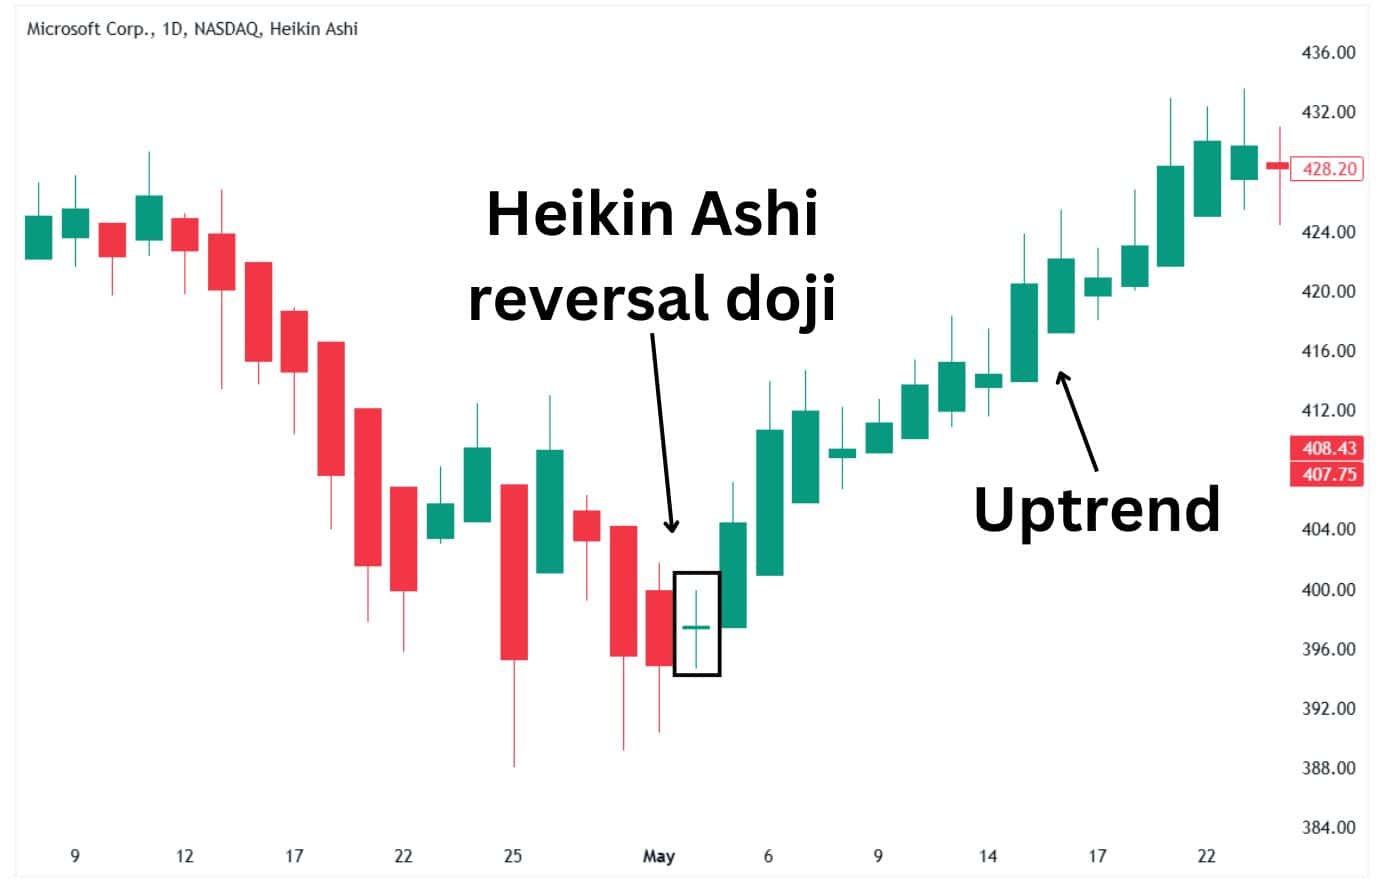
3. Doji or Indecision Pattern
- Appearance: Small-bodied candles with both upper and lower shadows.
- Interpretation: The market is uncertain, and buyers and sellers are evenly matched. A potential trend reversal or consolidation may follow.
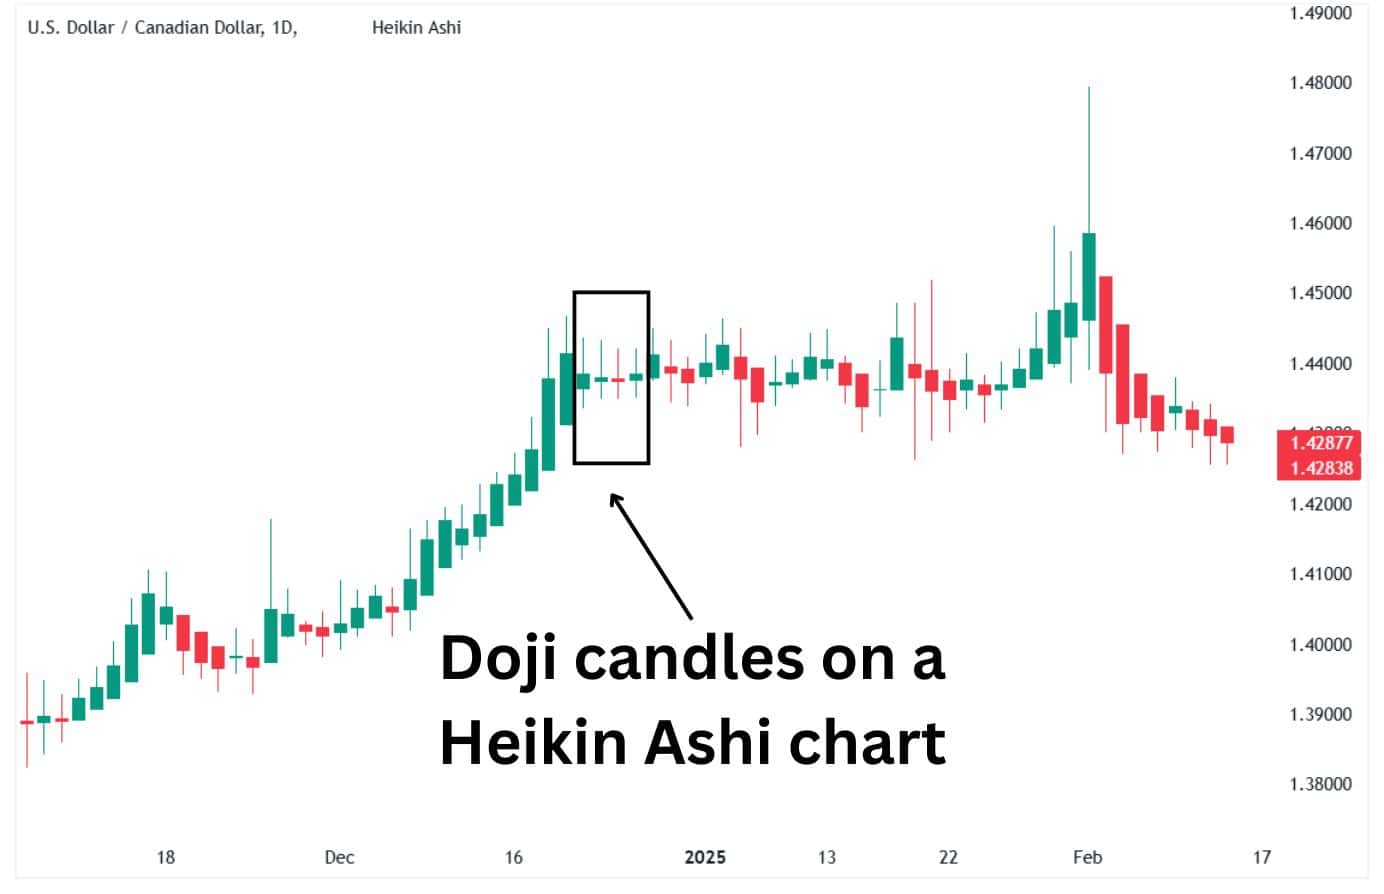
Action: Wait for confirmation of the next trend direction before acting.
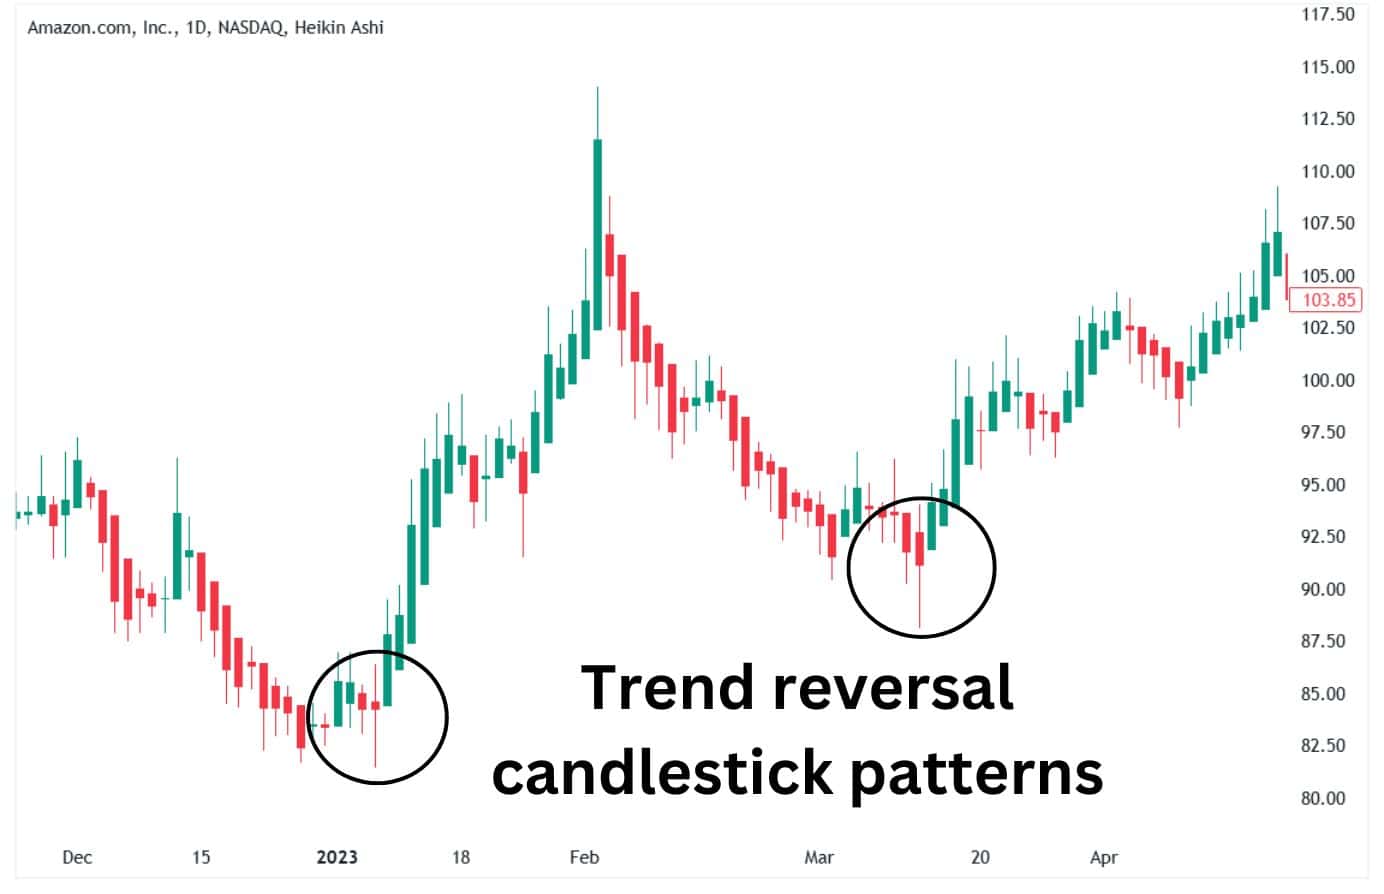
4. Reversal Candles
- Bullish Reversal: A green/red candle following a sequence of red candles, frequently featuring a long lower shadow.
- Bearish Reversal: A red/green candle following several green candles, frequently featuring a long upper wick.
- Interpretation: These candles indicate that the prior trend could be losing strength, and a reversal might occur.
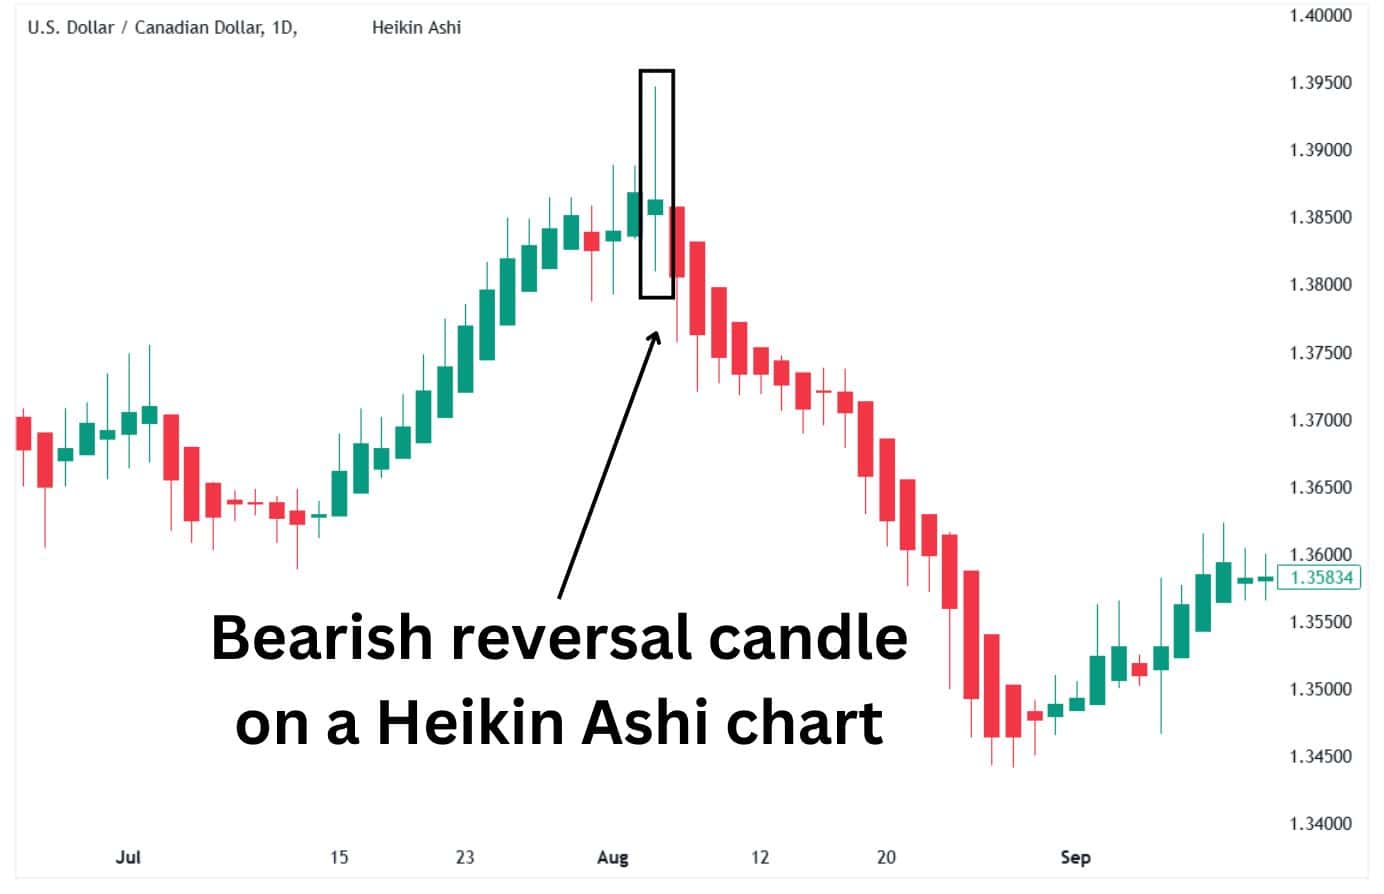
Action: Before making a trade, seek further validation, such as a breach of a support or resistance level.
Tips for Identifying Patterns
- Employ Heikin Ashi alongside trend indicators such as moving averages or the RSI for validation.
- Focus on patterns of candles instead of lone ones for a clearer insight into market trends.
- Refrain from analysing trends in low-volume markets, since they may provide deceptive indications.
Examining Heikin Ashi candlesticks using these concepts helps you identify trends and predict possible reversals more efficiently.
Key Characteristics of Heikin Ashi Charts
- Smooth Trends
- Heikin Ashi candles filter out noise by averaging price data.
- Trends are more apparent, with fewer false signals compared to traditional candlesticks.
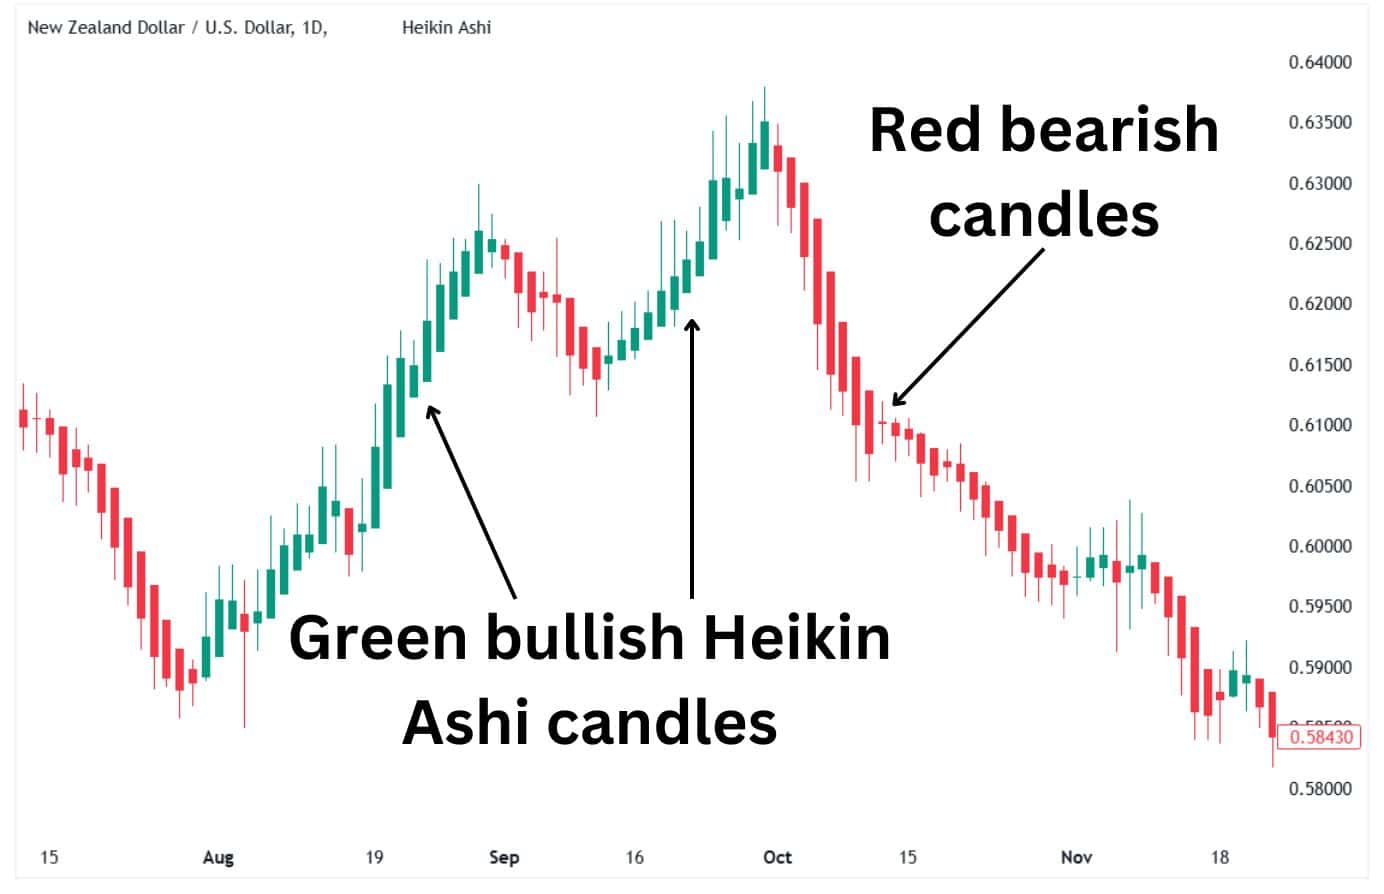
- Color Coding for Trends
- Green Candles: Indicate bullish trends (upward movement).
- Red Candles: Indicate bearish trends (downward movement).
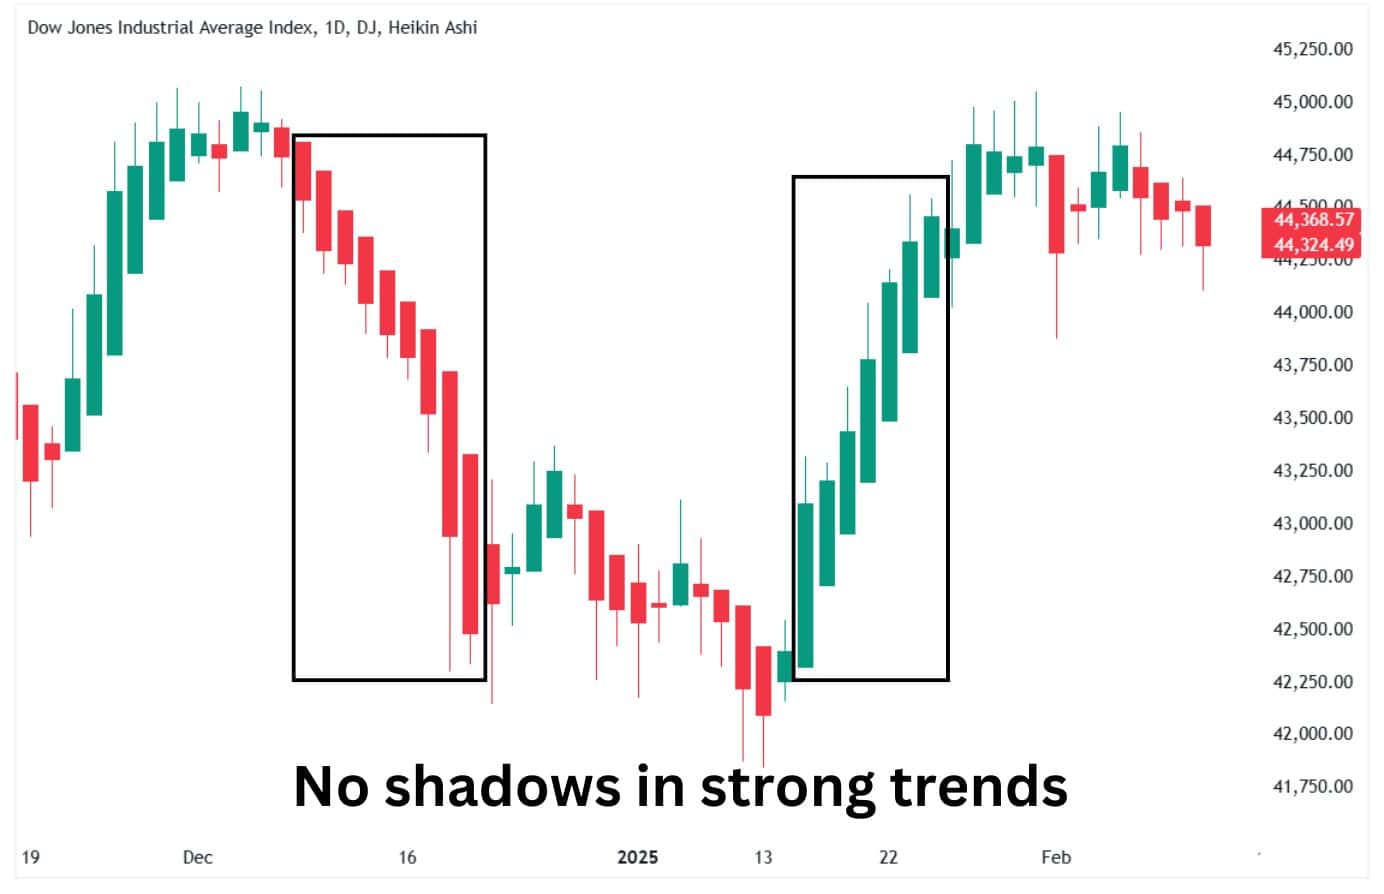
- No Shadows in Strong Trends
- Uptrend: Green candles often lack lower shadows, showing strong buying pressure.
- Downtrend: Red candles often lack upper shadows, reflecting dominant selling pressure.
- Small Bodies Signal Indecision
- Candles with small bodies and both shadows suggest market indecision or potential reversals.
- Reversal Indicators
- A change in candle color, often accompanied by long shadows, can signal a possible trend reversal.
- Lagging Nature
- Since Heikin Ashi uses averaged prices, patterns may lag slightly behind real-time market changes, making it best for identifying existing trends rather than predicting rapid shifts.
These characteristics make Heikin Ashi ideal for identifying clear trends, filtering out market noise, and avoiding hasty trading decisions.
What Does a Heikin Ashi Tell You?
Heikin Ashi informs traders of the general market trend by mitigating price variations. Rather than displaying every minor fluctuation like conventional candlesticks, Heikin Ashi emphasises whether the market trends upward, downward, or sideways.
Key takeaways:
- Green Candles: The market is trending upward (bullish momentum).
- Red Candles: The market is trending downward (bearish momentum).
- Small Candles with Shadows: The market is uncertain or entering a potential reversal phase.
By focusing on trends rather than noise, Heikin Ashi helps traders avoid overreacting to small price movements and make better-informed decisions.
How to use the Heiken Ashi indicator?
- Spot Trends Easily
- Green candles with no lower shadows suggest strong upward momentum.
- Red candles with no upper shadows indicate strong downward momentum.
Action: Stay with the trend until you see signs of a reversal.
- Identify Trend Reversals
- Look for a shift in candle colors (e.g., red to green or green to red).
- Pay attention to candles with long wicks, as they can signal a weakening trend.
Action: Wait for confirmation before entering a new position.
- Filter False Signals
- Heikin Ashi smooths out market noise, so use it to confirm trends rather than reacting to every price spike.
Action: Combine it with other indicators like the RSI or moving averages for stronger signals.
- Use on Longer Timeframes
- Heikin Ashi works best on 1-hour charts and above, where trends are more reliable.
Action: Avoid using it for scalping or in very volatile markets.
- Set Entry and Exit Points
- Use green candles to ride an uptrend and red candles to stay with a downtrend. Exit when the color changes or signals weaken.
By using Heikin Ashi charts, traders can focus on broader market movements and reduce the impact of noise, making it easier to ride trends and spot turning points.
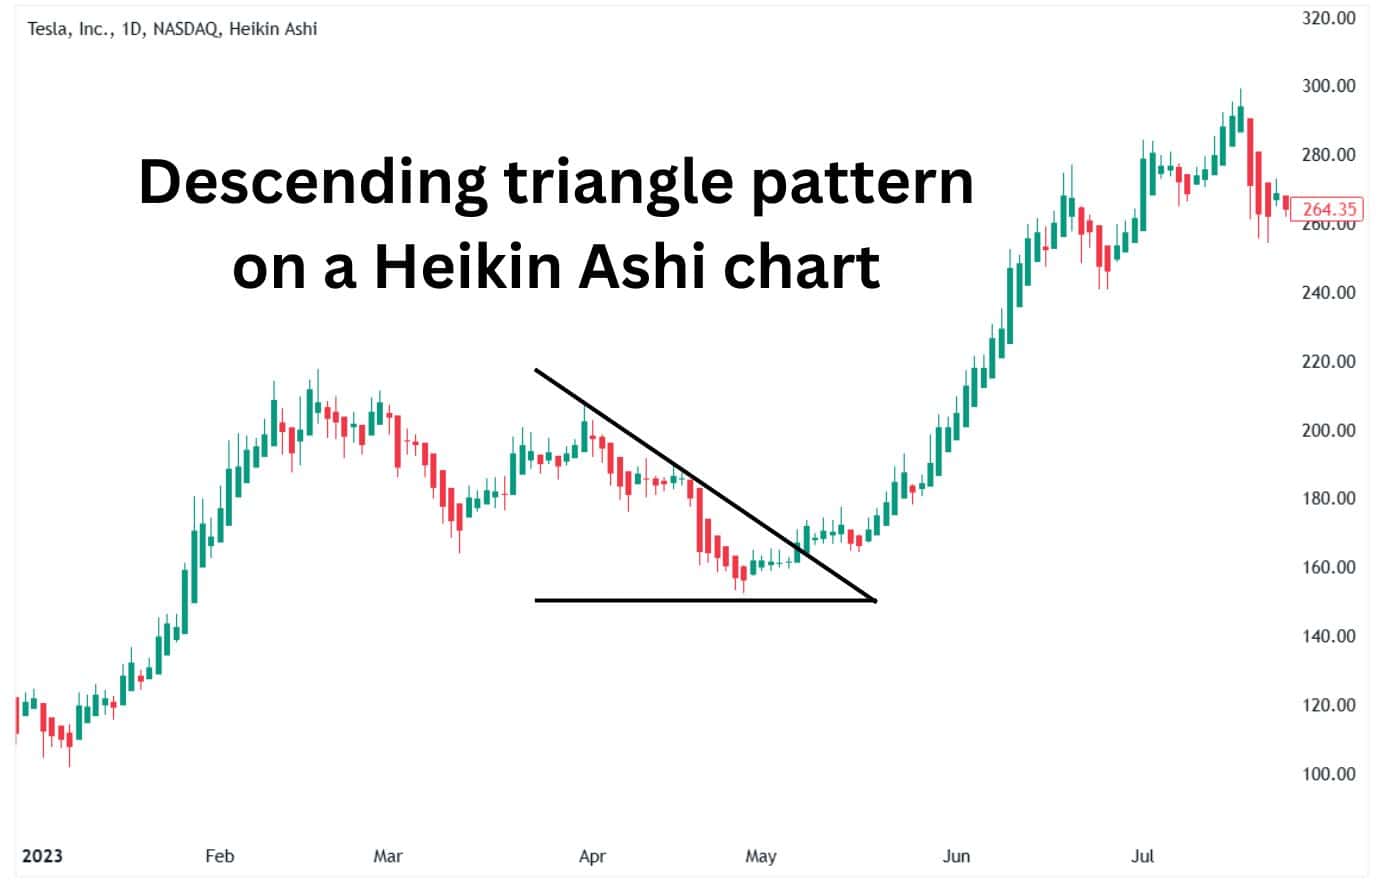
Classic Chart Patterns and Heikin-Ashi
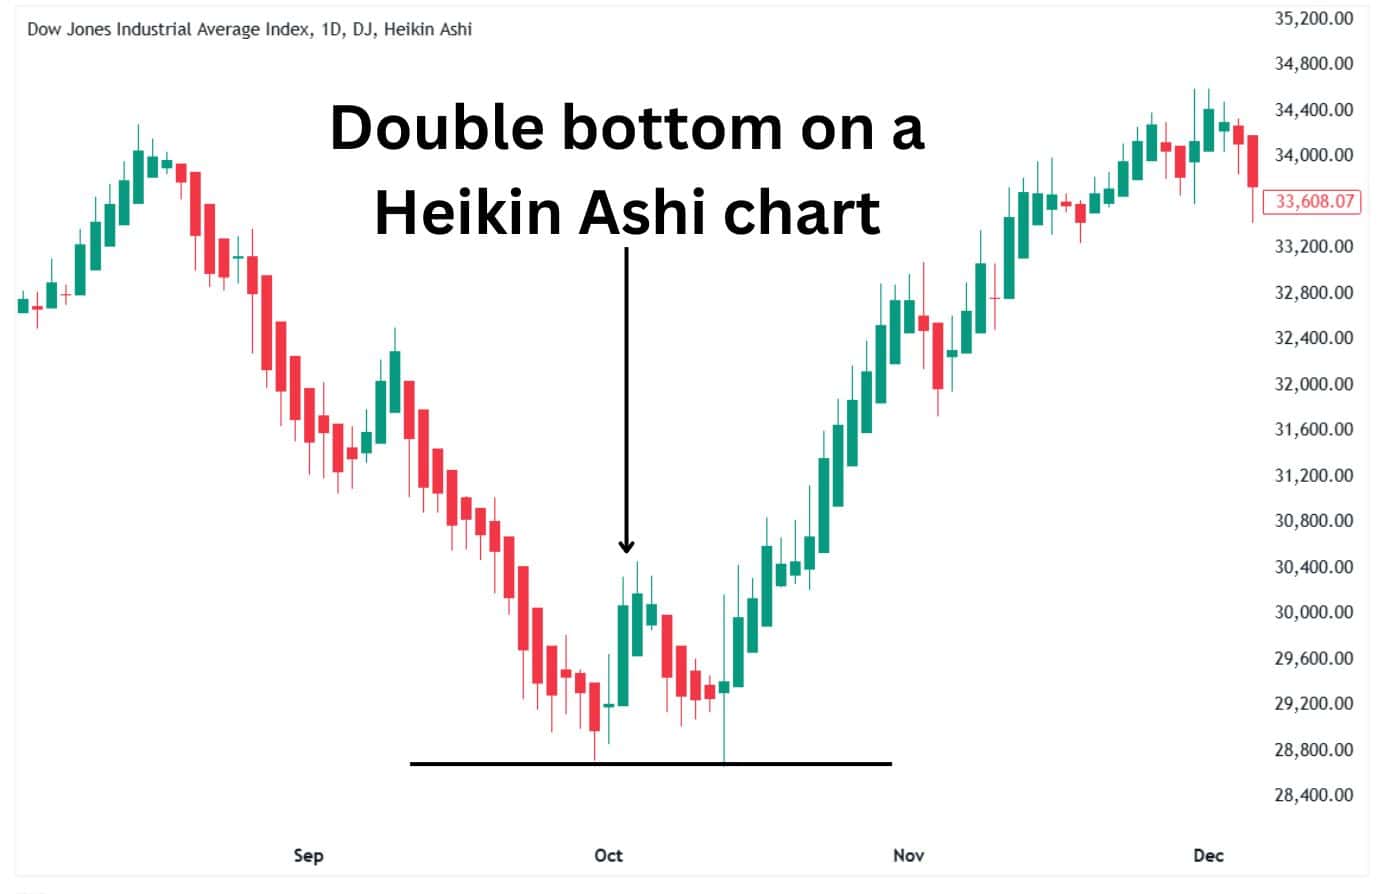
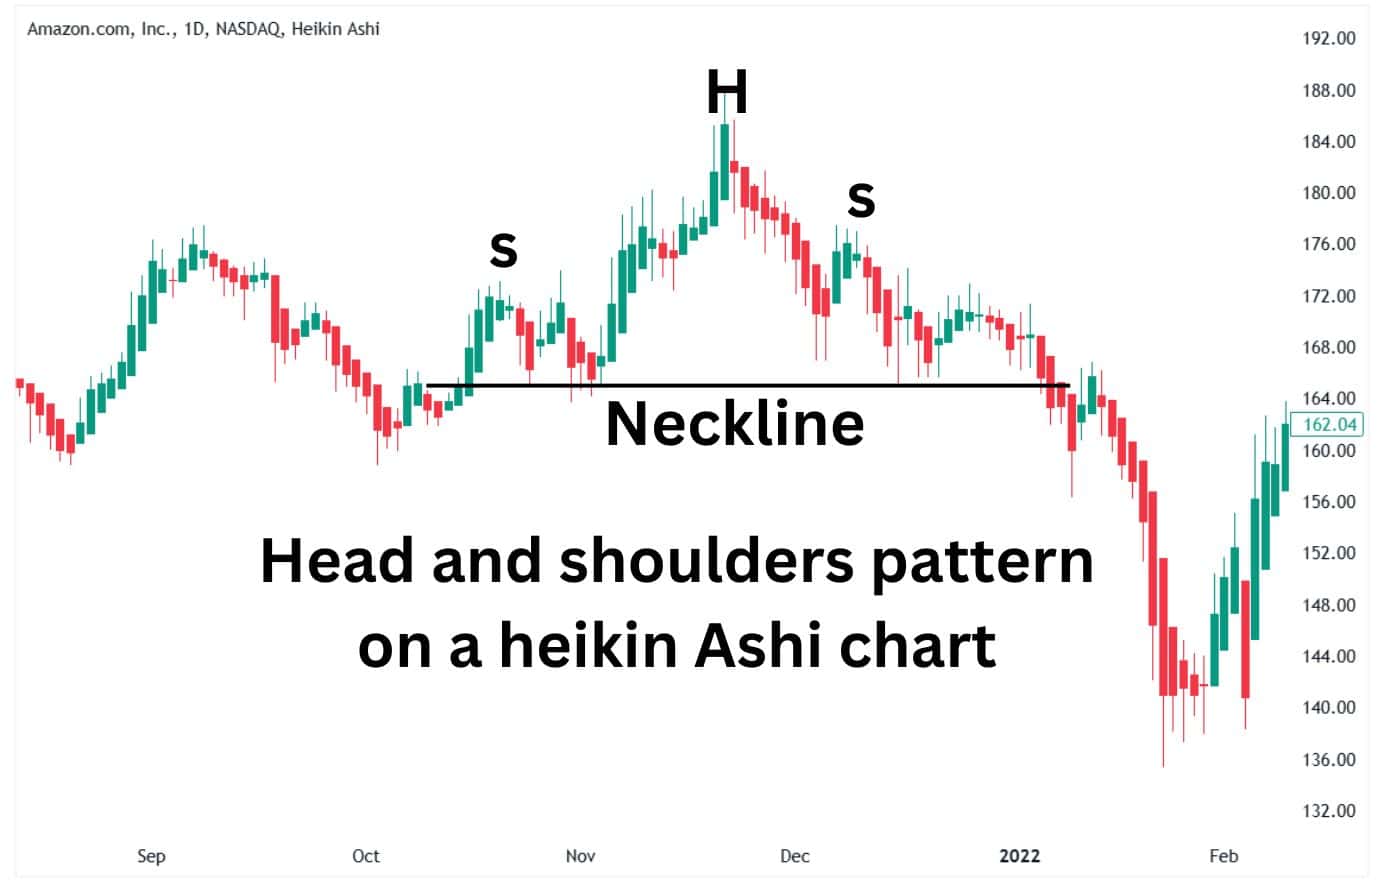
Heikin Ashi can enhance traditional chart patterns such as triangles, double tops, and head-and-shoulders by clarifying trends. These patterns typically signify areas where prices may break out, reverse, or consolidate, and Heikin Ashi improves this by refining the price fluctuations within them.
- Triangles (Ascending, Descending, Symmetrical): Heikin Ashi candles help identify the breakout’s direction. For instance, a sequence of green candles lacking lower shadows indicates an upward breakout from a triangle.
- Double Tops and Bottoms: Heikin Ashi more distinctly emphasises trend reversals. Look for a shift in candle color and wicks that show rejection of price levels.
- Head and Shoulders: Heikin Ashi’s color transitions and shadow patterns can confirm a neckline break, making it easier to spot the reversal.
By combining Heikin Ashi with classic patterns, traders get smoother visuals and more reliable confirmation of key market movements.
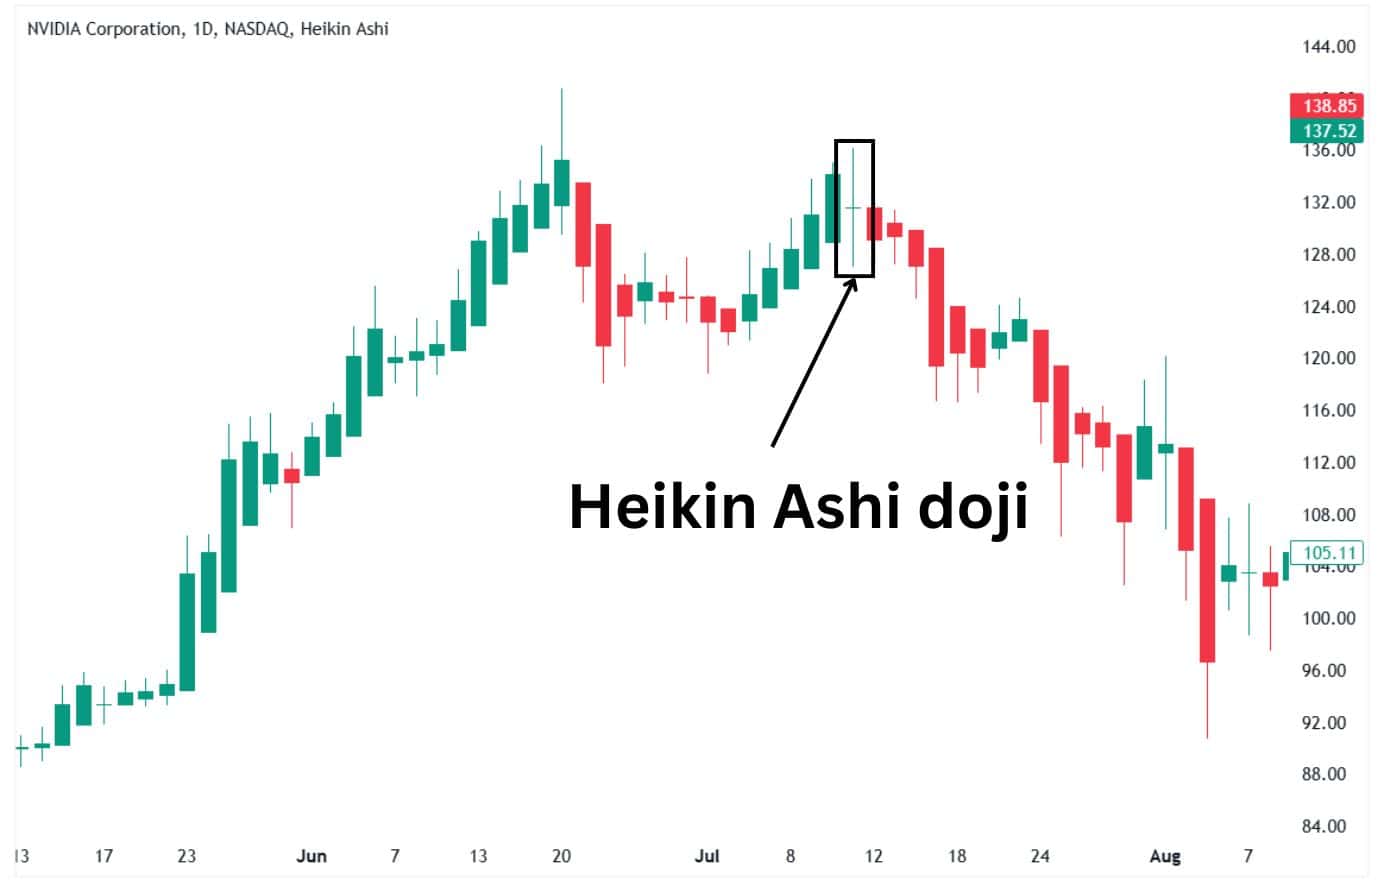
Heikin Ashi Doji and Spinning Tops
Doji and Spinning Tops in Heikin Ashi charts indicate indecision or balance between buyers and sellers, often signalling a potential trend reversal or pause.
- Heikin Ashi Doji:
- Appearance: A small body with shadows on both sides.
- Meaning: The market is at a critical junction where neither buyers nor sellers have full control of the price.
- Action: Wait for the next candle to verify if the trend will reverse or continue.
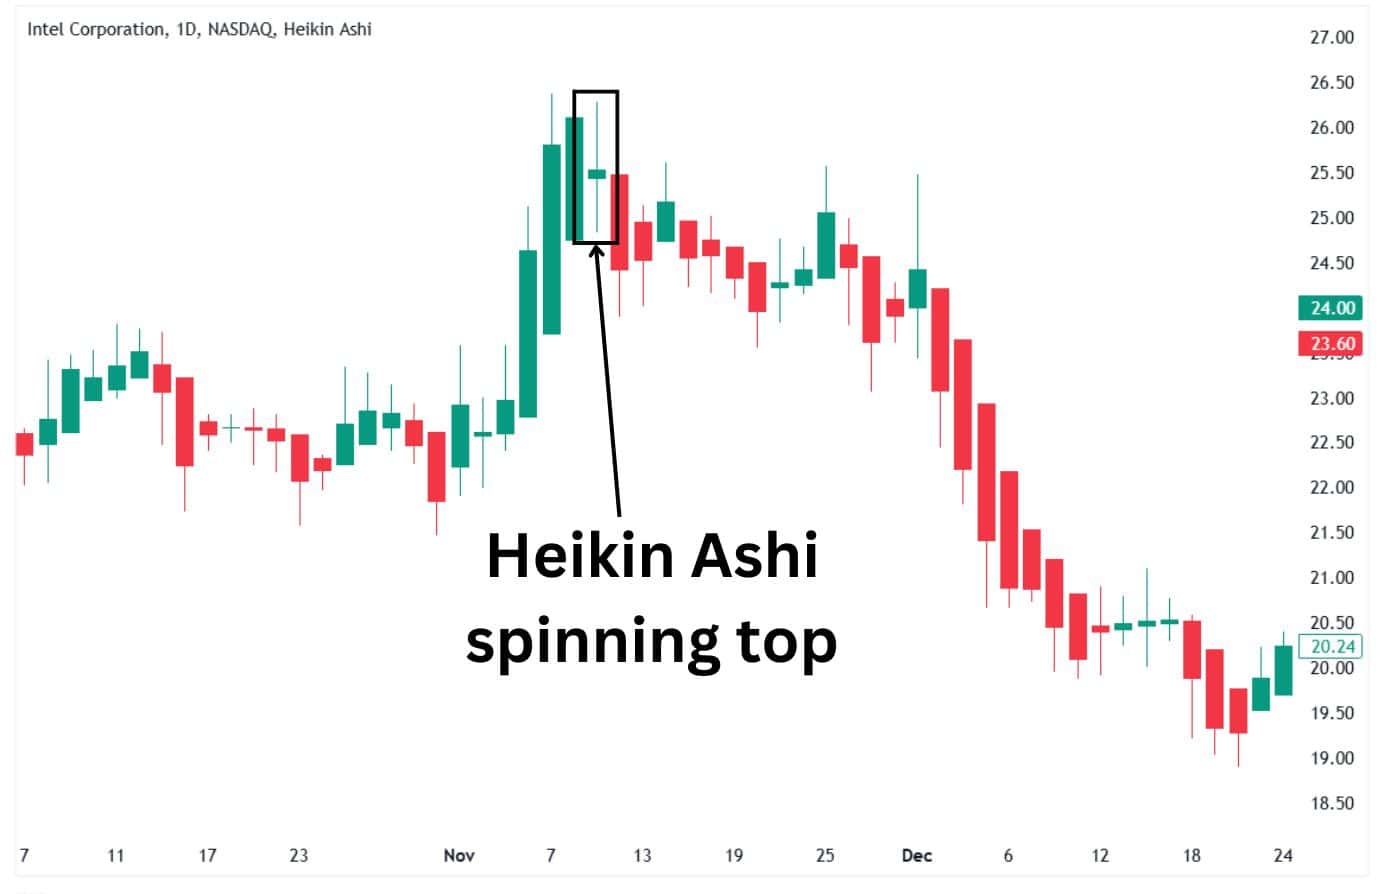
- Heikin Ashi Spinning Tops:
- Appearance: Small body with longer shadows on both sides.
- Meaning: Similar to a Doji, it shows market indecision, but with slightly more activity.
- Action: These often appear during consolidations or before reversals, so monitor the next candles for clarity.
Key Tip: Pair these signals with other tools, such as support/resistance levels or indicators (e.g., RSI), to strengthen your analysis. This helps filter out false signals and ensures better trading decisions.
Heikin Ashi Examples
Uptrend Example (Bullish Trend):
- Appearance: A series of green Heikin Ashi candles with no or tiny lower shadows.
- Interpretation: Strong buying momentum, ideal for holding or entering long positions.
Downtrend Example (Bearish Trend):
- Appearance: Consecutive red candles with no upper shadows.
- Interpretation: Selling pressure dominates, this is suitable for short positions.
Reversal Example:
- Appearance: A green candle after multiple red candles or a red candle after several green candles.
- Interpretation: This signals a potential trend reversal, but it should be confirmed with other indicators, such as the RSI or support/resistance levels.
Heikin Ashi Trading Strategies
Heikin Ashi candles help smooth out price action, making trends easier to spot. These candles focus on average prices, which reduces market noise and highlights clearer trends. Pairing Heikin Ashi with popular indicators can refine entry and exit points for trades. Here’s how they work with different tools:
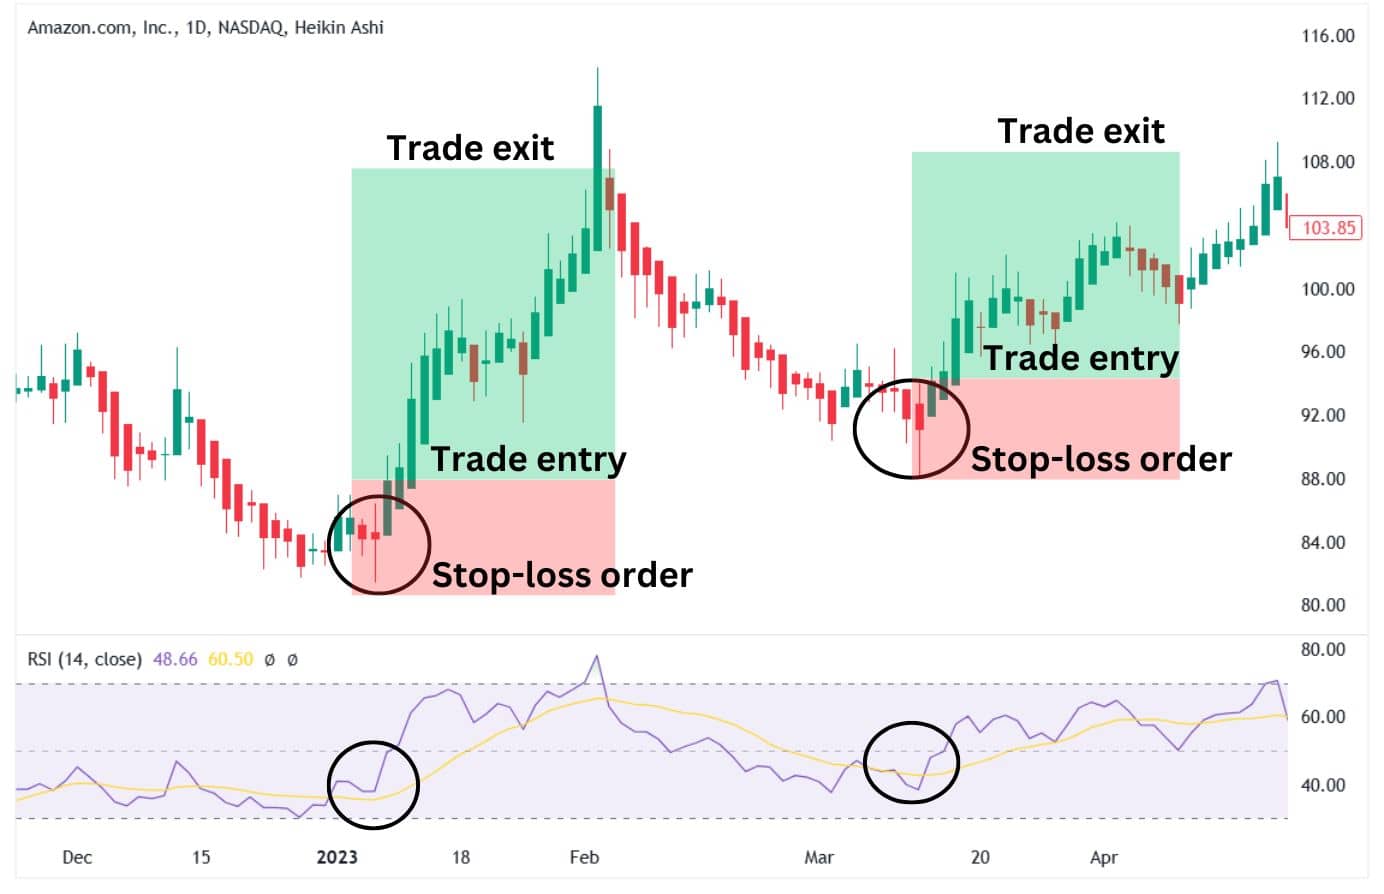
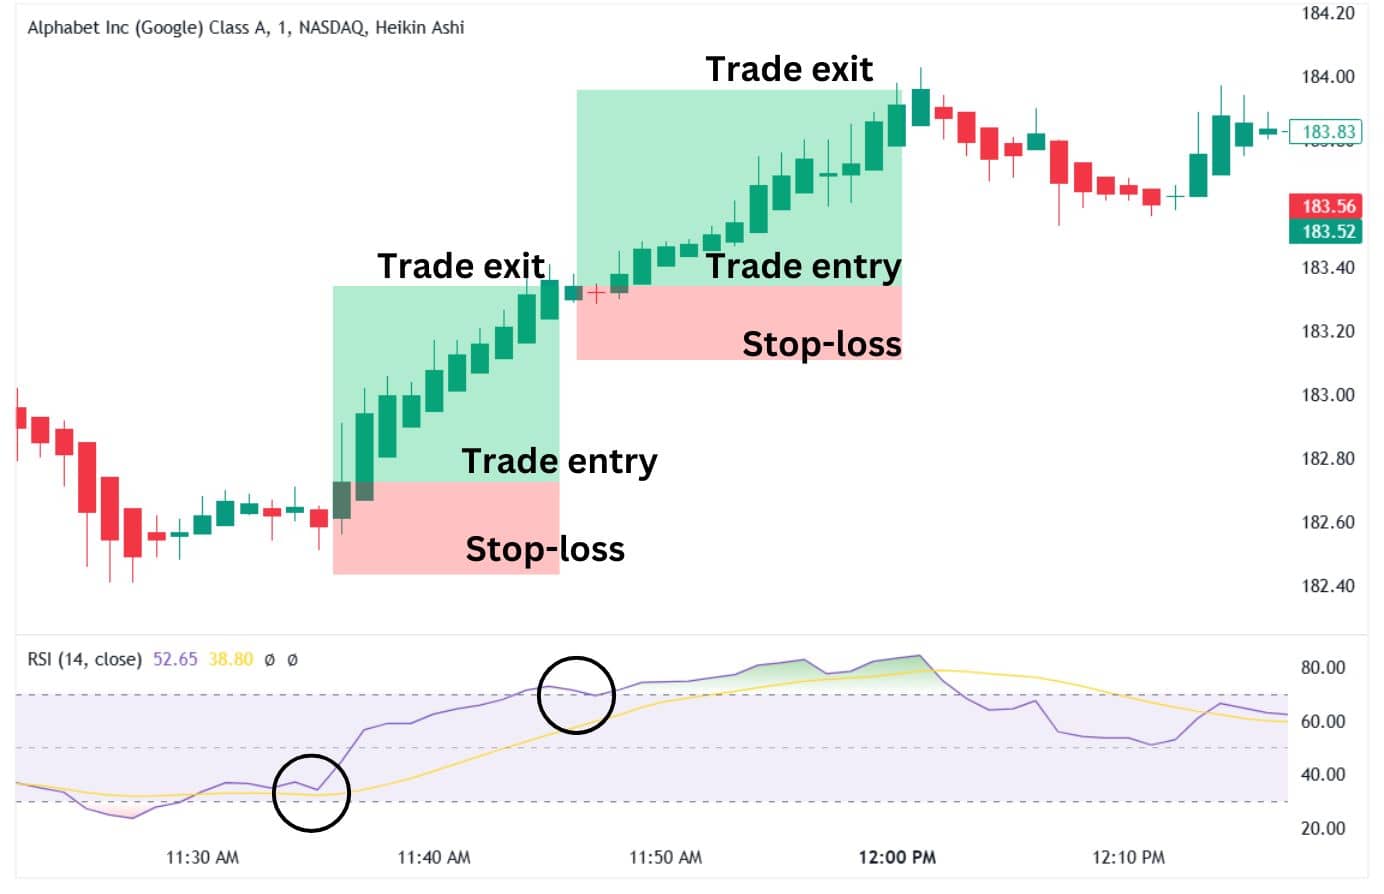
Heikin Ashi with RSI
The Relative Strength Index (RSI) measures momentum and helps identify when a market is overbought or oversold.
How to use the RSI with Heikin Ashi candles
- Look for Heikin Ashi candles showing a strong trend (several consecutive green or red candles).
- Check the RSI:
- If the RSI crosses above 30, it may signal a buying opportunity in an uptrend.
- If the RSI drops below 70, it could indicate a selling opportunity in a downtrend.
- Combine the signals: Wait for Heikin Ashi to confirm the RSI move with a color change. For example, a green candle forming after the RSI exits the oversold zone could indicate a buy.
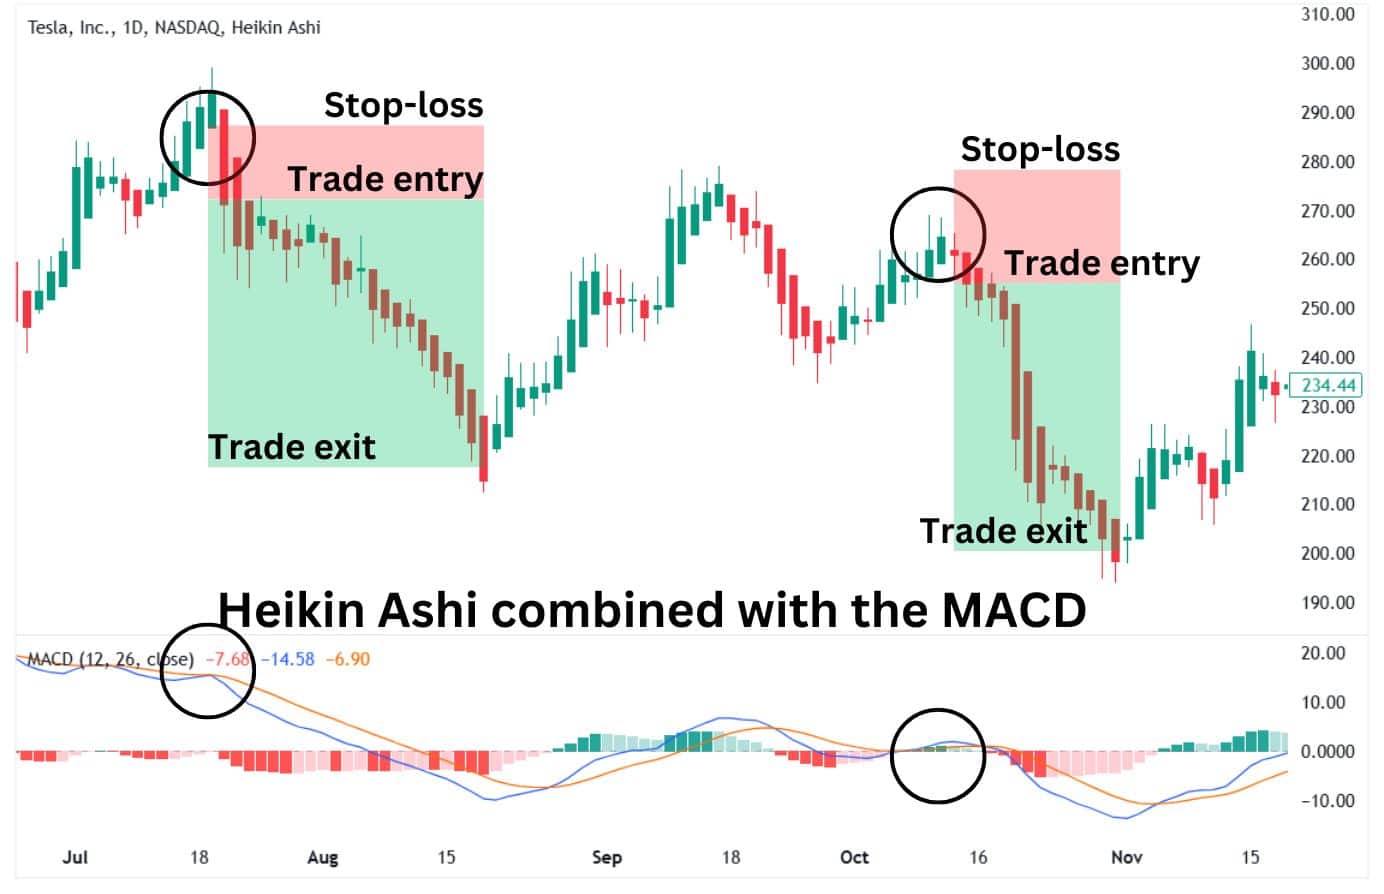
Heikin Ashi with MACD
The Moving Average Convergence Divergence (MACD) tracks the relationship between two moving averages to find trend changes and momentum shifts.
How to use the MACD with Heikin Ashi candles
- Identify a trend with Heikin Ashi candles: A series of green candles suggests an uptrend, while red indicates a downtrend.
- Look at the MACD histogram and signal line:
- A bullish crossover when the MACD line moves above the signal line indicates a potential uptrend.
- A bearish crossover when the MACD line falls below the signal line signals a potential downtrend.
- Confirm signals: Enter trades when both the MACD and Heikin Ashi candles suggest the same trend direction.
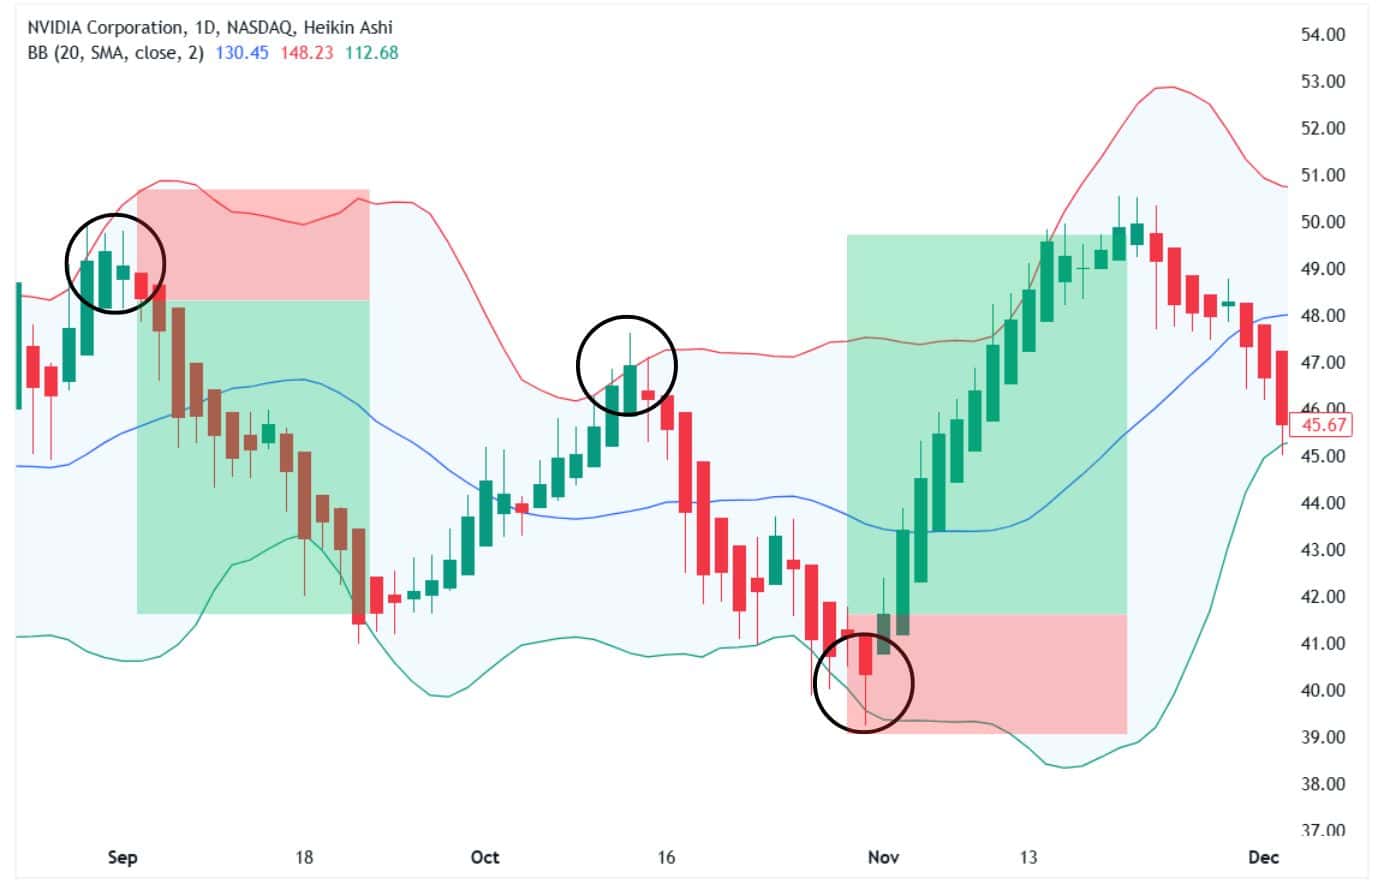
Heikin Ashi with Bollinger Bands
Bollinger Bands® track price volatility using upper and lower bands around a moving average.
How to use Bollinger Bands with Heikin Ashi candles
- Observe how Heikin Ashi candles interact with Bollinger Bands:
- A strong trend is indicated when candles consistently touch or stay near the upper or lower band.
- Reversals often happen when candles move away from the bands.
- Combine signals:
- For a buy, look for green Heikin Ashi candles emerging from the lower band.
- For a sell, look for red candles forming near or moving away from the upper band.
- Use the middle band (moving average) as a guide for whether you are in an uptrend or downtrend.
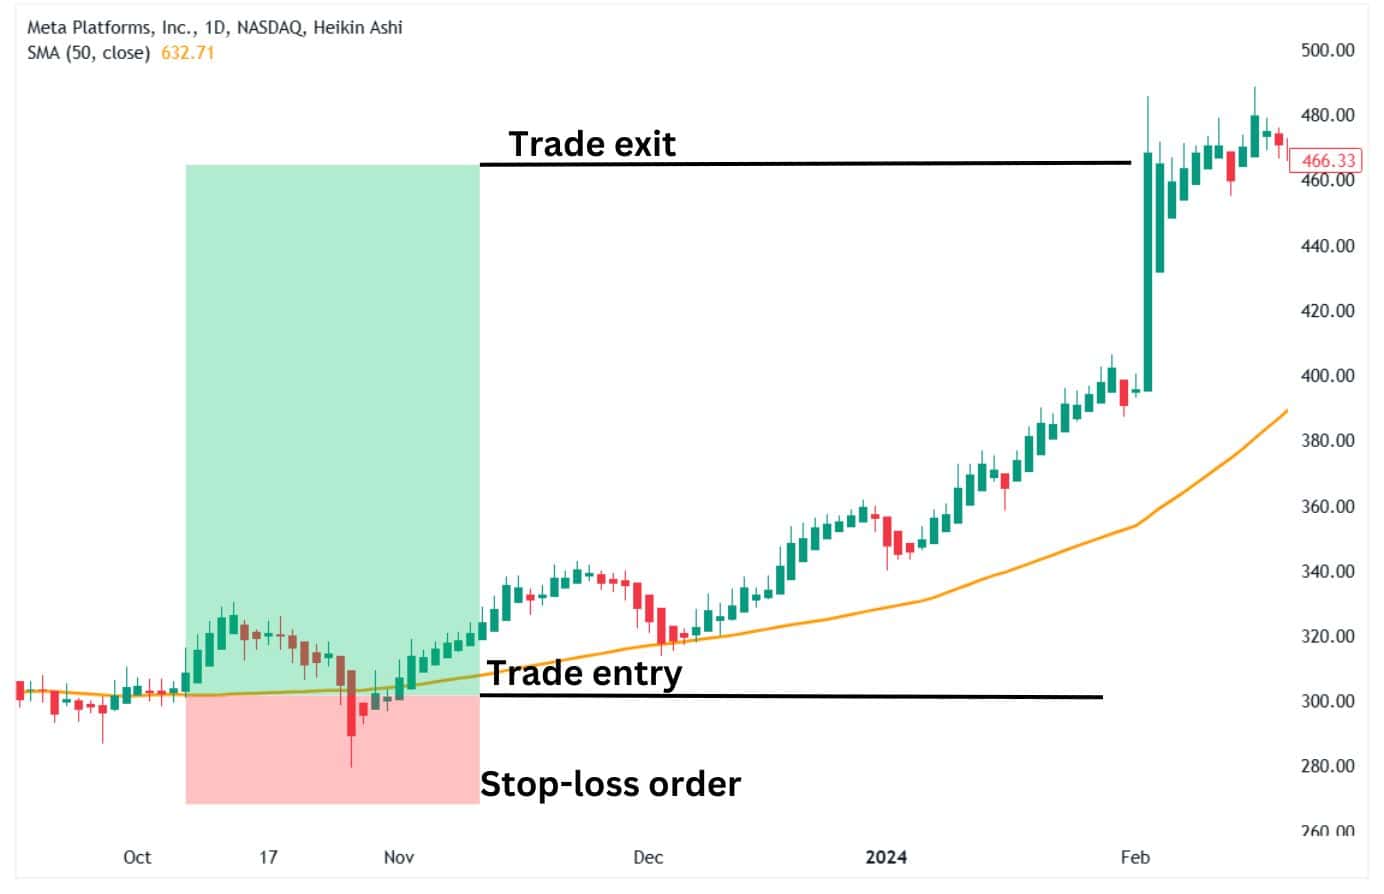
Heikin Ashi with Moving Averages
Moving averages smooth price data to reveal trends over particular timeframes.
How to use moving averages with Heikin Ashi candles
- Add a moving average, such as the 50-period or 200-period, to your Heikin Ashi chart.
- Look for Heikin Ashi candles to cross above or below the moving average:
- Green candles closing above the moving average can signal a buy.
- Red candles breaking below the moving average can signal a sell.
- Combine multiple moving averages: For instance, use a fast-moving average (10-period) and a slow-moving average (50-period). A crossover between these moving averages, along with Heikin Ashi trends, could strengthen signals.
Heikin Ashi Swing Trading
Swing trading with Heikin Ashi is focused on taking advantage of medium-term price moves. Heikin Ashi candles are useful here because they smooth out price fluctuations, making it easier to see trends.
How to swing trade with Heikin Ashi
- Spot the trend: Look for a series of green candles in an uptrend, or red candles in a downtrend.
- Entry point: Enter a swing trade when a new trend begins—typically when the first green or red candle occurs after a series of candles of the opposite color.
- Exit point: Wait for a reversal signal, such as a color change in the candles or smaller body candles with wicks on both ends, signaling indecision.
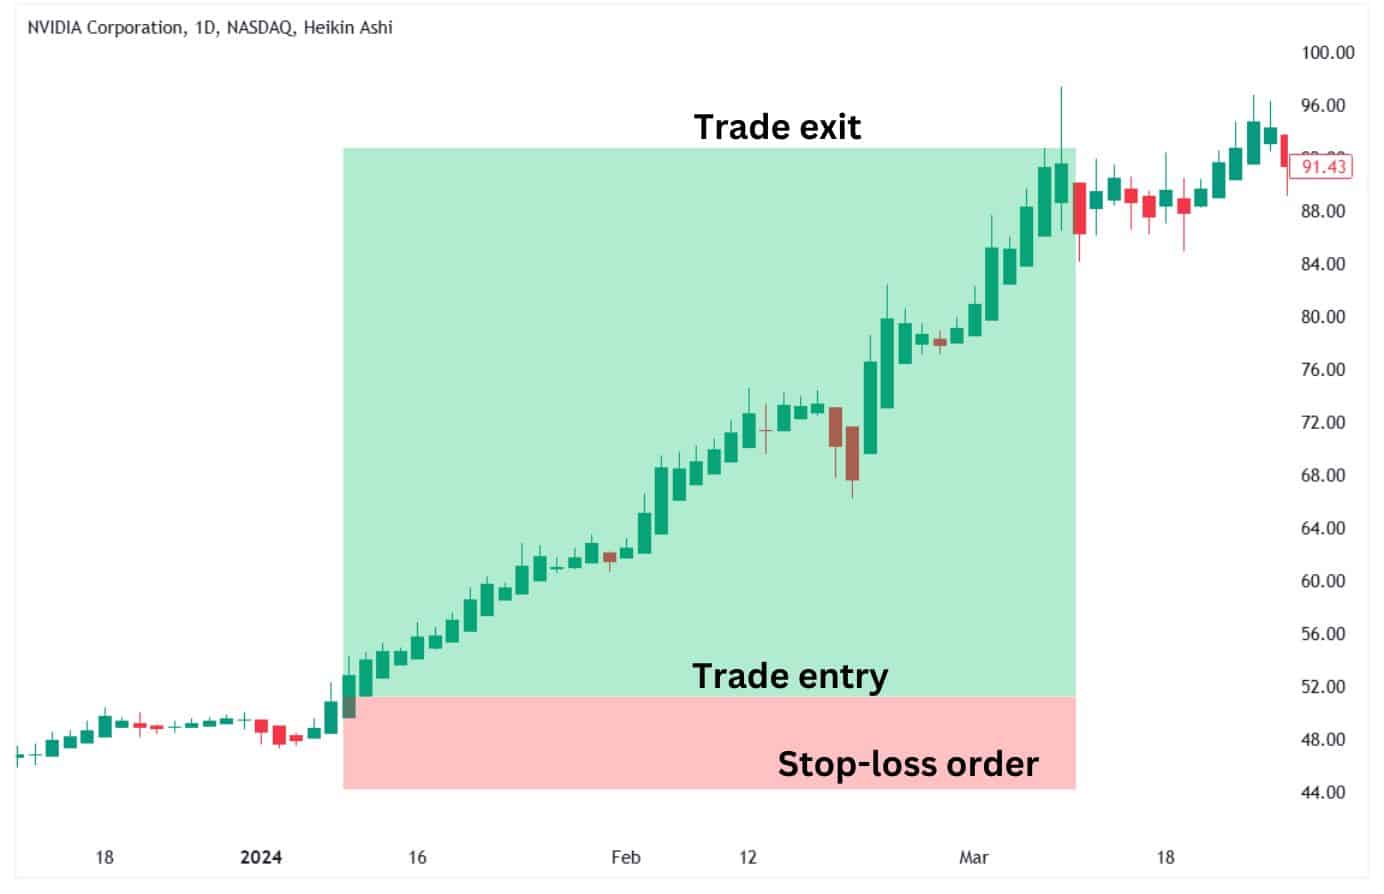
This method works well when paired with support and resistance levels to time entries and exits effectively.
Scalping with Heikin Ashi chart
Scalping involves quick trades to secure small gains. Heikin Ashi simplifies scalping by filtering out the noise in price action, helping scalpers focus on clear trends.
How to scalp with Heikin Ashi candles
- Use short timeframes, such as the 1-minute or 5-minute charts.
- Enter trades when the candles are consistently green or red, with little to no wicks in the direction of the trend.
- Exit quickly when smaller candles or candles with wicks on both ends appear, signaling a possible consolidation or reversal.
Combine Heikin Ashi with fast-moving averages or momentum indicators such as the RSI for better precision in this high-speed approach.
Heiken Ashi Trend Strength
Heikin Ashi helps gauge the strength of a trend by examining candle characteristics:
- Strong trend: Large candles with no wicks on the opposite side, such as green candles without lower wicks in an uptrend.
- Weakening trend: Smaller candles with wicks on both sides, indicating indecision.
- Reversal or consolidation: A series of smaller candles or candles with alternating colors.
By observing these details, traders can decide whether to stay in a trade or prepare for a potential reversal.
Heiken Ashi Reversal Patterns
Reversal patterns in Heikin Ashi charts hint at a possible change in trend direction. Key signals include:
- Doji-like candles: Small candles with long wicks on both sides. These often signal market indecision before a trend reversal.
- Color change after a strong trend: For instance, after several green candles in an uptrend, a red candle signals the start of a downtrend.
- Shrinking candle size: Large candles followed by smaller ones can indicate the trend is losing momentum and may reverse.
Identify Candlesticks with No Shadows
Heikin ashi candlesticks with no shadows indicate the presence of a robust trend in the specific direction. For instance, the presence of multiple red candles with no upper shadows signals the presence of a sustained downtrend. On the other hand, the presence of green candles with no lower shadows indicates the presence of a robust uptrend. Traders should always remember this when reviewing heikin ashi charts.
Advantages of Trading on the Heikin Ashi
Easier Trend Recognition
Heikin Ashi candles provide a smoother view of market direction, making it easier to spot trends at a glance. A series of green candles signals an uptrend, while a sequence of red ones points to a downtrend, offering a more structured visual compared to traditional candlesticks.
Less Market Distraction
This charting method reduces erratic price movements, filtering out the smaller fluctuations that often mislead traders. With the unnecessary noise removed, it’s easier to focus on the broader market movement instead of getting caught up in minor price shifts.
Fewer Misleading Signals
Since Heikin Ashi averages price data, it helps traders avoid impulsive decisions triggered by short-lived market movements. This filtering effect minimizes the chances of reacting to misleading signals, which can improve trade accuracy.
Better Risk Planning
The structured nature of Heikin Ashi charts simplifies decision-making when setting stop-loss and take-profit levels. The smoother price representation helps traders establish more reliable exit and entry points.
Stronger Trend-Following Application
For traders who prefer riding trends, Heikin Ashi is a valuable tool. It makes it easier to stay in winning trades by clearly showing when a trend is still intact rather than exiting too soon due to minor pullbacks.
Disadvantages of Trading on the Heikin Ashi
Lagging Price Reflection
Because Heikin Ashi candles rely on averaged prices, they don’t display real-time price action as precisely as standard candlesticks. This can be a disadvantage for traders who depend on immediate price data for quick decision-making.
Lack of Exact Price Points
Traditional candlestick charts show the precise open, high, low, and close for each period. In contrast, Heikin Ashi modifies these values, which means traders lose direct visibility into actual market prices.
Challenges in Sideways Markets
When the market moves without a clear trend, Heikin Ashi charts can be less reliable. The candles may lack consistency, making it harder to determine whether the price is preparing for a breakout or continuing to range.
Needs Extra Confirmation
While Heikin Ashi helps clarify trends, it shouldn’t be relied upon alone. Traders often combine it with other indicators like volume analysis, moving averages, or support and resistance levels to validate signals.
Less Suitable for Quick Trades
Scalpers and other short-term traders may find Heikin Ashi impractical due to its smoothing effect. The lag in price representation can make it difficult to react swiftly to fast-moving market conditions.
Heikin Ashi vs Renko Charts
Both Heikin Ashi and Renko charts smooth out price movements, but they do so in very different ways.
- Heikin Ashi blends current and past price data to create candles that highlight trends while reducing market noise. The transitions between green and red candles are gradual, making it easier to spot trend direction. However, because prices are averaged, the exact market price isn’t always clear.
- Renko Charts ignore time entirely and focus only on price movement. Instead of traditional candles, Renko uses “bricks” that appear only when price moves by a set amount. This removes minor fluctuations and keeps traders focused on the bigger picture. Since these charts filter out small price swings, they are excellent for identifying strong trends but may not capture short-term price action well.
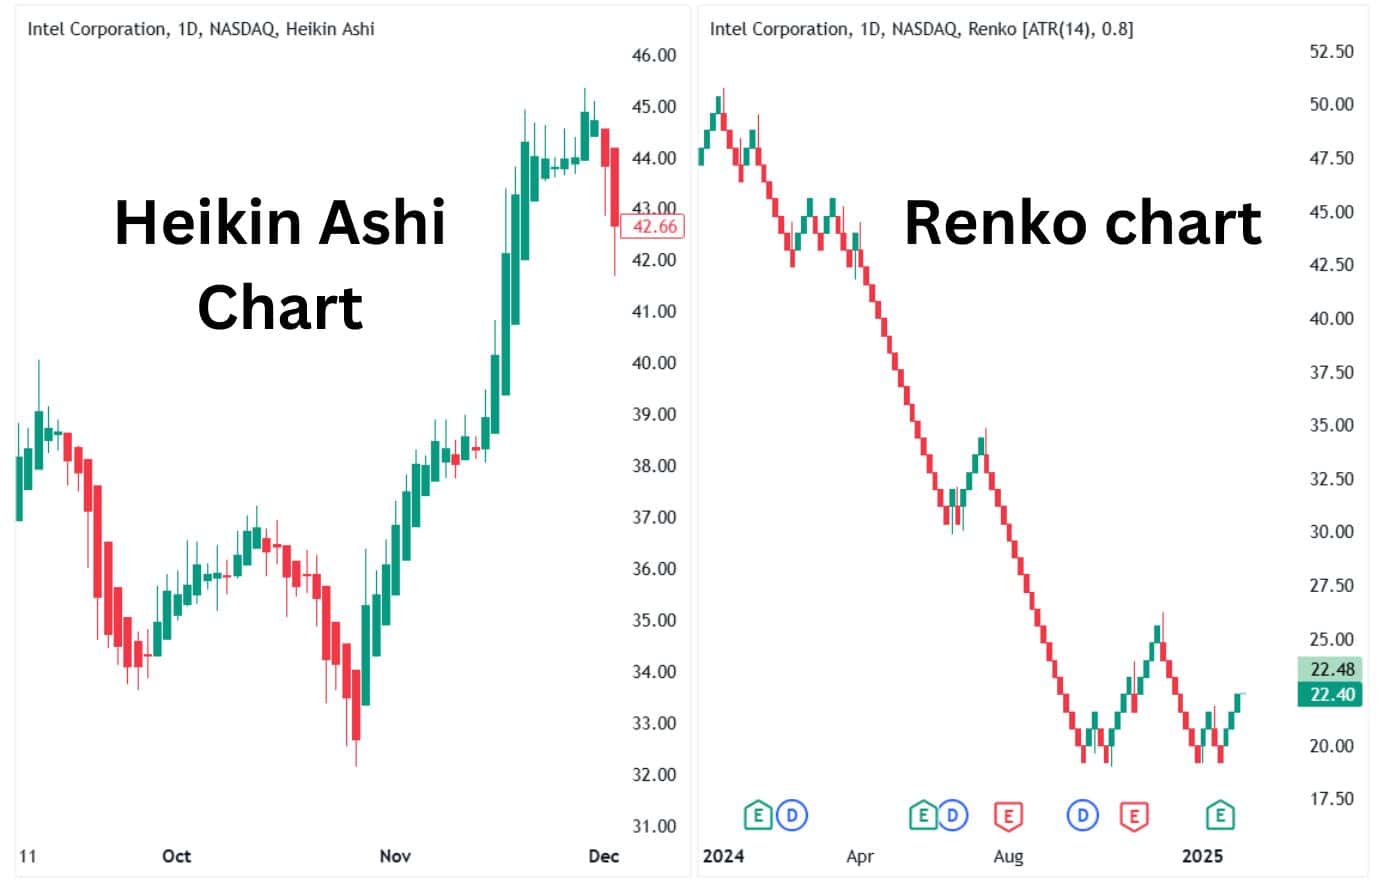
If you want a trend-focused view with some time reference, Heikin Ashi is a good choice. If you prefer a pure price-action approach that eliminates time-based distractions, Renko charts might suit you better.
Heikin-Ashi Charts vs. Candlestick Charts
Standard candlestick charts display the open, high, low, and close for each time period exactly as they happen. Every candle tells the raw story of price movement, making them useful for spotting quick reversals and market sentiment shifts. However, the downside is that they show every fluctuation, including minor price movements that can create a lot of noise.
Heikin Ashi charts smooth out the noise by averaging price data. This makes trends easier to see and helps traders avoid reacting to small, misleading price changes. The trade-off? These charts don’t show real-time prices accurately, so traders need to check a traditional candlestick chart for precise entry and exit points.
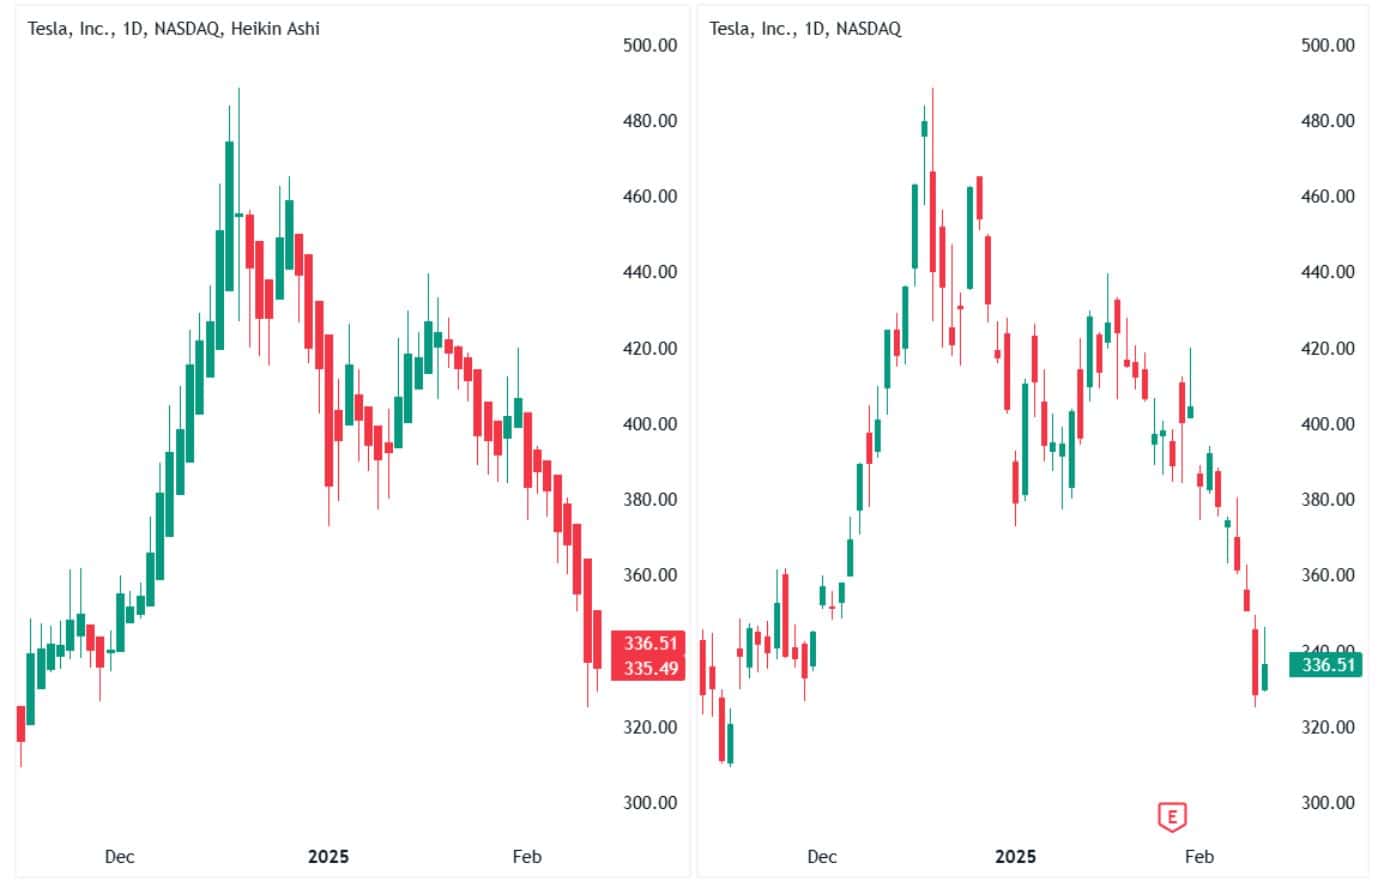
If you need precise, real-time data, stick with candlestick charts. If you’re looking for a smoother, less cluttered view of trends, Heikin Ashi can be a valuable tool.
Heikin Ashi in Forex Trading
Heikin Ashi is a powerful tool in forex trading, helping traders smooth out price fluctuations and identify strong trends with greater clarity. Heikin Ashi’s unique approach helps traders reduce market noise, filter out minor price swings, and focus on the overall trend.
One of the biggest challenges forex traders face is market whipsaws—false signals that can lead to premature entries and exits. Heikin Ashi addresses this problem by providing a more consistent visualization of trends.
- Smoother Trends for Better Decision-Making
- HA candlesticks use an averaged formula that eliminates erratic price movements, making trends easier to follow.
- Instead of reacting to short-term volatility, traders can confidently hold positions during a well-defined uptrend or downtrend.
- Color-Based Trend Recognition
- HA charts often maintain several consecutive green (bullish) or red (bearish) candles, making it easier to determine the prevailing trend.
- A consistent series of green candles signals a strong uptrend, while red candles indicate a downtrend.
- This visual clarity prevents traders from getting caught in choppy, indecisive markets.
- Identifying Trend Reversals with Candlestick Patterns
- Small-bodied HA candles with wicks on both sides can signal trend exhaustion or possible reversal.
- Traders wait for a confirmed color shift before entering a new position, reducing the likelihood of false breakouts.
- Using HA with Other Indicators for Confirmation
- Many forex traders combine Heikin Ashi with moving averages, RSI, or MACD for additional confirmation.
- A strong Heikin Ashi trend supported by a moving average crossover or momentum shift improves trade accuracy.
Heikin Ashi helps forex traders avoid unnecessary stop-outs while reducing emotional trading decisions.
Heikin Ashi in Crypto Trading
Cryptocurrency markets are known for their extreme volatility, often experiencing rapid price swings within short timeframes. This high level of price fluctuation can make it challenging for traders to identify clear trends and avoid false signals. Heikin Ashi (HA) candlesticks provide a solution by smoothing out price action, helping crypto traders filter out market noise and focus on the overall trend direction.
Unlike traditional candlestick charts that depict raw price data, Heikin Ashi modifies price calculations to create a more stable representation of market trends. This is particularly useful in crypto trading, where sharp spikes and wicks often trigger unnecessary panic or misleading signals.
Here’s how crypto traders use Heikin Ashi to improve their trading strategies:
- Smoothing Out Crypto Volatility
- Crypto markets are prone to sudden price spikes and dips due to liquidity changes, news events, or large whale movements.
- HA candlesticks average out price movements, making it easier to spot sustained uptrends and downtrends without being misled by short-term volatility.
- Filtering Out False Signals
- Traditional candlestick charts can produce frequent reversals or choppy price action that leads to poor trade entries and exits.
- HA reduces these whipsaws by maintaining a consistent color pattern—a prolonged sequence of green (bullish) or red (bearish) candles provides clearer trend confirmation.
- Identifying Strong Trends for Swing and Position Trading
- Crypto traders often hold positions for days or weeks, and HA helps them stay in trades longer by reducing emotional reactions to minor pullbacks.
- When HA candles show several consecutive green bars, traders can confidently ride an uptrend. Similarly, a series of red bars confirms a sustained downtrend.
- Using HA for Entry and Exit Signals
- HA candles with small bodies and wicks on both sides indicate market indecision—often appearing before a trend reversal.
- Traders wait for a confirmed color change (e.g., from red to green) before entering a long position or exiting a short trade.
- Combining HA with Technical Indicators
- Many crypto traders use HA alongside moving averages, RSI, Bollinger Bands, and MACD to refine their trading decisions.
- For example, a HA trend breakout above a 50-day moving average strengthens a bullish bias, while a red HA candle under a key support level may confirm a downtrend.
By reducing the impact of short-term price swings, HA allows traders to avoid emotional decision-making and stick to more reliable trade setups.
FAQ
What are the common Heikin Ashi mistakes to avoid?
Treating It Like a Regular Candlestick Chart – Heikin Ashi modifies price data, so it doesn’t show the actual market price at any given moment. Relying on it for precise entry and exit points can lead to miscalculations. Always cross-check with a standard candlestick chart.
Ignoring Lagging Nature – Since it smooths out price movements, Heikin Ashi is slower in reacting to market shifts. Traders who use it for fast decision-making, like scalping, might enter or exit too late.
Overlooking Consolidation Phases – In sideways markets, Heikin Ashi candles can become small and choppy, making it harder to tell where price is headed. This can lead to false trend signals.
Using It Alone – Heikin Ashi helps identify trends, but it’s not enough by itself. Pairing it with indicators like volume, moving averages, or support and resistance levels improves accuracy.
What is the best time frame to use for the Heikin Ashi pattern?
The ideal time frame depends on your trading style:
- Swing traders prefer 4-hour and daily charts since Heikin Ashi works best for spotting larger trends.
- Day traders might use 30-minute or 1-hour charts for a balanced view of trend direction without too much lag.
- Scalpers generally avoid Heikin Ashi since it reacts too slowly for rapid trades.
For most traders, higher time frames (4H, daily, weekly) provide clearer trends and reduce the impact of short-term market noise.
Who first identified the Heikin Ashi pattern?
The Heikin Ashi technique was developed by Munehisa Homma, a legendary Japanese rice trader from the 1700s. He is also credited with inventing candlestick charting itself. Homma’s insights into market psychology and price movement laid the foundation for many modern trading strategies.
How reliable is the Heikin Ashi pattern?
Heikin Ashi is very effective for trend-following but has limitations:
- Reliable for spotting trends – The smoothing effect makes it easier to see when a trend is gaining strength or losing momentum.
- Less reliable for reversals – Because of its lagging nature, Heikin Ashi doesn’t provide early reversal signals. Traders often use additional indicators like RSI or MACD to confirm changes in direction.
- Not great for fast markets – If you need immediate price data, Heikin Ashi may not be the best choice, as it hides short-term price action.
In summary, it’s a strong tool for staying in trends but should always be used with other analysis techniques to confirm signals.
How accurate is Heikin Ashi?
Heikin Ashi is highly accurate for identifying trends but less precise when it comes to exact price levels. Since it smooths out price movements, it reduces false signals and helps traders stay in trades longer. However, because it averages price data, it lags behind actual market prices. It’s best used alongside traditional candlestick charts and other indicators for confirmation.
Is Heikin Ashi a lagging indicator?
Yes, Heikin Ashi is a lagging indicator because each candle is calculated using past price data. This means it does not update in real-time like standard candlesticks. While this delay makes it better at filtering out noise and spotting trends, it also means traders might react slower to sudden price reversals.
What is the best strategy for Heikin Ashi?
A strong trend-following strategy works best with Heikin Ashi. Here’s a simple approach:
- Identify the Trend – Look for a series of green candles (uptrend) or red candles (downtrend).
- Use Moving Averages – Combine with the 50- or 200-period moving average to confirm trend direction.
- Enter on Trend Continuation – Enter a trade when a red-to-green shift happens in an uptrend (or vice versa in a downtrend).
- Exit on a Color Change – If green candles turn red, it might be time to take profits or exit.
- Set Stop-Loss Wisely – Place stop-loss orders below the recent swing low (in an uptrend) or above the swing high (in a downtrend).
This approach helps traders ride trends while minimizing false signals.
What is the Heikin-Ashi 5 rule?
The Heikin Ashi 5-rule method is a simple way to interpret trends:
- Long Green Candles = Strong Uptrend – No shadows (wicks) on the bottom signal strong buying momentum.
- Long Red Candles = Strong Downtrend – No upper shadows mean sellers are in control.
- Small Candles with Wicks = Trend Weakening – If candles shrink and show wicks on both ends, the trend is losing strength.
- Color Changes = Potential Reversal – A green-to-red or red-to-green switch hints that momentum is shifting.
- Wait for Confirmation – A single color change isn’t enough. Always wait for two or more consecutive candles before making a move.
This rule helps traders stay in winning trades longer and avoid jumping in too early on weak reversals.