


- Elliott Wave
- February 14, 2025
- 2 min read
SP500 Elliott Wave: Climbing the Final Waves
Executive Summary
- Bullish Trend: SPX is progressing within a bullish impulse, currently in wave (iii) of ((iii)).
- Key Support: 5,773.31 level is the invalidation point for the bullish structure.
- Targets: Fibonacci extensions suggest target levels near 6,318 (100%) and 6,570 (1.618%).
Current Elliott Wave Analysis
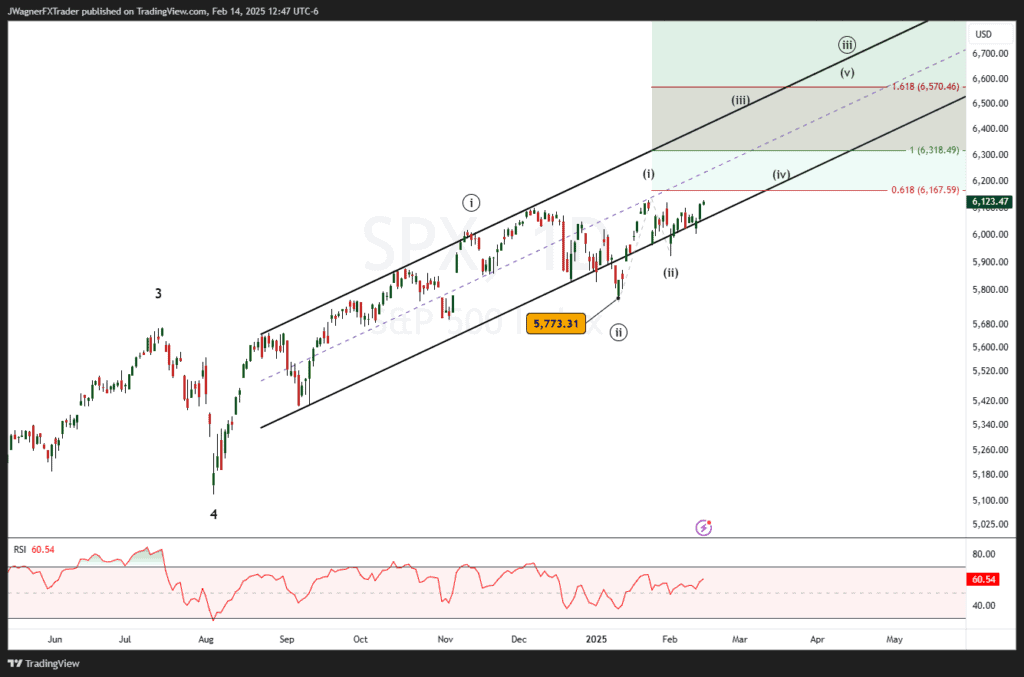
The SPX chart follows an Elliott Wave impulse pattern, with the current wave as (iii) of ((iii)). At a higher degree, this move is within the final Primary wave 5 of a larger Cycle wave structure.
The bullish trend remains intact as price stays inside a rising parallel channel. The recent correction to 5,773.31 marked the wave (ii) low, followed by a strong rally. Within this impulsive structure:
- Wave (i) has completed, setting up the base for the ongoing wave (iii).
- Wave (iii) typically extends, targeting at least the 1.618 Fibonacci extension around 6,570.
- A minor correction (wave iv) could develop near 6,318, where price meets the 100% Fibonacci extension.
The RSI indicator sits at 60.54, reflecting sustained bullish momentum without being overbought.
Bottom Line
SPX remains in a strong bullish uptrend, with 6,318 as the next likely target, followed by 6,570 for a full 1.618 extension. A break below 5,773.31 would negate this count, shifting the outlook.
You might also be interested in:
DISCLAIMER: For educational purposes only. Trading comes with substantial risk, leading to possible loss of your capital.
Traders are advised to do their own due diligence before investing.


