Bearish
Bullish
- January 10, 2025
- 28 min read
Quasimodo Pattern Ultimate Trading Guide
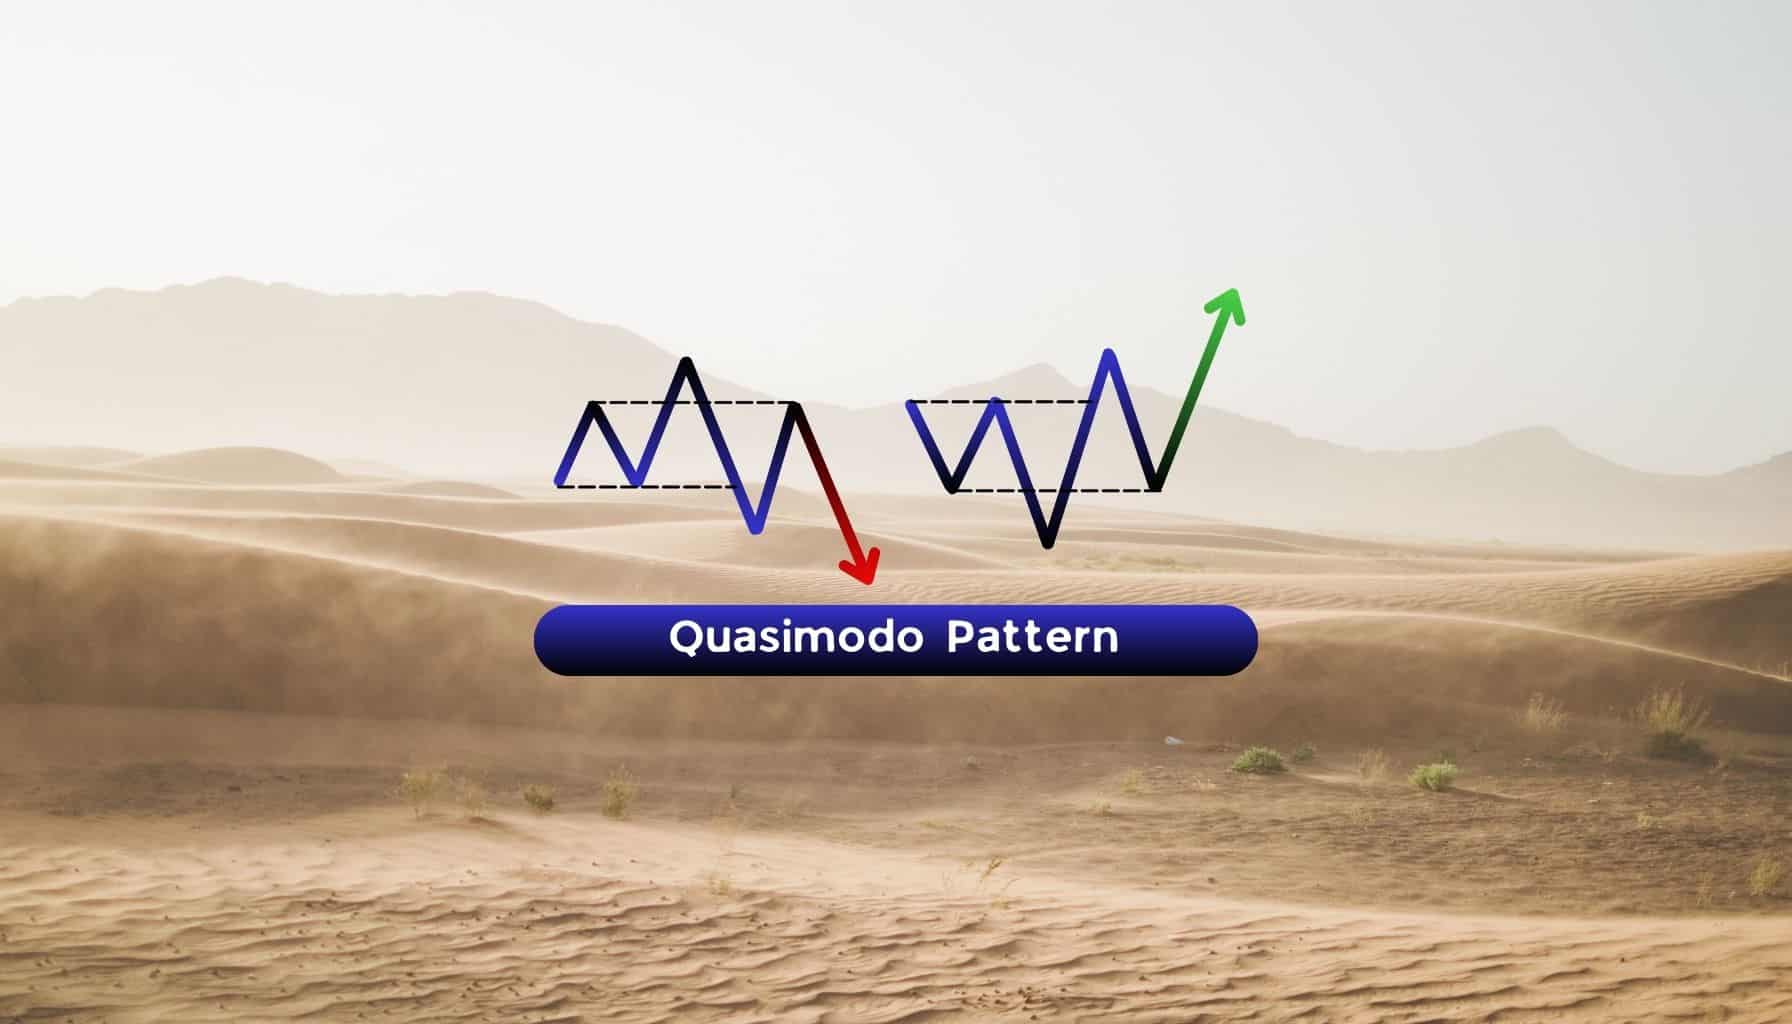
What is the Quasimodo Pattern?
The Quasimodo Pattern is a powerful bullish and bearish trading setup known for providing early entry points in newly forming trends following a recent market reversal. While the Quasimodo chart pattern is primarily seen as a reversal pattern, it functions as a continuation of a new trend that has just begun after breaking a previous high or low. This pattern is applicable across various financial markets, including forex, stocks, commodities, and indices, making it versatile for diverse trading environments. This pattern is particularly useful in forex trading, aiding traders in identifying important market movements and potential reversals.
By identifying the Quasimodo pattern, traders gain the opportunity to enter and exit positions at strategic points, capitalising on an advantageous risk-to-reward ratio. Its structure often allows for precise stop-loss placement, which, combined with the potential to capture substantial trend movements, makes it a valuable pattern for improving both risk management and profitability.
The Quasimodo chart pattern is particularly useful for traders who aim to spot early signs of trend direction changes, leveraging the pattern’s ability to confirm the momentum of the new trend, ultimately enhancing their overall trading strategy.
Bullish Quasimodo Pattern
The Bullish Quasimodo Pattern is typically found at the low points of a downtrend, where the market is signalling exhaustion in selling pressure and preparing for a potential upward reversal, indicating a bullish trend. It is often seen at major support zones or areas of high market interest, such as significant Fibonacci retracement levels or the base of previous consolidations. This context is crucial because it reflects areas where buyers are likely to regain control.
The primary purpose of the bullish Quasimodo is to confirm a price reversal and the emergence of a new upward trend after a downtrend. By identifying this pattern, traders can position themselves for the early stages of bullish momentum, capturing moves as the price begins to break above previous resistance levels. The structure of the pattern not only confirms a shift in sentiment but also provides a reliable framework for placing entries near support zones and targets at higher resistance levels. This allows traders to ride the new trend with reduced risk and enhanced reward potential.
Bearish Quasimodo Pattern
The Bearish Quasimodo Pattern is most commonly observed at the high points of an uptrend, where buying pressure starts to diminish, and the market hints at a downward reversal, indicating the beginning of a bearish trend. This pattern typically appears at key resistance levels, such as prior swing highs, psychological price levels, or Fibonacci retracements or extensions, indicating zones where sellers are likely to take control. Its presence in these areas highlights exhaustion in the bullish momentum.
The purpose of the bearish Quasimodo is to confirm the start of a new downward trend after the uptrend loses steam. It enables traders to capitalise on the transition by entering positions early in the reversal, allowing them to benefit as the price begins to form lower lows and lower highs. This pattern is especially effective in managing risk, as its structure provides precise entry points at resistance levels and logical take-profit targets at lower support zones. By entering near resistance, traders align themselves with the new bearish momentum, aiming to capture the price move as it breaks key support levels and continues downward.
How Does Quasimodo Pattern Trading Work?
The Quasimodo pattern trading strategy is a technical approach that helps traders identify the early stages of a new trend right after a reversal. By carefully observing specific price movements, this pattern allows traders to pinpoint precise entry and exit points, maximising the reward-to-risk potential. Here’s a breakdown of how it works:
1. Core Concept of the Quasimodo Pattern
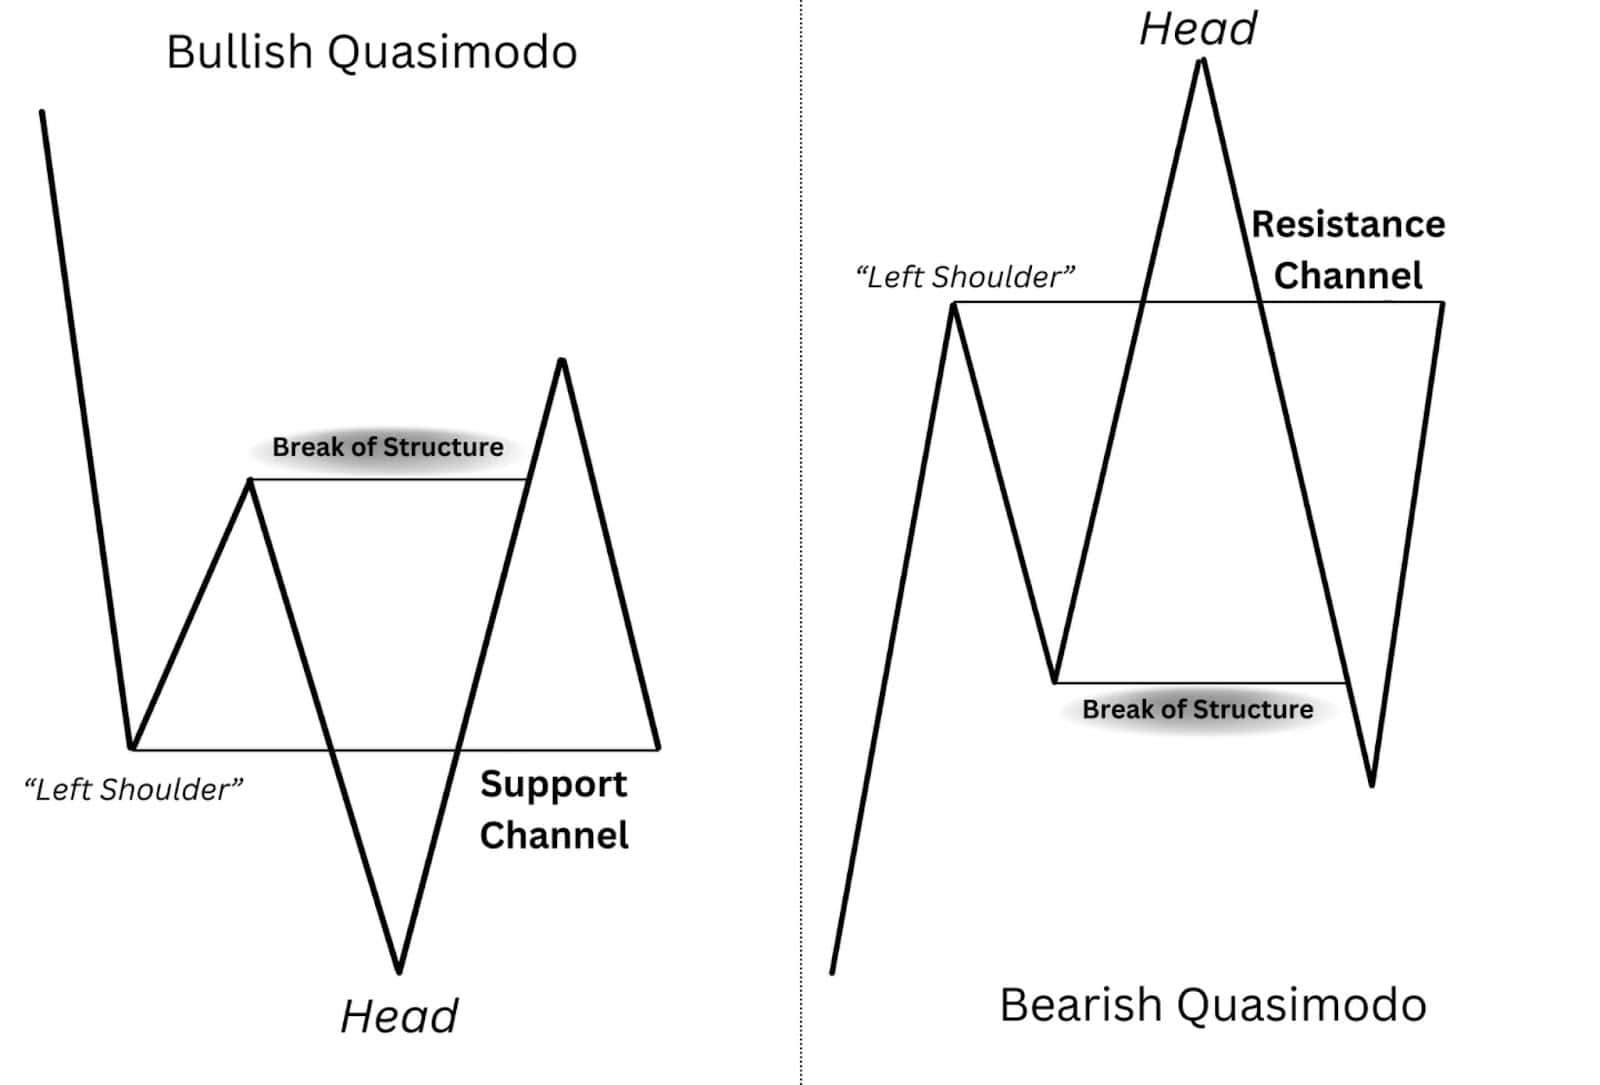
The Quasimodo price patterns focus on finding shifts in market sentiment by analysing the formation of key highs and lows..
It is based on the sequence of:
- A “left shoulder” level,
- A “head” (a new high or low),
- Followed by a break of structure and then a retracement to the “left shoulder aka support or resistance channel” or a key Fibonacci level (often the 78.6%).
2. Waiting for Confirmation
Rather than entering immediately after the initial reversal, traders look for confirmation in the form of a retracement after the break of structure.
The ideal entry point is when the price retraces to the “left shoulder” area or a significant Fibonacci retracement level, such as 78.6%.
This approach allows for tighter stop-loss placement and improved reward-to-risk ratios by aligning entries with the emerging trend instead of the fading one.
3. Profit Targets and Risk Management
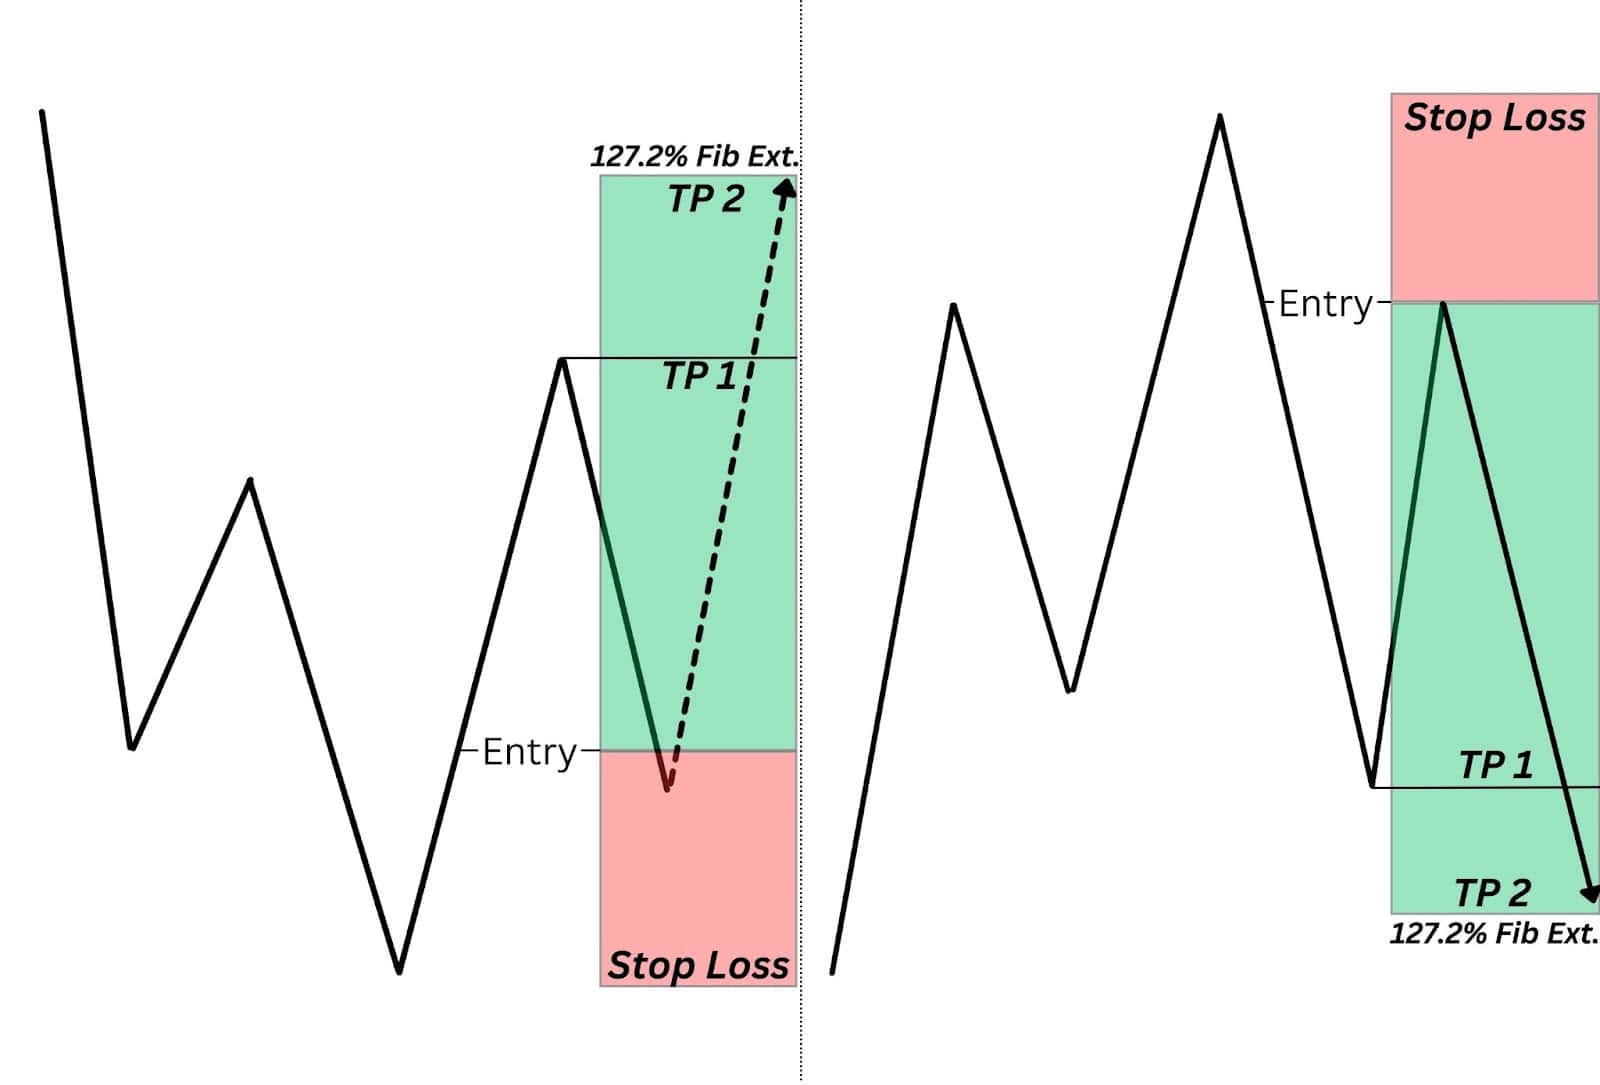
- First Profit Target: The first target is typically set at the most recent high or low created in the impulsive move.
- Final Profit Target: For maximising gains, traders often use the Fibonacci retracement tool, like the 127.2% level, to set a final target.
- Protecting Profits: Moving the stop loss to breakeven once the first target is hit minimises risk while allowing for further potential gains if the trend continues.
4. Versatility Across Markets and Timeframes
The Quasimodo trading setup can be applied across various financial markets—forex, stocks, commodities, and indices—making it highly versatile.
It works well in different timeframes, which suits both swing and day traders aiming to capitalise on early trend reversals.
How to Identify the Quasimodo Pattern?
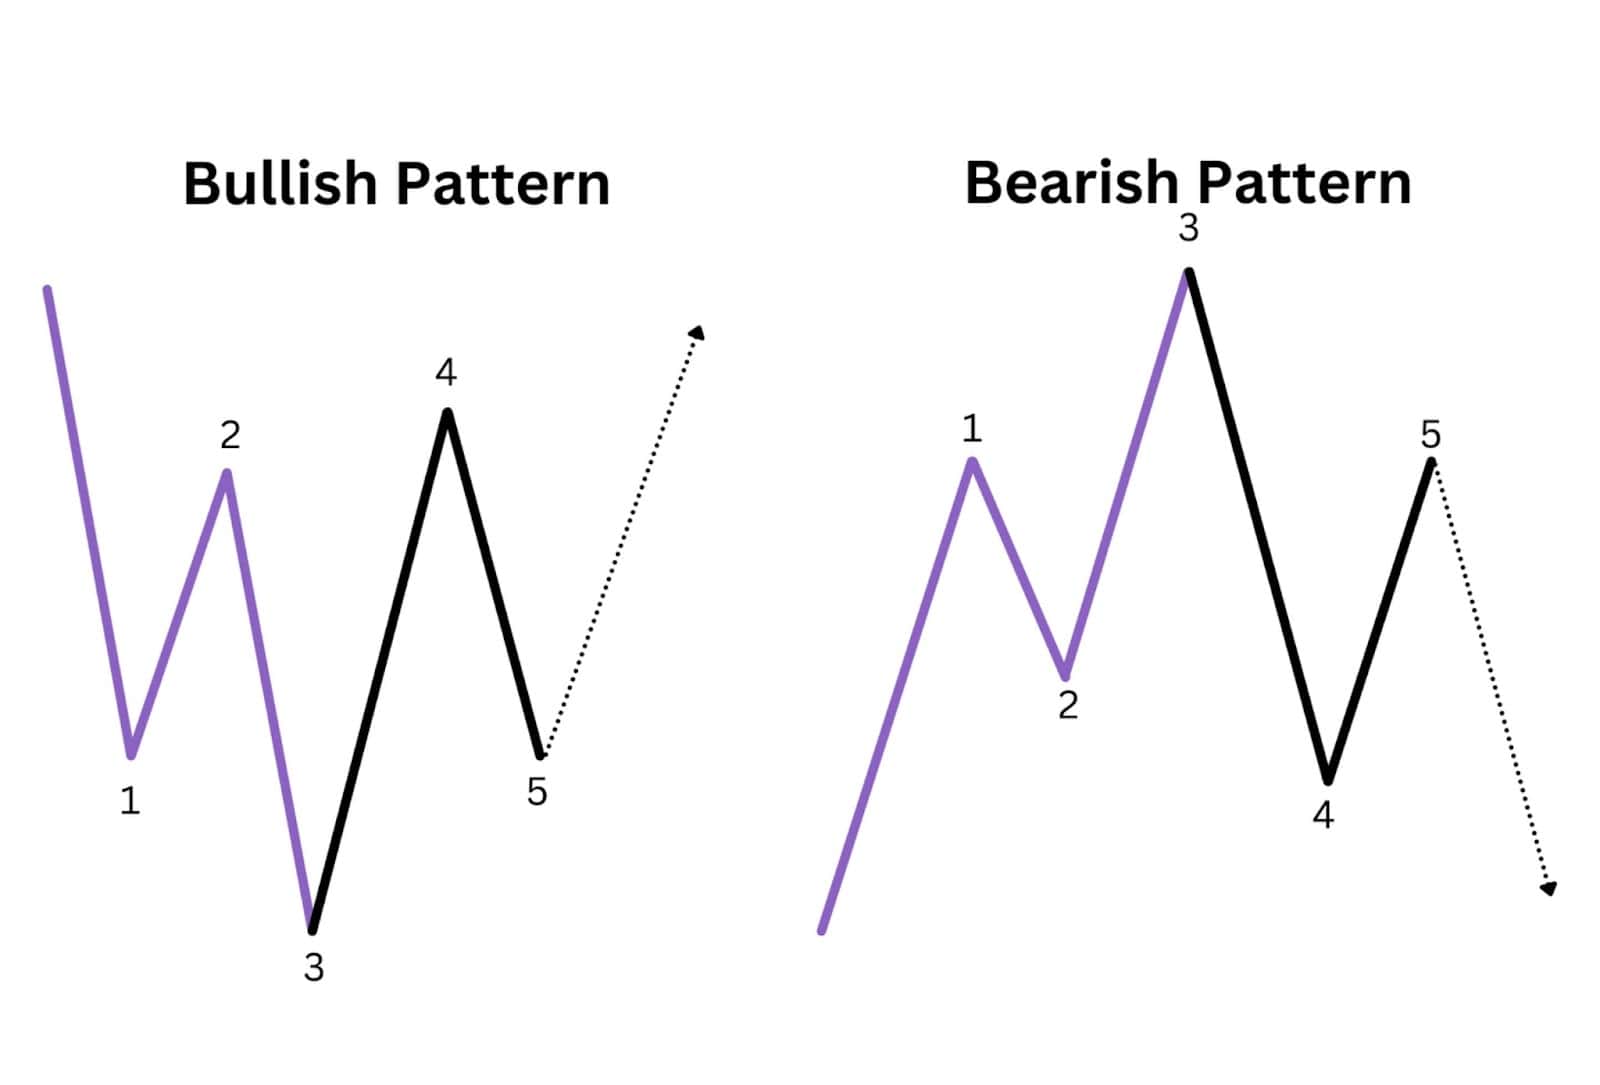
Whether bullish or bearish, the Quasimodo Pattern’s structure is a reliable reversal training pattern that offers precise signals of both a potential reversal and the early continuation of a newly established trend. Its versatility and consistency across market conditions make it a dependable tool for identifying and capitalising on key shifts in momentum. Let’s break down its components in detail:
Point 1 – First Low/High
- For a bullish setup, this is the starting point and typically forms a significant low during a downtrend, indicating the first sign of a potential trend change but not yet confirmation.
- For a bearish setup, this represents the initial high during an uptrend, similarly marking the first potential indication of a reversal.
Point 2 – Correction
- After reaching the initial low or high, the price retraces to create a corrective pullback.
- In a bullish pattern, this move forms a temporary high and sets the neckline level (horizontal resistance).
- In a bearish pattern, this creates a temporary low, forming the neckline (horizontal support).
Point 3 – Lower Low/Higher High for the Head
- The price reverses again, moving lower (bullish setup) or higher (bearish setup), creating a new extreme compared to Point 1. This forms the “head” of the pattern.
- For a bullish setup, this is a lower low, establishing the area where future support may form.
- For a bearish setup, this is a higher high, marking potential resistance in the future.
Point 4 – Reversal and Break of Structure
- The price makes an impulsive move in the opposite direction, breaking the neckline established at Point 2.
- For bullish setups, the move creates a higher high above Point 2, confirming bullish momentum.
- For bearish setups, the price creates a lower low below Point 2, confirming bearish momentum.
- This impulsive move is a critical confirmation that the pattern is developing, as it demonstrates the start of a new trend.
Point 5 – Final Retracement
- The price retraces once more but does not exceed the previous extreme (Point 3).
- In a bullish setup, it pulls back towards Point 1 (the “left shoulder”), forming a potential support zone without falling below Point 3.
- In a bearish setup, it retraces to Point 1, which acts as resistance, without breaking above Point 3.
- This retracement serves as the ideal entry point for the pattern.
Key Characteristics of the Quasimodo Pattern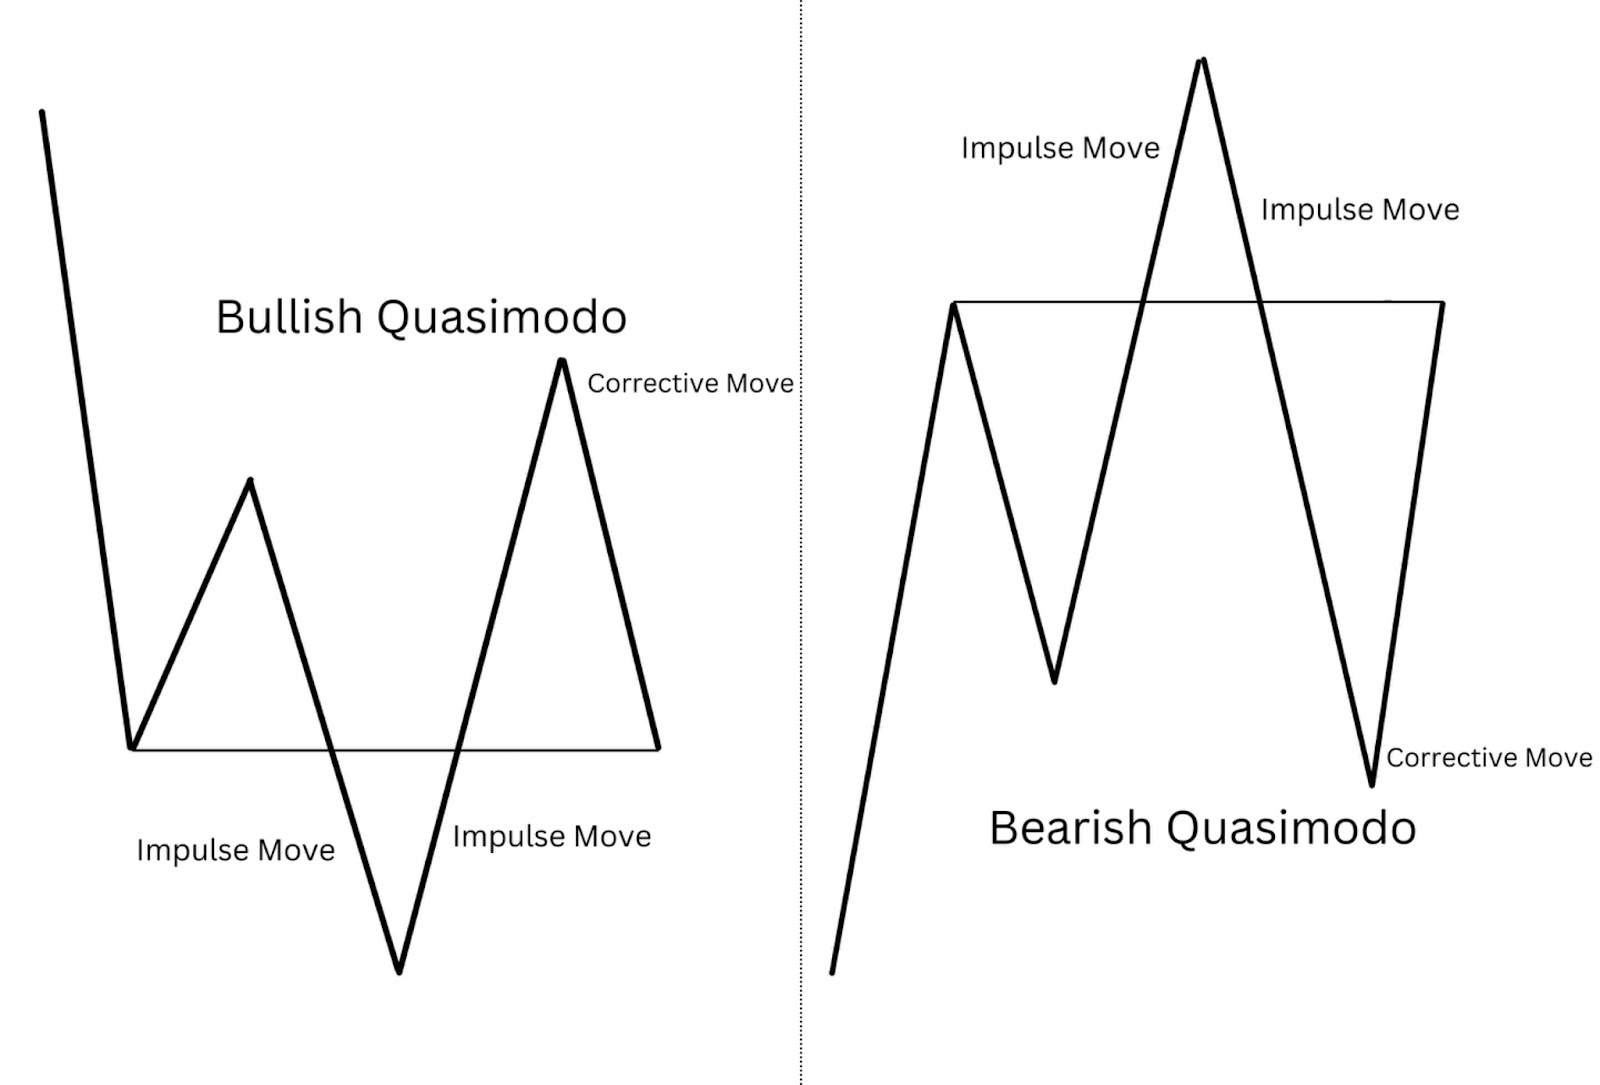
To reliably identify the Quasimodo pattern, keep an eye out for these specific characteristics, which reflect shifts in price structure influenced by supply and demand forces:
- Impulsive Final High or Low in the Previous Trend: The final high (in a bearish setup) or low (in a bullish setup) within the initial trend should be an impulsive move. This indicates that it was part of a strong trend movement, making the reversal more meaningful when the pattern forms. A weak final push does not confirm a strong trend, so a sharp final impulse is essential.
- Impulsive Move That Breaks the Neckline: The move that breaks the previous high or low, known as the break of structure, should also be impulsive. This strong move confirms the new trend direction and differentiates it from minor retracements within the existing trend. It signifies that a new momentum is emerging in the opposite direction.
- Corrective Structure to the Left Shoulder: After the break of structure, the price should ideally make a corrective move back to the left shoulder area. This corrective retracement should be choppy and show signs of consolidation, indicating that the market is retesting the support or resistance level rather than continuing in the original trend direction.
What Does a Quasimodo Tell You
The Quasimodo pattern, including the bearish QM pattern, reveals powerful insights into market psychology, especially during a critical shift in trend momentum. This pattern reflects the collective psychology of traders as they navigate a market that’s reaching an exhaustion point in its current trend and preparing for a potential reversal. Let’s dive into the psychology behind each phase of the Quasimodo pattern to understand why it signals a change in sentiment and momentum.
1. Exhaustion of the Current Trend
The initial phase of the Quasimodo pattern begins with a strong move in the direction of the prevailing trend. This move (the “head” in the pattern) represents the final push of market participants who believe in the continuation of the current trend. At this stage, there’s often a rush of traders attempting to ride the trend to its final peak or trough, driven by momentum or fear of missing out (FOMO).
However, this final move shows signs of exhaustion. By the time the market reaches this high or low, it’s often overextended, and signs of waning buying or selling pressure become visible. Traders and investors who entered the trend earlier may start to take profits, creating resistance (in a bearish setup) or support (in a bullish setup) at this peak. This exhaustion creates the conditions for a shift in sentiment, as more market participants become hesitant to push the trend further.
2. Reversal and New Momentum
After reaching this final peak or trough, the market experiences a sharp and impulsive move in the opposite direction. This impulsive move is a critical part of the Quasimodo pattern, as it signals that fresh sentiment is entering the market, challenging the direction of the previous trend. The strong, swift movement reflects a wave of new participants (or existing ones shifting stance) who see opportunity in the reversal.
This shift in momentum is fuelled by both technical and psychological factors. For some traders, this impulsive move is an indicator that the previous trend has overstretched, and they’re keen to position themselves for a potential reversal. For others, it’s a sign that a new trend may be forming, and they’re eager to establish early positions in this fresh direction. Together, these forces drive the price past the previous support or resistance level, breaking the “neckline” and signalling a break in the structure of the previous trend.
3. Consolidation and Testing of the New Trend
Following the impulsive move that breaks the structure, the market typically enters a corrective phase, retracing back towards the initial support or resistance area (the “left shoulder”). This pullback represents a critical moment of indecision, where the market tests whether the new trend direction has the strength to hold.
During this retracement, the market psychology reflects a balance between two groups of traders:
- Those who still believe in the original trend: Some traders see this pullback as an opportunity to re-enter positions in the direction of the old trend, thinking that the impulsive move was just a temporary correction. These traders help create the resistance or support at the “left shoulder” level.
- New entrants supporting the trend change: Meanwhile, others who are aligned with the new trend see this pullback as a buying (or selling) opportunity to position themselves with lower risk. They treat the pullback as a natural pause before the new trend resumes, and they anticipate that the old support or resistance level (the left shoulder) will now act as a solid entry point.
This corrective move is often choppy and lacks the strength of the impulsive reversal, signalling that the old trend lacks the momentum to reclaim its previous dominance. As the price tests the left shoulder area, the market shows whether it has the conviction to continue in the new trend direction, ultimately allowing the Quasimodo pattern to fulfil its role as an early signal for trend continuation.
4. Resumption of the New Trend
If the market successfully holds at the left shoulder level, this area becomes a launch point for the new trend. This phase reflects the collective decision of market participants to align with the new direction, effectively shifting the overall sentiment. Traders who were initially sceptical may now start to see the strength of the reversal and join the new trend, adding further momentum. Meanwhile, traders who were positioned with the old trend may capitulate, closing their positions and reinforcing the reversal.
This transition signifies that the market is ready for a fresh trend move, with the left shoulder area acting as a foundation for continued price movement in the new direction. The Quasimodo pattern thus symbolises the complete shift in sentiment—from trend exhaustion to the impulsive break, to the test of the new direction, and finally, the commitment to a fresh trend.
Summary of Market Psychology in the Quasimodo Pattern
The Quasimodo pattern encapsulates a profound psychological shift among market participants:
- From conviction in the old trend, as traders push the trend to its final high or low,
- To hesitation and reversal, as a new group of traders initiates a strong move in the opposite direction,
- To testing of the new direction, where the market consolidates and decides on the validity of the trend change,
- To full alignment with the new trend, as the left shoulder area holds and the market confirms its commitment to move forward.
This sequence of trends shape how the Quasimodo pattern aligns with market structure breaks for a reversal confirmation. First, you see a break of the head to new trend extremes. Then, the market structure breaks when price exceeds the neckline. These events makes the Quasimodo pattern a reliable tool for identifying early reversals and the start of a fresh trend, providing traders with insights into the underlying shifts in market psychology.
Quasimodo Pattern Examples
EUR/USD (1-Hour Chart)
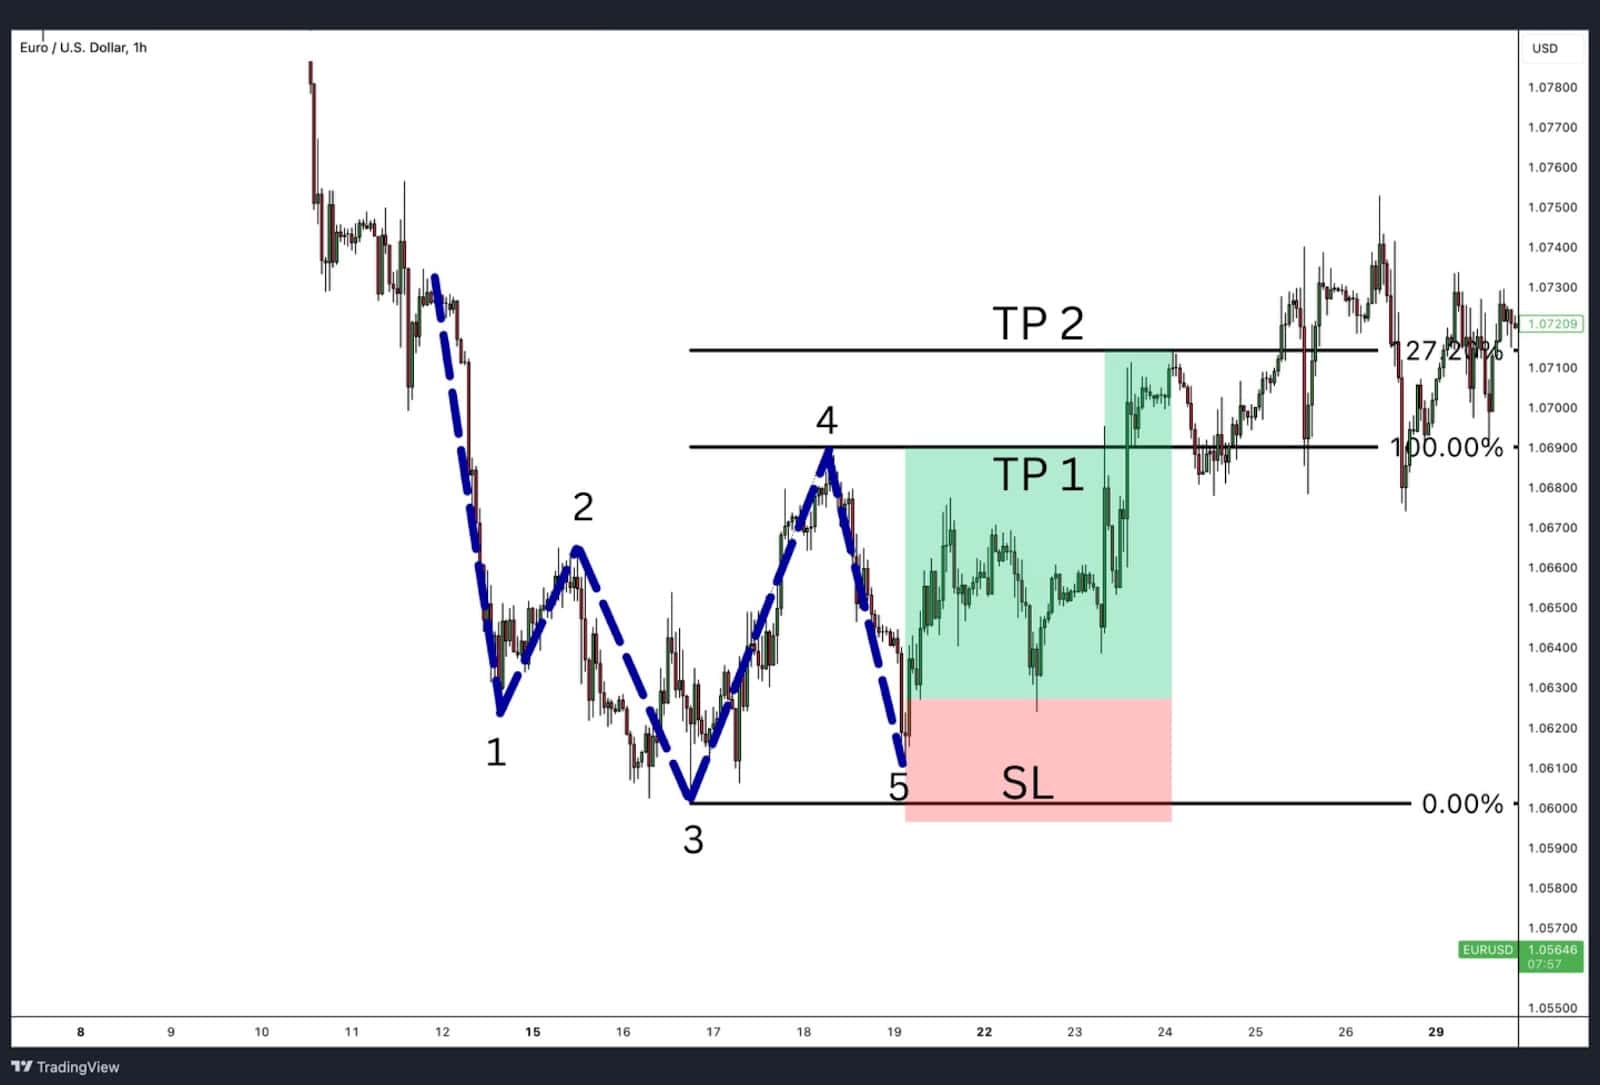
- Initial Downtrend and Formation of Point 1 & 2:
- The price creates a significant low at Point 1, marking the end of a strong downtrend. A corrective pullback follows, forming Point 2, which establishes the neckline.
- Formation of the Head (Point 3):
- The price makes another impulsive move downward, breaking below Point 1 and forming a new lower low at Point 3. This is the “head” of the pattern, signalling potential trend exhaustion.
- Impulse Move and Break of Structure (Point 4):
- The price surges upwards in a strong, impulsive move, breaking above the neckline at Point 2 and forming a higher high at Point 4, confirming the bullish momentum.
- Retracement to Left Shoulder (Point 5):
- The price retraces in a slow, corrective move back to Point 5, aligning with the left shoulder and acting as a support zone, offering an ideal entry point for a long trade.
- Take Profit Levels:
- First Target (TP1): The high at Point 4 (100% retracement level).
- Final Target (TP2): The 127.2% Fibonacci extension of the impulse from Point 3 to Point 4, aligning with the next resistance level.
GBP/USD (1-Hour Chart)
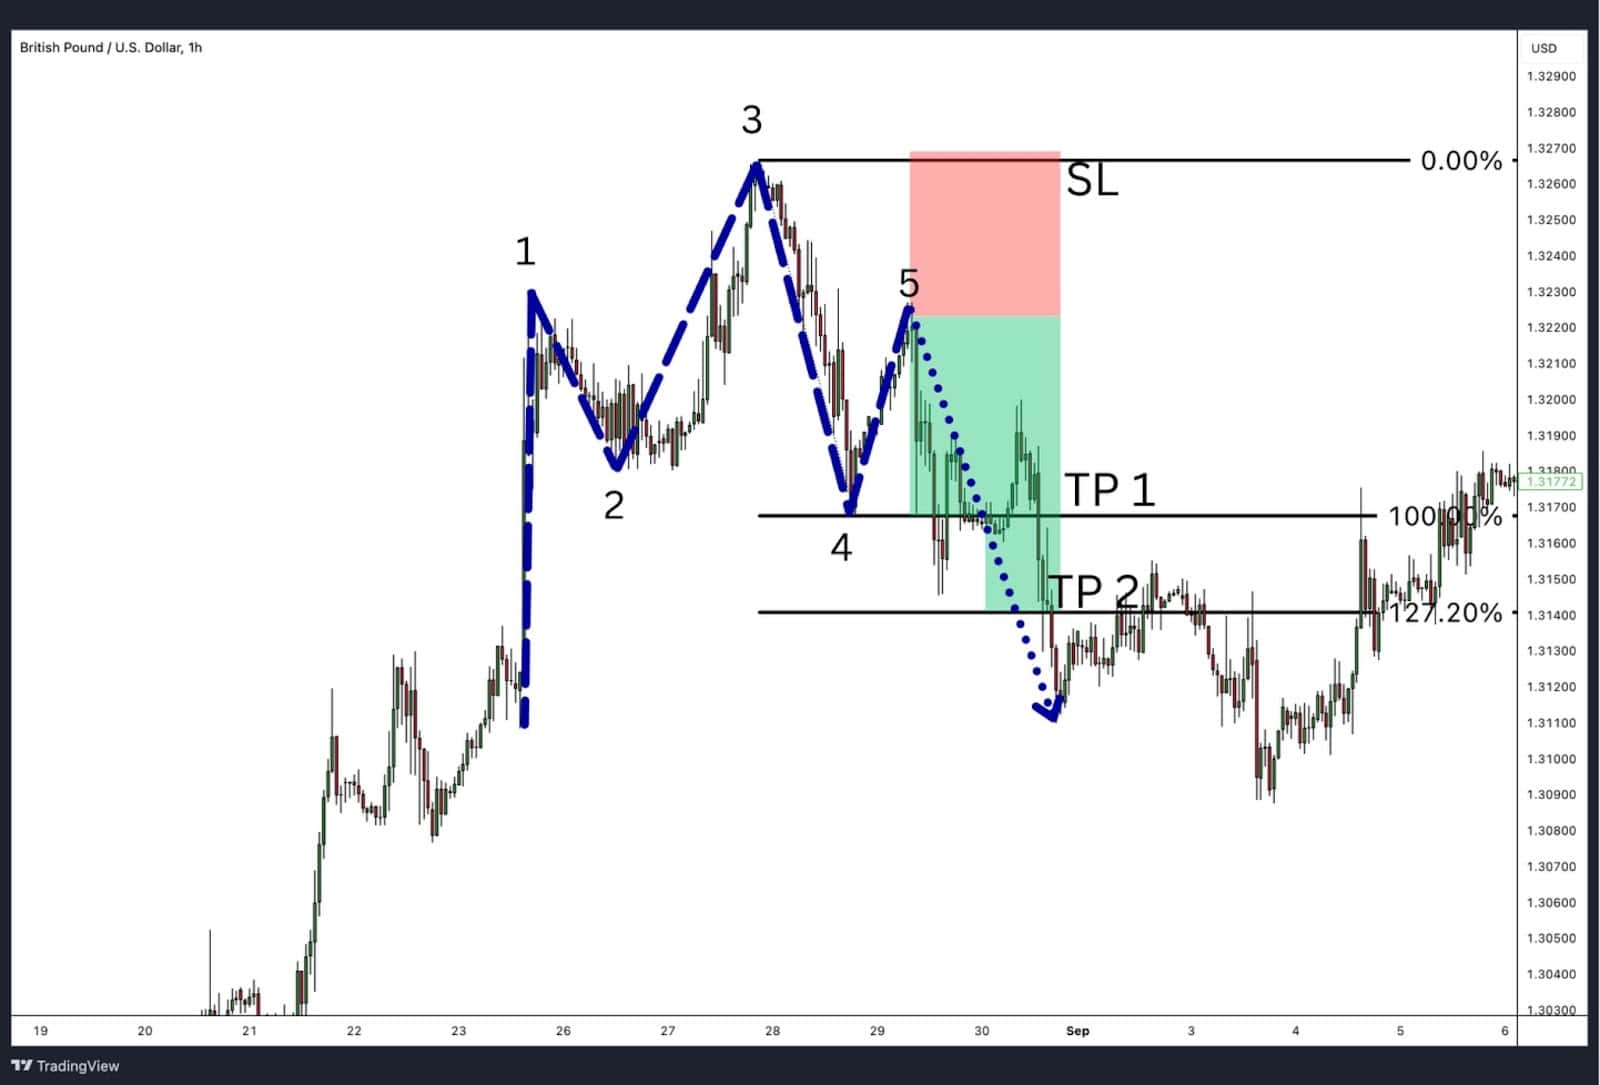
- Initial Uptrend and Formation of Point 1 & 2:
- The price creates a significant high at Point 1, marking the peak of a strong uptrend. It then pulls back to form Point 2, creating the neckline.
- Formation of the Head (Point 3):
- The price pushes higher, breaking above Point 1 to form a new higher high at Point 3, completing the “head” of the pattern.
- Impulse Move and Break of Structure (Point 4):
- A sharp and impulsive move downwards breaks below the neckline at Point 2, forming a lower low at Point 4, confirming the bearish momentum.
- Retracement to Left Shoulder (Point 5):
- The price retraces upward in a corrective manner to Point 5, aligning with the left shoulder and acting as a resistance zone, offering an ideal entry point for a short trade.
- Take Profit Levels:
- First Target (TP1): The low at Point 4 (100% retracement level).
- Final Target (TP2): An extension of the point 3 to point 4 leg using the 127.2% Fibonacci retracement tool, aligning with the next support level.
USD/JPY (1-Hour Chart)
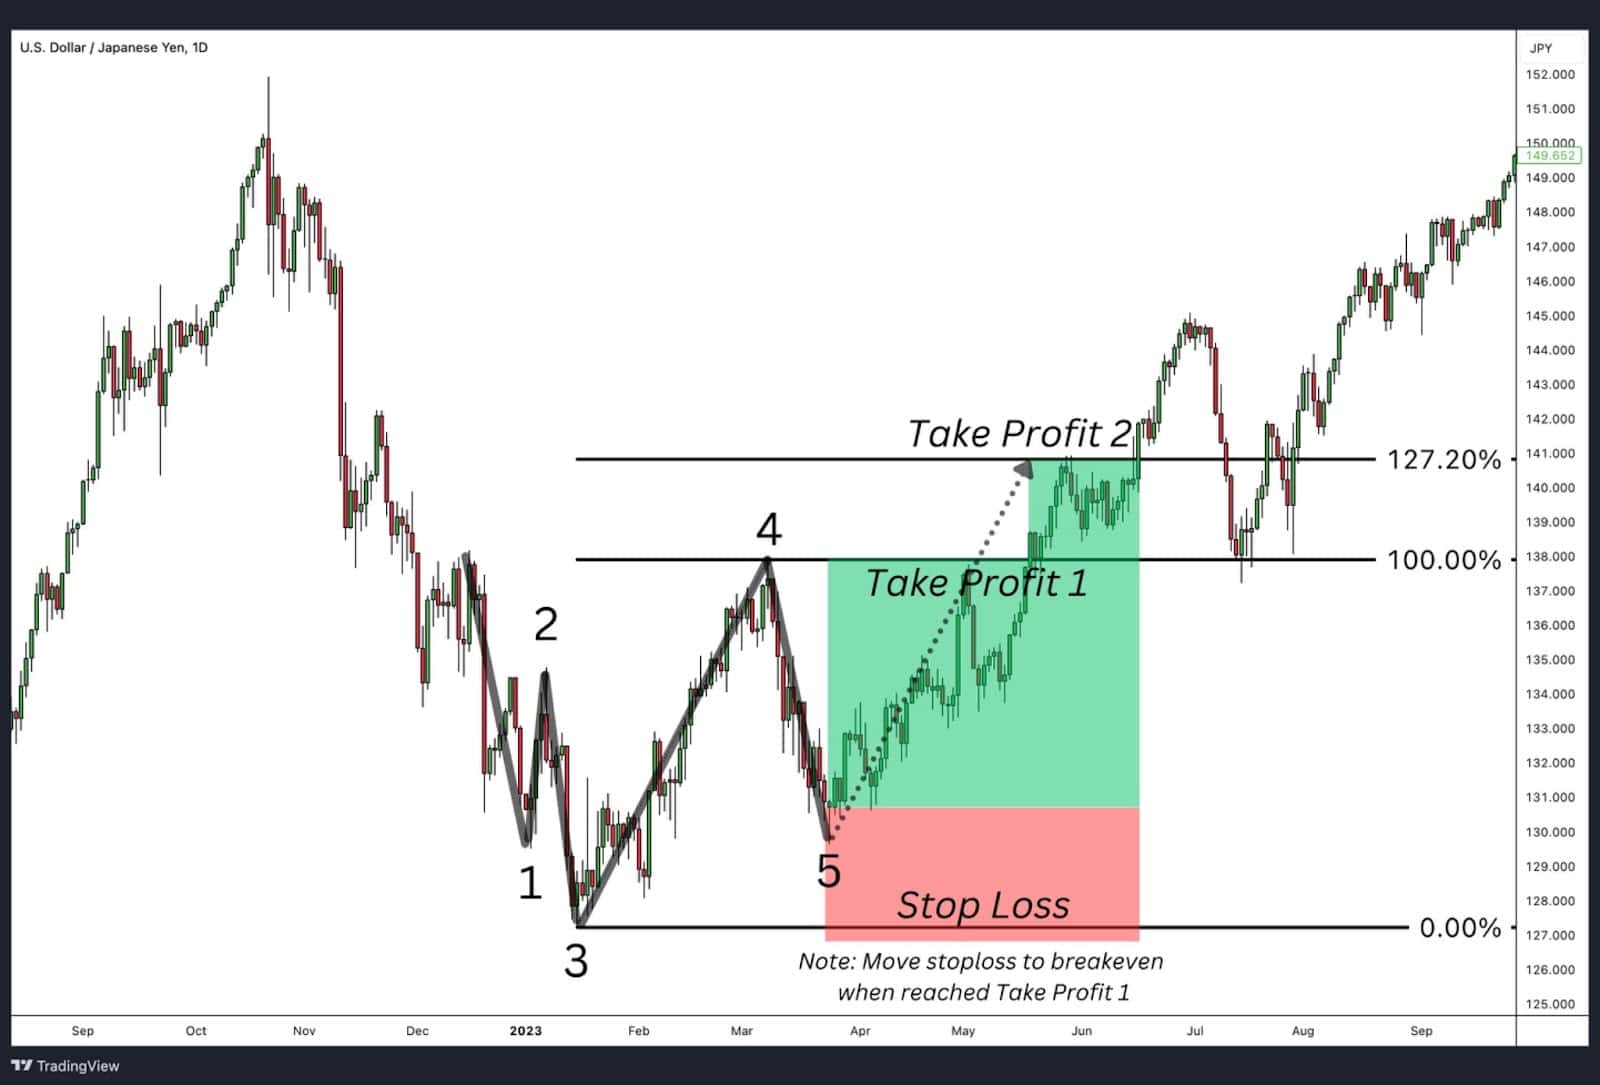
- Initial Downtrend and Formation of Point 1 & 2:
- Price forms a significant low at Point 1 during a downtrend, followed by a corrective pullback to Point 2, establishing the neckline.
- Formation of the Head (Point 3):
- A sharp move breaks below Point 1, creating a new lower low (Point 3), signalling the “head.”
- Impulse Move and Break of Structure (Point 4):
- The price surges impulsively upwards, breaking above the neckline formed at Point 2, creating Point 4(higher high), confirming bullish momentum.
- Retracement to Left Shoulder (Point 5):
- Price retraces in a choppy manner back to Point 5, aligning with the left shoulder and providing an entry.
Take Profit Levels:
- First Target: The high at Point 4 (100% retracement level).
- Final Target: The 127.2% Fibonacci extension of the impulse from Point 3 to Point 4, aligning with the next resistance level.
PYPL (1-Hour Chart)
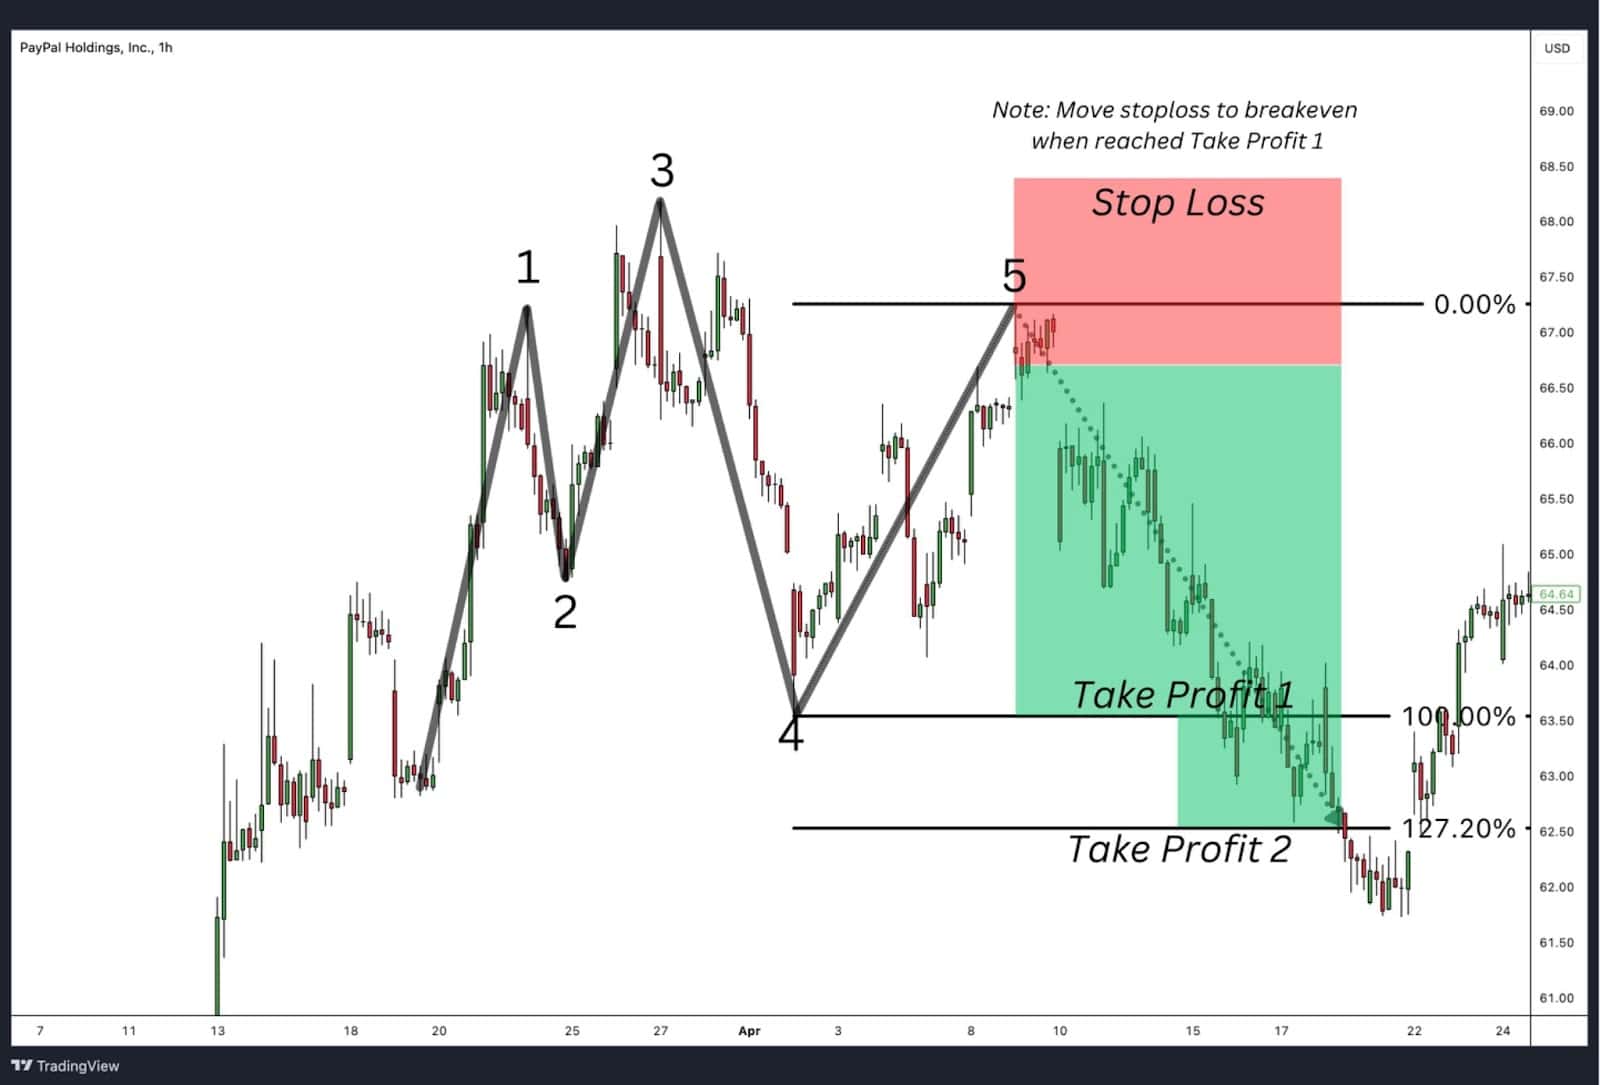
- Initial Uptrend and Formation of Point 1 & 2:
- Price peaks at Point 1 during an uptrend, retraces to form Point 2 (neckline), and resumes upwards.
- Formation of the Head (Point 3):
- Price creates a higher high at Point 3, forming the “head” of the pattern, followed by a sharp reversal.
- Impulse Move and Break of Structure (Point 4):
- The price drops impulsively, breaking below the neckline at Point 2, forming a lower low (Point 4).
- Retracement to Left Shoulder (Point 5):
- Price retraces upward to Point 5 (left shoulder area), now acting as resistance and providing a short entry opportunity.
Take Profit Levels:
- First Target: The low at Point 4 (100% retracement level).
- Final Target: The 127.2% level using the Fibonacci retracement tool of the impulse from Point 3 to Point 4, aligning with the next support level.
Quasimodo Pattern Trading Strategies
The Quasimodo pattern, a variant of shoulders patterns, is highly versatile and can be combined with technical indicators to enhance its reliability. Here’s how to structure trades using the Quasimodo pattern, including entry, stop loss, take profit levels, and risk-reward considerations.
Entry Point
- Enter the trade when the price retraces into the left shoulder level (previous support or resistance zone) after breaking the neckline.
- For added precision, wait for confirmation with a candlestick pattern (e.g., pin bar or engulfing candle) or indicator alignment.
Stop Loss Placement
- Place the stop loss just beyond the head of the pattern to account for false breakouts or minor volatility.
Take Profit Levels
- First Target: Set at the most recent high or low (neckline breakpoint).
- Final Target: Use the Fibonacci extension tool (e.g., 127.2% level) from the impulsive move to project the final profit target.
Risk-Reward Ratio
- Aim for a risk-reward ratio of at least 1:2, with a preference for tighter stop losses and wider profit targets.
Additional Technical Indicators
Combining the Quasimodo pattern with technical indicators can increase its reliability. Below are some effective tools to use:
Quasimodo Pattern with MACD
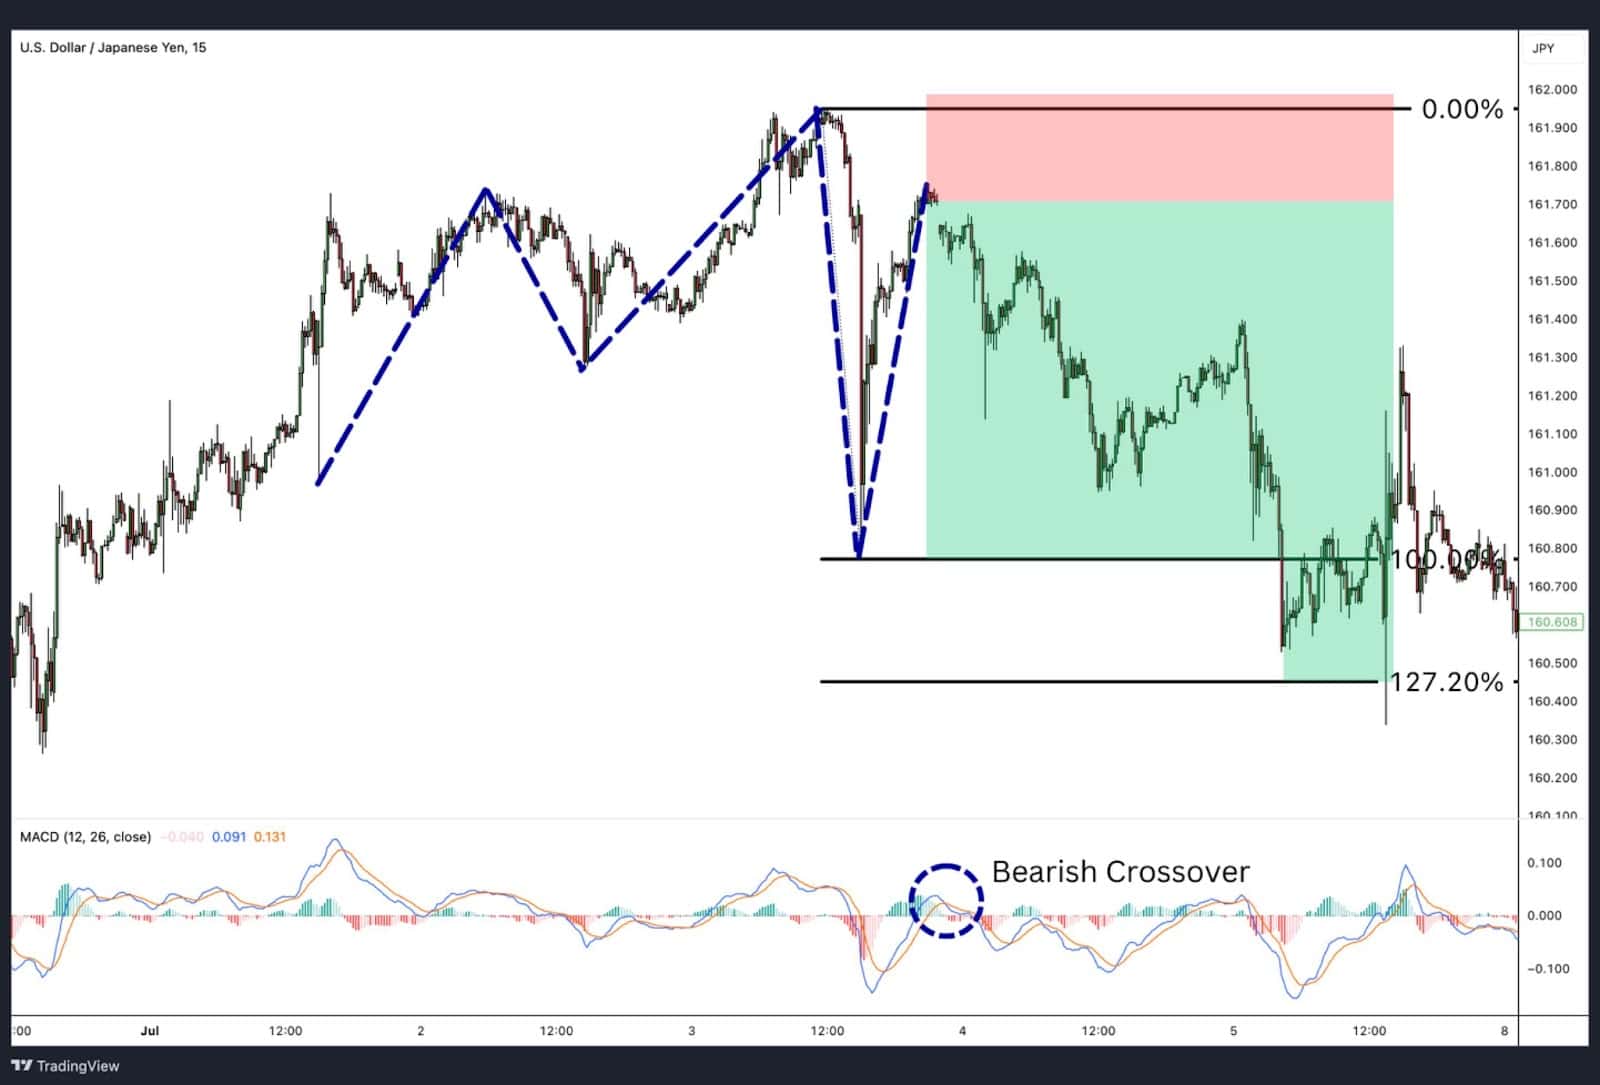
- How It Helps: Use MACD to confirm the shift in momentum. Look for a bullish crossover (for bullish patterns) or bearish crossover (for bearish patterns) when the price retraces to the left shoulder area.
- Entry Tip: Align the MACD signal with price action at the left shoulder level for greater confidence in the trade.
Quasimodo Pattern with SMA
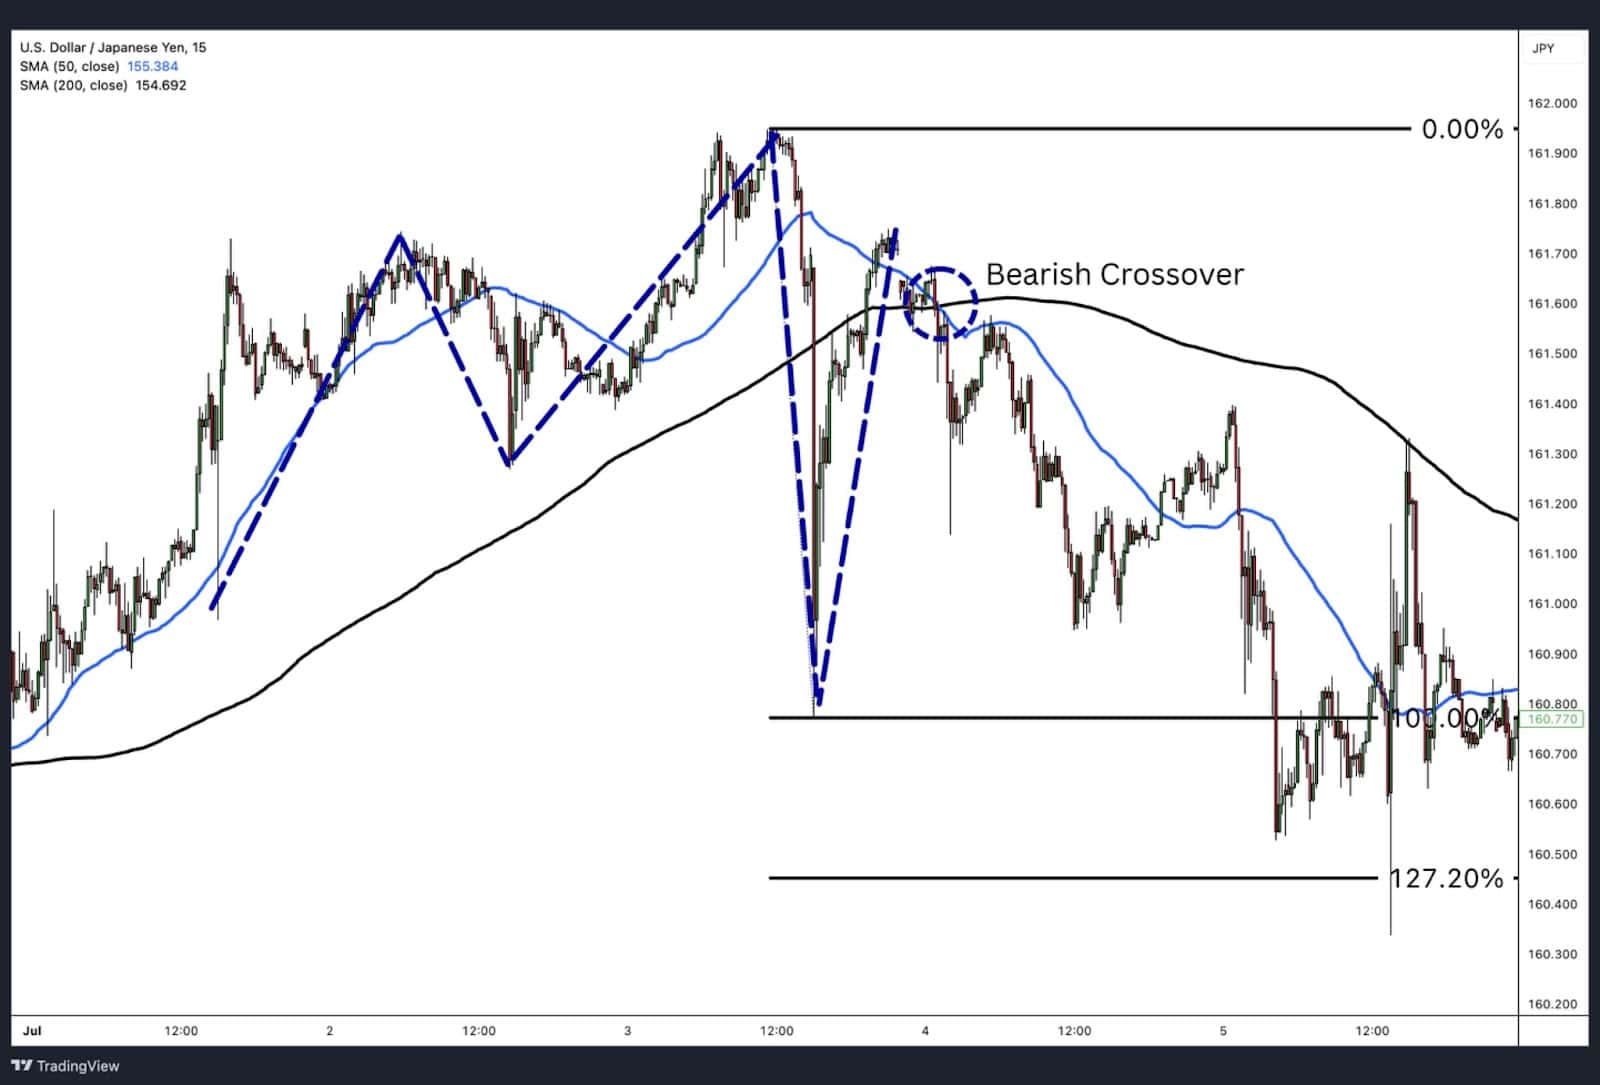
- How It Helps: Simple Moving Averages (SMA) can help identify the broader trend. Use the 50-SMA and 200-SMA to confirm whether the pattern aligns with the larger market direction.
- Entry Tip: Enter trades when the price pulls back to the left shoulder and remains above the SMA (bullish) or below it (bearish).
Quasimodo Pattern with Bollinger Bands
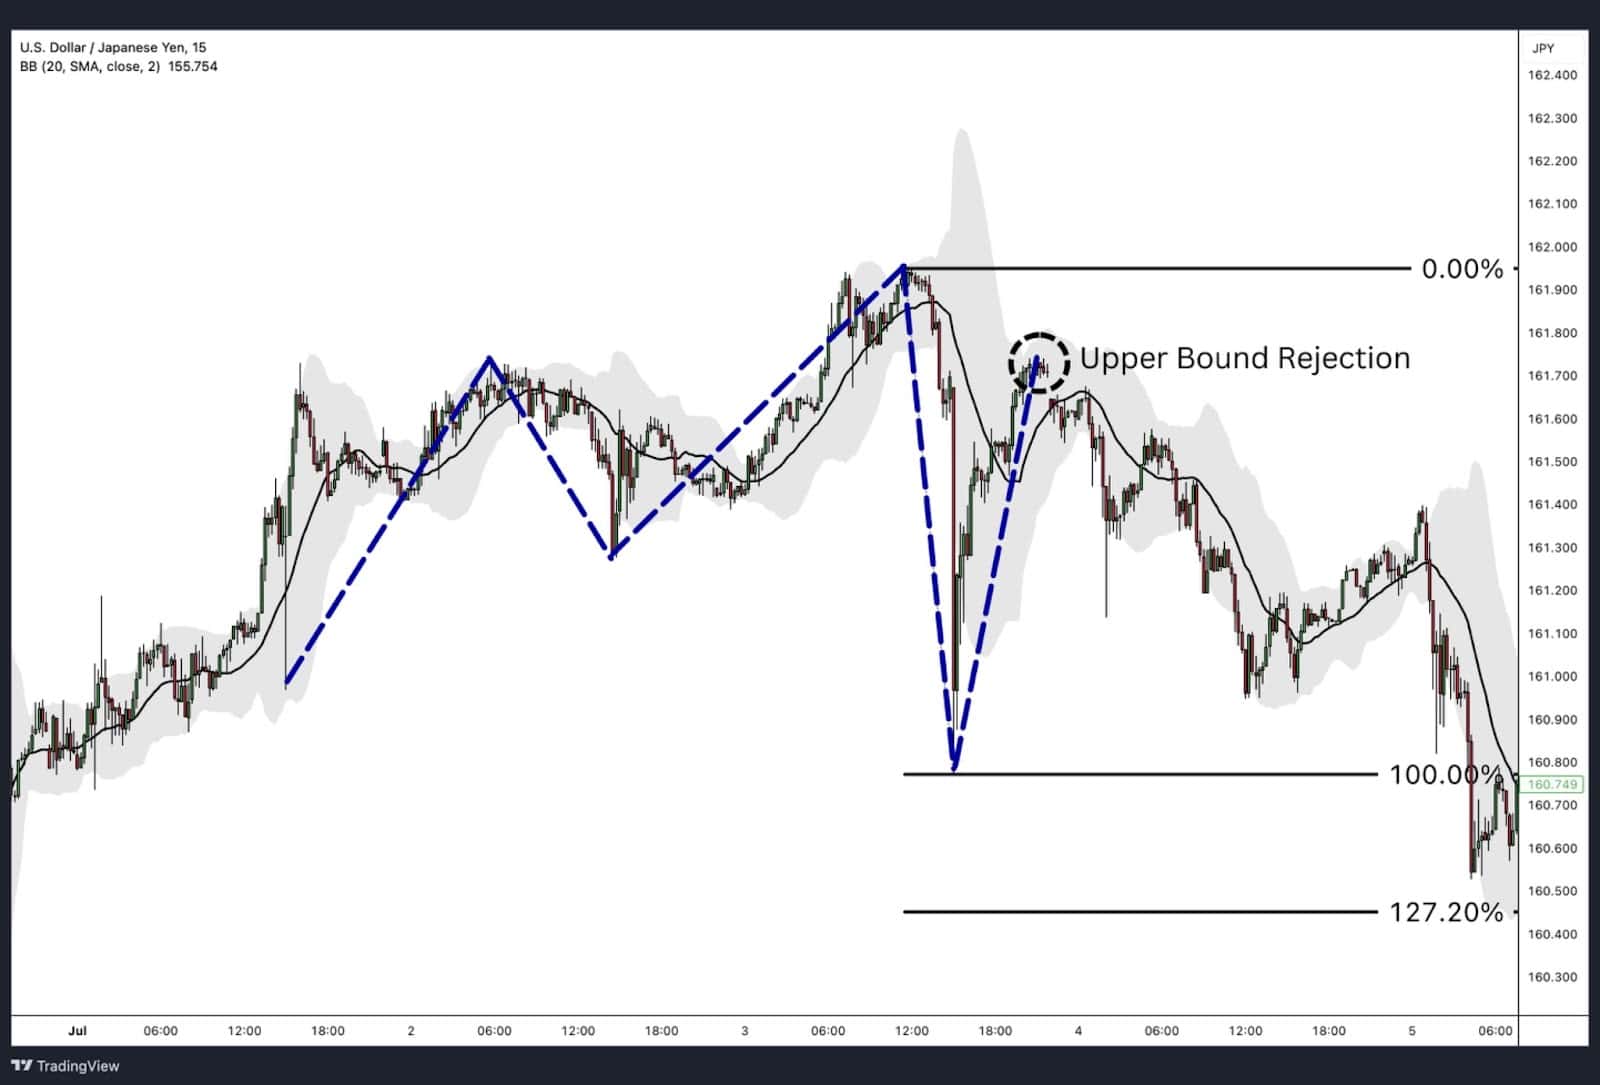
- How It Helps: Bollinger Bands® can highlight overbought or oversold conditions. A retracement to the left shoulder that aligns with the lower (bullish) or upper (bearish) band adds confirmation.
- Entry Tip: Look for price to reject the bands while forming the left shoulder.
Quasimodo Pattern with RSI
- How It Helps: The Relative Strength Index (RSI) helps identify overbought or oversold levels. For a bullish Quasimodo, RSI should ideally be below 30 at the head and rise during the break of structure. For a bearish Quasimodo, RSI should be above 70 at the head and drop during the break of structure.
- Entry Tip: Look for RSI divergence as additional confirmation of the reversal.
Quasimodo Pattern with Divergences
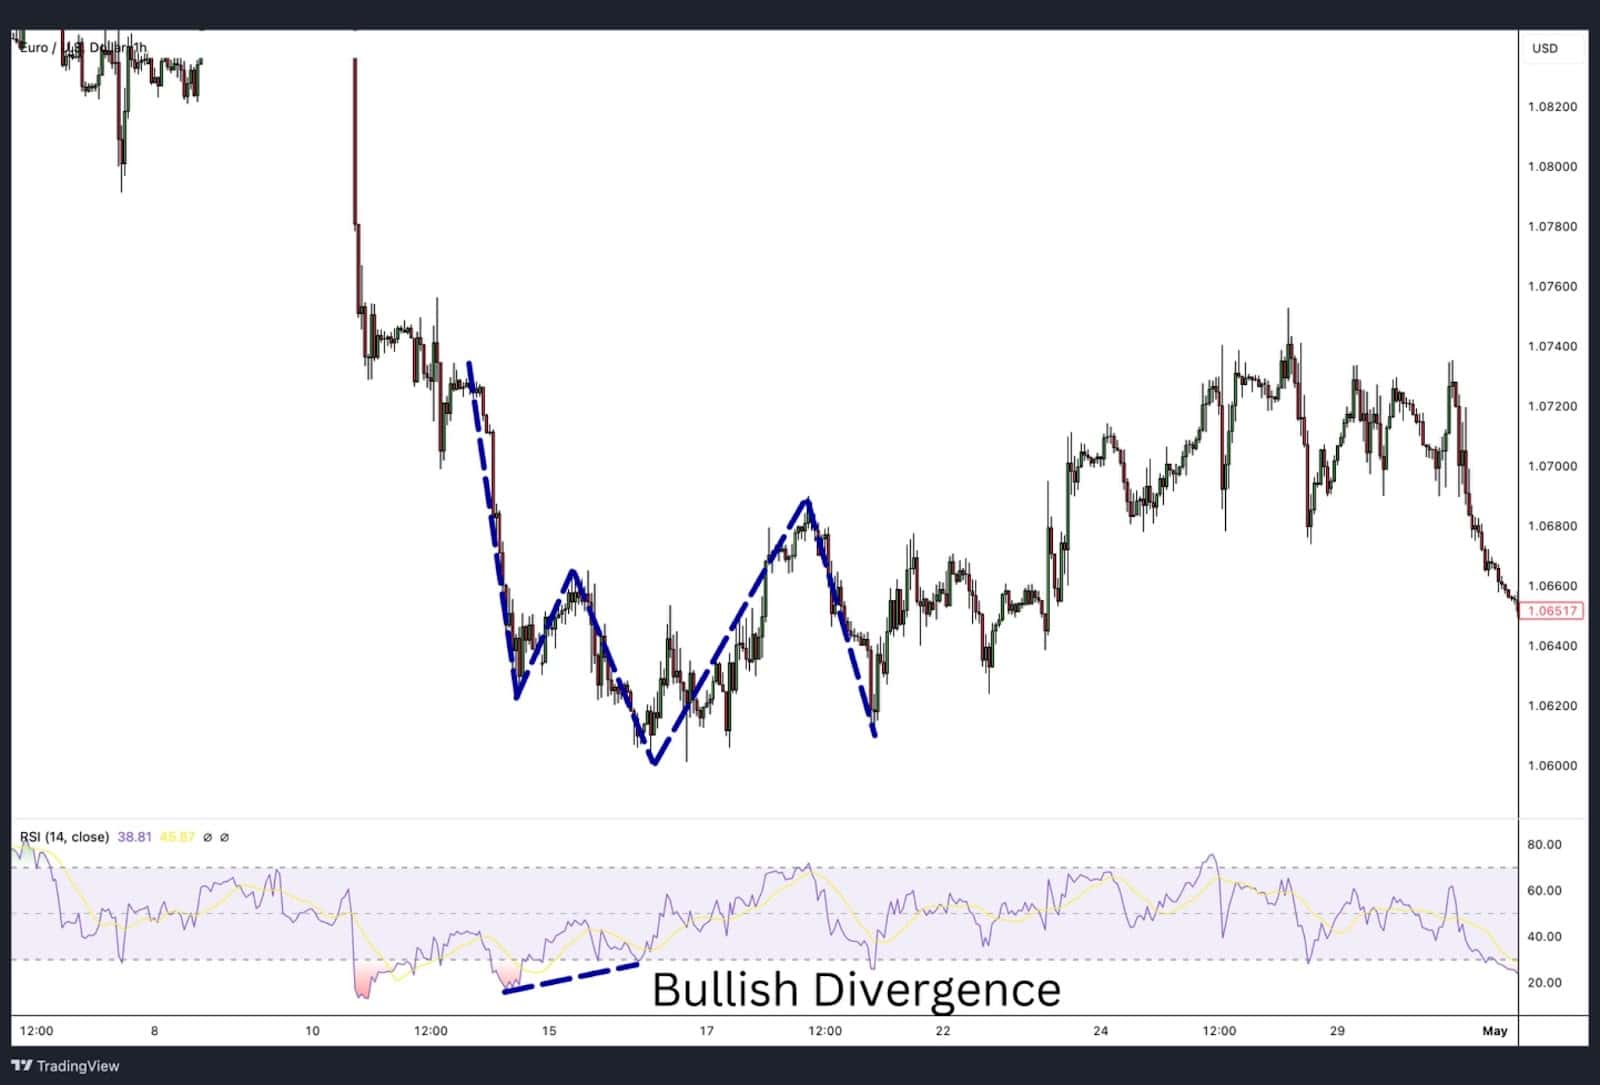
- How It Helps: Divergences between price action and oscillators like MACD or RSI strengthen the pattern’s validity. For example:
- Bullish Divergence: Price forms a lower low (head), but the oscillator shows a higher low.
- Bearish Divergence: Price forms a higher high (head), but the oscillator shows a lower high.
- Entry Tip: Use divergence at the head or left shoulder as a signal to confirm weakening momentum in the current trend.
Advantages of Trading on the Quasimodo Pattern
- High Risk-to-Reward Ratio:
- The Quasimodo pattern offers a favourable risk-to-reward setup by allowing traders to place tight stop losses near the head and target significant price movements with clearly defined profit levels.
- Early Trend Reversal Signals:
- It helps traders spot reversals early in the trend, providing opportunities to capitalise on new momentum before the market fully commits to the new direction.
- Applicability Across Markets:
- The pattern works well across forex, stocks, commodities, and indices, making it versatile for traders in multiple asset classes.
- Defined Entry and Exit Points:
- The structure of the pattern provides clear guidelines for entries (left shoulder), stop loss placement (above or below the head), and take profits (neckline and extensions).
- Combines Well with Indicators:
- When combined with indicators like RSI, MACD, or Bollinger Bands, the Quasimodo pattern becomes even more reliable, increasing the likelihood of successful trades.
Disadvantages of Trading on the Quasimodo Pattern
- Complex Identification:
- The pattern requires precise recognition of the structure (left shoulder, head, and neckline), which can be challenging for inexperienced traders.
- Reliance on Confirmation:
- The Quasimodo pattern depends heavily on confirmation (e.g., impulsive moves and retracements), which may delay entries and reduce profit potential.
- False Signals in Ranging Markets:
- In choppy or consolidating markets, the pattern can generate false signals, leading to potential losses if not carefully validated.
- Patience is Required:
- Waiting for the retracement to the left shoulder and ensuring proper entry can require significant patience, which might cause traders to miss trades if they act impulsively.
- Needs Additional Tools:
- While powerful, the pattern works best when used alongside other technical tools or indicators to confirm trend reversals, increasing the complexity of analysis.
Quasimodo vs Head and Shoulder
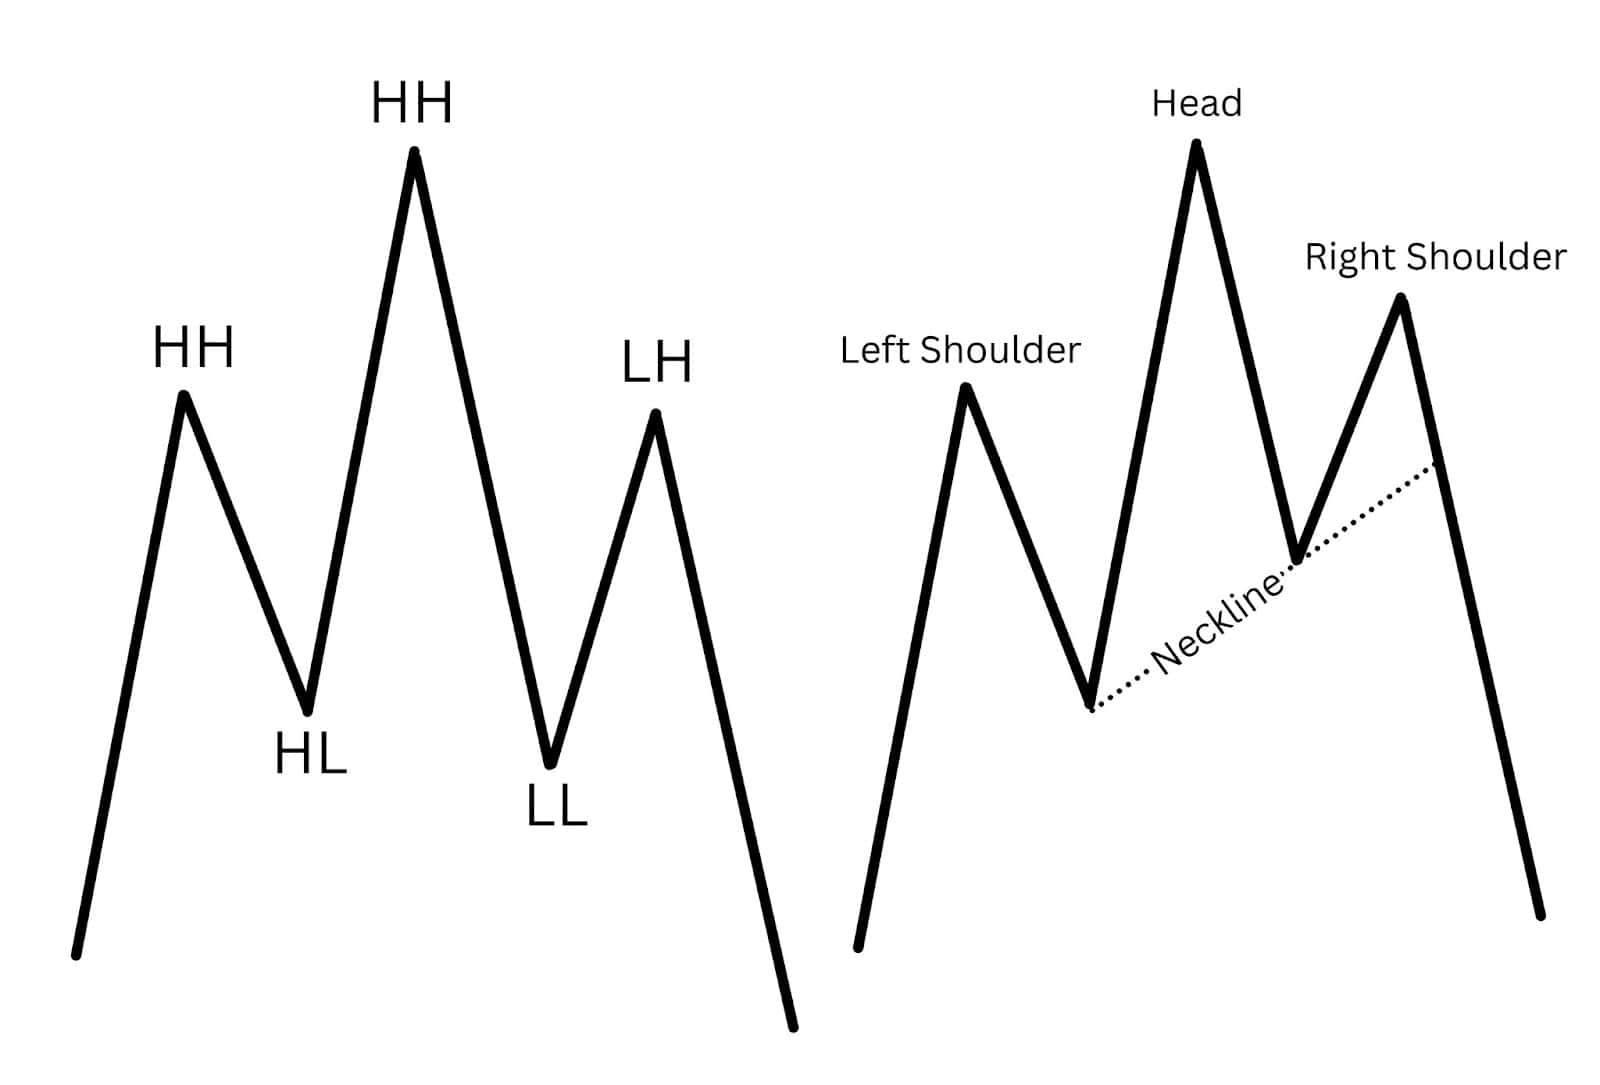
The Quasimodo pattern and the Head and Shoulder pattern (H&S) are both reversal trading patterns, but they differ in structure, entry strategy, and how they confirm trend changes. Here’s a breakdown of their key differences:
1. Neckline Structure and Role
- Quasimodo Pattern:
- The neckline slopes downwards (in bearish setups) as the pattern requires the price to break the previous higher low (for bearish) or lower high (for bullish) by forming a new lower low or higher high.
- This break of structure confirms the new momentum and establishes the retracement to the left shoulder, which serves as a resistance or support level.
- Head and Shoulders Pattern:
- The neckline is typically horizontal or slightly sloped.
- Price doesn’t necessarily need to break the previous structural low (or high) to form the pattern, as it focuses on symmetrical highs and lows.
2. Entry Strategy
- Quasimodo Pattern:
- The Quasimodo pattern allows for early entry at the retracement to the left shoulder level (previous penultimate higher high or lower low).
- This entry assumes that the retracement will respect the resistance (or support) at the left shoulder and reject further movement in the prior trend’s direction, enabling traders to position themselves before the price breaks key levels.
- Head and Shoulders Pattern:
- The H&S pattern requires a break of the neckline to confirm the reversal.
- The entry is delayed, as traders wait for price action to breach the neckline and often retest it before entering.
3. Timing and Risk-Reward
- Quasimodo Pattern:
- Since the entry occurs earlier at the left shoulder level, the Quasimodo pattern often provides a more favourable risk-to-reward ratio. The stop loss is placed just above the head (or below it for bullish setups), and the target aligns with the new trend direction.
- This early entry carries a risk of invalidation if the retracement breaks past the head.
- Head and Shoulders Pattern:
- The delayed entry after the neckline break often reduces the risk of false signals. However, the stop loss tends to be wider, and the reward is slightly lower due to the later entry point.
Summary
- Neckline: Quasimodo requires a sloping neckline and a break of structure, whereas H&S often has a flatter neckline.
- Entry: Quasimodo allows for earlier entries at the left shoulder retracement, while H&S waits for a neckline break.
- Risk-Reward: Quasimodo offers better risk-to-reward potential but demands greater precision, while H&S is more conservative, relying on confirmation.
Bullish Quasimodo vs Inverse Head and Shoulder
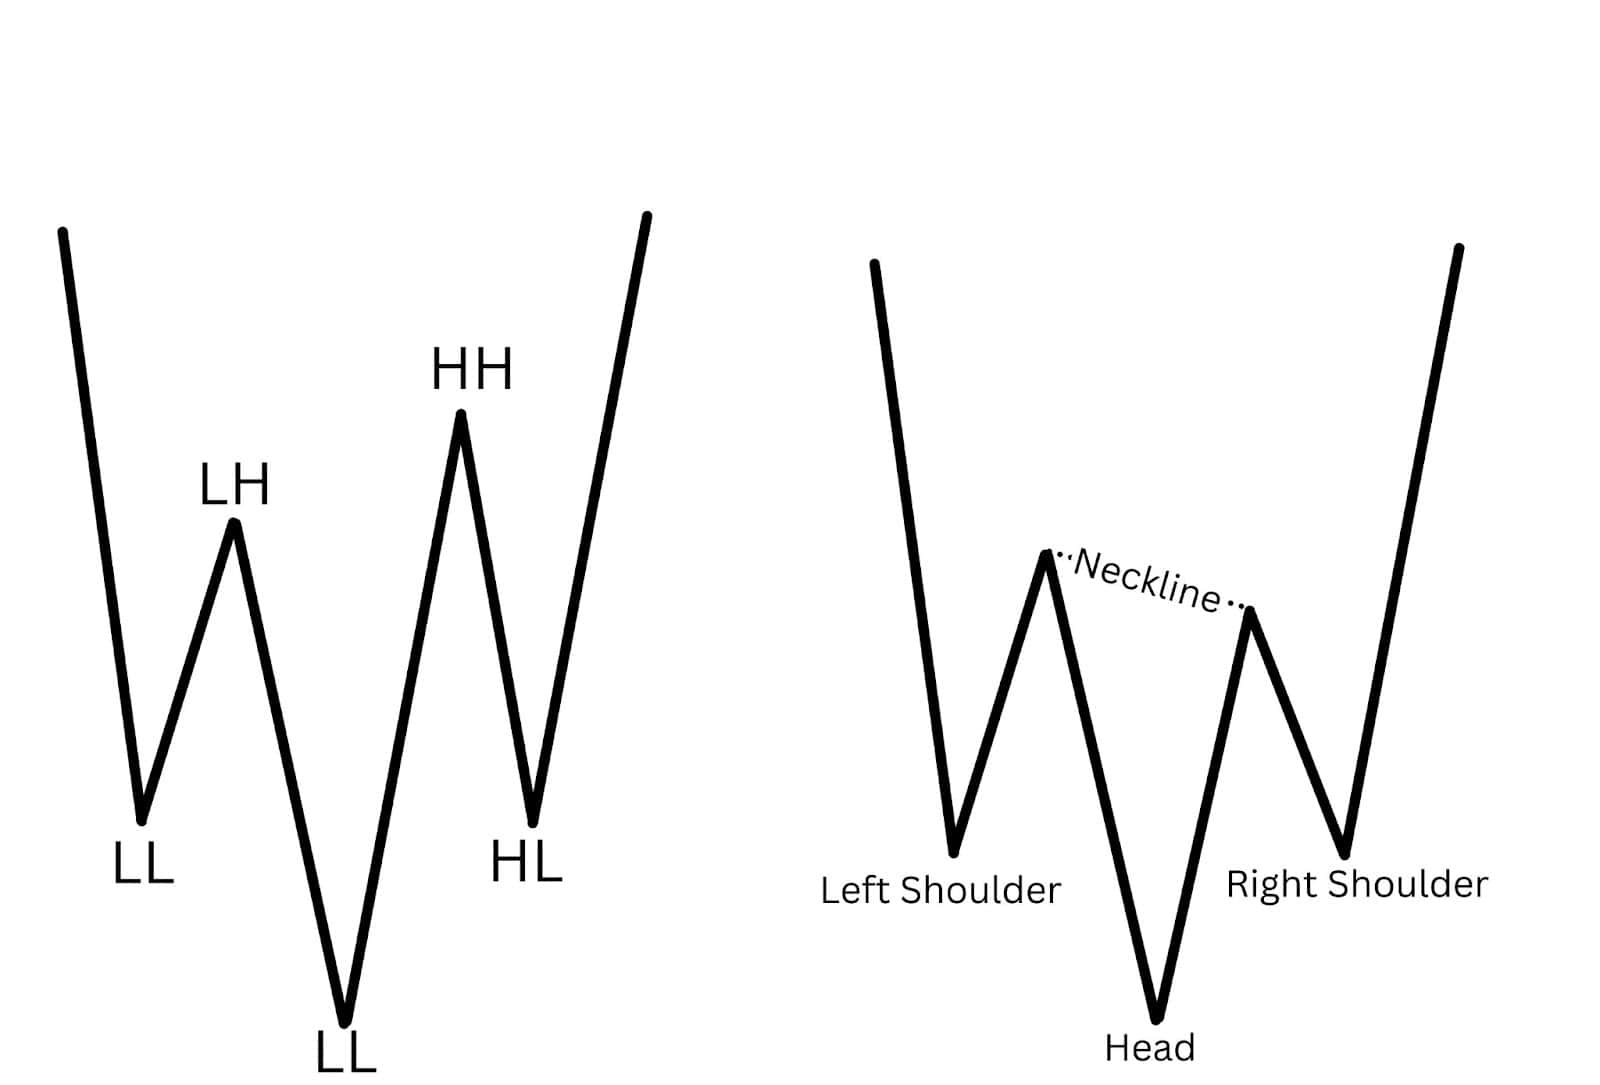
The Bullish Quasimodo pattern and the Inverse Head and Shoulders (IHS) pattern are both reversal setups that indicate a shift from a downtrend to an uptrend. While they share some similarities, they differ significantly in structure, entry approach, and confirmation. Here’s a breakdown of their distinctions:
1. Neckline Structure and Role
- Bullish Quasimodo Pattern:
- The neckline slopes upwards as the pattern requires the price to break the previous lower high by forming a new higher high.
- This break of structure confirms the bullish momentum and establishes a retracement to the left shoulder, which acts as a support level near the previous penultimate lower low.
- Inverse Head and Shoulders Pattern:
- The neckline is typically horizontal or slightly sloped upwards.
- Price does not need to break the previous structural high to form the pattern, as it focuses on creating symmetry in the lows.
2. Entry Strategy
- Bullish Quasimodo Pattern:
- The Quasimodo pattern offers early entry when the right shoulder retraces to the same price as the left shoulder (previous penultimate lower low), assuming that this level will act as support.
- Traders position themselves early, anticipating that the retracement will reject further downside movement and resume the new uptrend.
- Inverse Head and Shoulders Pattern:
- The entry for the IHS pattern requires a break of the neckline, confirming the reversal.
- Many traders also wait for a retest of the neckline for added confirmation before entering, leading to a delayed entry compared to the Quasimodo.
3. Timing and Risk-Reward
- Bullish Quasimodo Pattern:
- With its early entry point at the left shoulder retracement, the Quasimodo pattern often provides a more favourable risk-to-reward ratio. Stop losses are placed just below the head, and profit targets align with the emerging trend direction.
- However, this earlier entry carries a slightly higher risk of invalidation if the retracement breaks below the head.
- Inverse Head and Shoulders Pattern:
- The IHS pattern’s later entry after a neckline break reduces the likelihood of false signals. However, this approach can result in wider stop losses and lower reward potential compared to the Quasimodo.
Summary
- Neckline: Bullish Quasimodo requires an upward-sloping neckline and a break of structure, while the IHS typically has a horizontal or slightly upward-sloping neckline.
- Entry: Bullish Quasimodo offers earlier entries at the left shoulder retracement, while IHS waits for a neckline break.
- Risk-Reward: Quasimodo provides better risk-to-reward potential with earlier entries but requires precise execution, whereas IHS is more conservative, relying on confirmed breakout levels.
Bearish Quasimodo vs Triple Top
Just like the bearish Quasimodo price structure, the Triple Top is a reversal trading pattern. However, the Triple Top differs significantly in their structural dynamics and the signals they provide:
1. Structural Differences
- Triple Top:
- A Triple Top consists of three distinct highs that align horizontally, creating a strong resistance zone. The price tests this resistance level three times but fails to break higher, signalling weakening bullish momentum.
- The lows between the highs typically form a horizontal or near-horizontal neckline, which acts as the final confirmation level when broken.
- Bearish Quasimodo:
- The Quasimodo pattern has an asymmetrical structure with alternating highs and lows. It forms a sequence of higher high (head), lower low, and lower high. These levels are at different heights, creating a sloping neckline and showcasing a break in the trend structure.
2. Key Takeaway
- The Triple Top relies on horizontal symmetry for its resistance zone, while the Bearish Quasimodo signals reversal through a series of highs and lows at varying levels, making it more dynamic and representative of a trend shift.
Bullish Quasimodo vs Triple Bottom
The Bullish Quasimodo pattern and the Triple Bottom are both bullish reversal patterns, but their differences lie in how they form and signal reversals:
1. Structural Differences
- Triple Bottom:
- A Triple Bottom consists of three distinct lows that align horizontally, forming a strong support zone. The price tests this support level three times but fails to break lower, signalling weakening bearish momentum.
- The highs between the lows create a horizontal or near-horizontal neckline, which, when broken, confirms the reversal.
- Bullish Quasimodo:
- The Quasimodo pattern features an asymmetrical structure with alternating highs and lows. It forms a sequence of lower low (head), higher high, and higher low. These levels are at different heights, creating a sloping neckline and reflecting a structural break in the downtrend.
2. Key Takeaway
- The Triple Bottom focuses on horizontal symmetry for its support zone, while the Bullish Quasimodo identifies reversals through alternating highs and lows at varying levels, indicating a dynamic shift in trend momentum.
Quasimodo Pattern in Forex Trading
In the complex world of forex trading, where trends shift dynamically and high volatility, the Quasimodo pattern emerges as a strategic tool for traders seeking precision and foresight. Unlike simpler patterns, the Quasimodo embodies a deeper understanding of market structure, allowing traders to anticipate price reversals and trend continuations with heightened accuracy. Its application extends far beyond basic setups, making it an invaluable technique for those who have mastered the intricacies of price action.
The forex Quasimodo pattern thrives in areas of heightened liquidity—zones where institutional players and retail traders converge. It often appears at critical support and resistance levels, following impulsive breaks that redefine the flow of market sentiment.
In bullish scenarios, the pattern forms at the culmination of selling pressure, reflecting exhaustion in the downtrend and the emergence of new buying momentum. Conversely, the bearish Quasimodo signals waning buying strength and a shift towards dominance by sellers. These characteristics make it particularly effective in major currency pairs like EUR/USD, GBP/USD, and USD/JPY, as well as high-volatility exotic pairs.
At its core, the Quasimodo pattern in forex represents a synthesis of market structure, momentum, and psychology. It is a tool for the advanced trader, capable of bridging the gap between recognising a pattern and fully understanding the market context in which it forms. While novice traders may struggle to identify its nuances, those with experience will find its predictive nature to be invaluable in staying ahead of the market.
FAQ
What are the common quasimodo pattern mistakes to watch out for?
Confusing the Quasimodo with Double or Triple Top/Bottom patterns due to similar appearances. Misidentifying corrective moves as impulsive waves, which are crucial for pattern validity. Failing to confirm that the impulsive move closes above (bullish) or below (bearish) the previous high or low.
What is the best time frame to use for the quasimodo pattern?
Medium- and long-term timeframes (e.g., 1-hour, 4-hour, daily charts) are most reliable, as they better capture strong trends and structure. Short-term timeframes can work but are more prone to noise and false signals.
Who first identified the quasimodo pattern?
The exact origin of the pattern is unclear, but it has been refined and popularised by technical traders over time.
How did the quasimodo pattern get its name?
The pattern is named after the character Quasimodo from “The Hunchback of Notre Dame” due to its asymmetrical structure, resembling a hunchback.
How reliable is the quasimodo pattern?
The Quasimodo pattern is highly reliable when combined with additional confirmation tools, such as indicators or candlestick patterns. However, its success rate depends on proper identification and execution.
How accurate is the quasimodo pattern?
Accuracy varies depending on market conditions. It works best in trending markets but may produce false signals in ranging or low-volatility conditions.
How does the quasimodo pattern indicate a trend reversal?
It signals a reversal through a break of structure (e.g., a new higher high or lower low) followed by a retracement to the left shoulder. This dynamic highlights a shift in momentum.
What markets is the quasimodo trading strategy best suited for?
It is highly versatile and works well in forex, stocks, commodities, and indices, particularly in markets with clear trends and sufficient liquidity.


