- Weekly Outlook
- August 9, 2024
- 6 min read
RBNZ Holds Steady While Bitcoin Struggles to Find It’s Moon Boots
Yesterday’s exaggerated market reaction to the jobless claims figures highlighted the extraordinary sensitivity of investors to any signals about the US macroeconomic outlook. Many had likely viewed the recent equity selloff and the dovish shift in Fed rate expectations as overly pessimistic and were poised to respond to the first sign of positive news to bolster USD rates.
In reality, the jobless claims report was less revealing than the market reaction suggested. Although the drop from 250k to 233k was unexpected, continuing claims actually increased in the week leading to 27th July, from a revised 1,869k to 1,875k, indicating ongoing challenges for those seeking to re-enter the workforce.
Now, as we shift our focus to New Zealand, all eyes will be on the RBNZ’s upcoming interest rate decision and its implications for the economy and the Kiwi dollar.
New Zealand: RBNZ’s Interest Rate Decision
This coming week, all eyes will be on New Zealand as the Reserve Bank of New Zealand (RBNZ) announces its interest rate decision on Wednesday. Amidst global economic uncertainties, the RBNZ’s approach is expected to be cautious. The central bank is likely to keep interest rates steady, a decision driven by the recent data on inflation and economic performance.
Inflation Dynamics and Economic Indicators

One of the key reasons for the RBNZ’s anticipated pause in rate changes is the persistent inflation rate, which has been slower to decrease than the RBNZ originally projected. The non-tradable CPI, which excludes volatile items like food and energy, has shown resilience, indicating that domestic inflationary pressures remain strong. This is a critical factor since it suggests that while overall inflation has moderated slightly, underlying inflationary trends are still robust.
Currently, New Zealand’s inflation stands at 3.3%, which, while lower than previous highs, is still above the RBNZ’s target range. This high inflation, coupled with a slowing economy, presents a complex scenario for the RBNZ. On one hand, raising rates further could stifle economic growth; on the other, cutting rates too soon could reignite inflationary pressures.
Our analysis is that the RBNZ is likely to maintain a wait-and-see stance, holding rates steady this week. However, the door remains open for more significant rate cuts later in the year if inflation begins to decelerate more rapidly. The RBNZ’s careful approach aims to balance the risks of over-tightening with the need to control inflation.
Global Influences on the RBNZ’s Decision
Global factors also play a significant role in the RBNZ’s decision-making process. The Federal Reserve’s monetary policy in the United States, for instance, has a direct impact on global financial markets, including New Zealand. If the Fed continues its hawkish stance, it could influence the RBNZ to delay any immediate rate cuts to avoid putting the New Zealand dollar (NZD) at a competitive disadvantage.
Moreover, the global economic environment remains fragile, with concerns over slowing growth in major economies like China and the Eurozone. These external pressures further complicate the RBNZ’s decision, as the central bank must consider how its actions will affect New Zealand’s export-driven economy.
Impact on the New Zealand Dollar (NZD)
The decision to hold interest rates is expected to provide short-term support to the NZD. With the global economy in flux and the U.S. Federal Reserve maintaining a strong stance, the RBNZ’s cautious approach might make the NZD more attractive to investors seeking stability.
In the longer term, however, if the RBNZ signals potential rate cuts later in the year, the NZD could face downward pressure. Much will depend on how inflation evolves in the coming months and whether the RBNZ feels confident enough to begin loosening monetary policy.
NZD/USD Chart Analysis

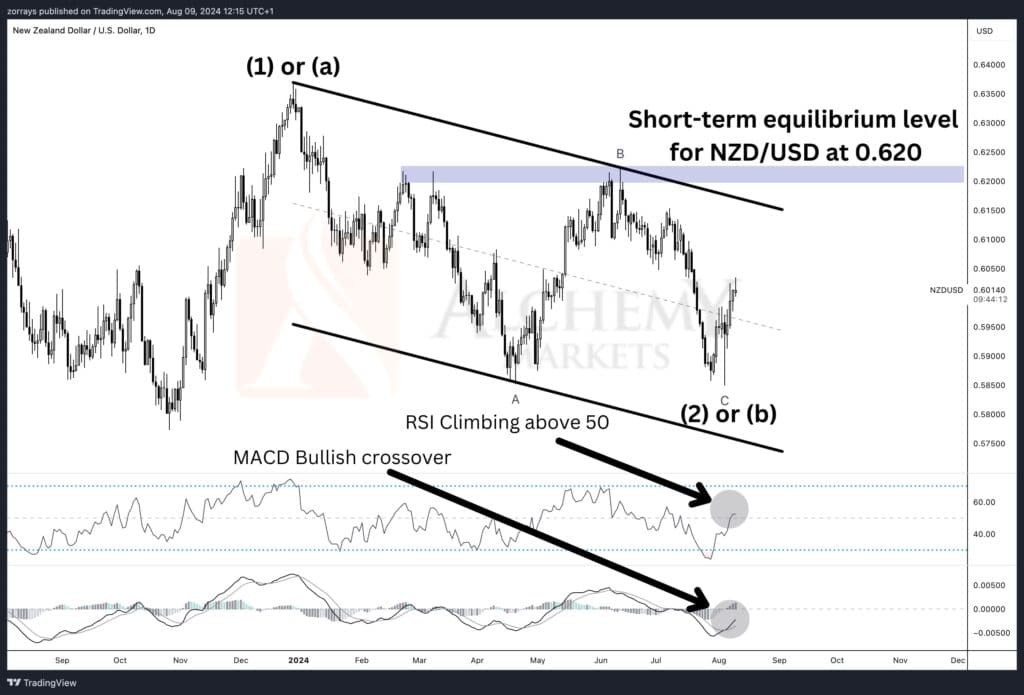
Prolonged Downtrend: The NZD/USD pair has been in a downtrend, as marked by the decline from point (1) or (a).
Stabilisation Signs: The pair appears to be stabilising after this decline.
RSI Indicator: The RSI has climbed above the 50 level, signalling that bearish momentum is waning.
Bullish Signal: A move above the 50 level on the RSI suggests a potential short-term recovery for NZD/USD.
MACD Indicator: The MACD shows a bullish crossover, reinforcing the possibility of a rebound.
Technical Alignment: The convergence of RSI and MACD with the RBNZ’s likely decision to hold rates could temporarily strengthen the NZD.
Short-term Equilibrium Level: The chart highlights a critical short-term equilibrium level at 0.6200, which aligns with previous support and resistance points.
Potential Recovery: Sustaining a move above 0.6200 could signal a more extended recovery.
Risk of Consolidation: Failure to breach the 0.6200 resistance could lead to further consolidation or a continuation of the downtrend.
Corrective Phase Bottom: The recent low near point (2) or (b) might represent the bottom of the current corrective phase.
Positive Outlook: The combination of fundamental and technical factors points to a cautiously optimistic outlook for the NZD/USD in the near term, with the RBNZ’s decision playing a crucial role.
Additional Technical Analysis
BTC/USD

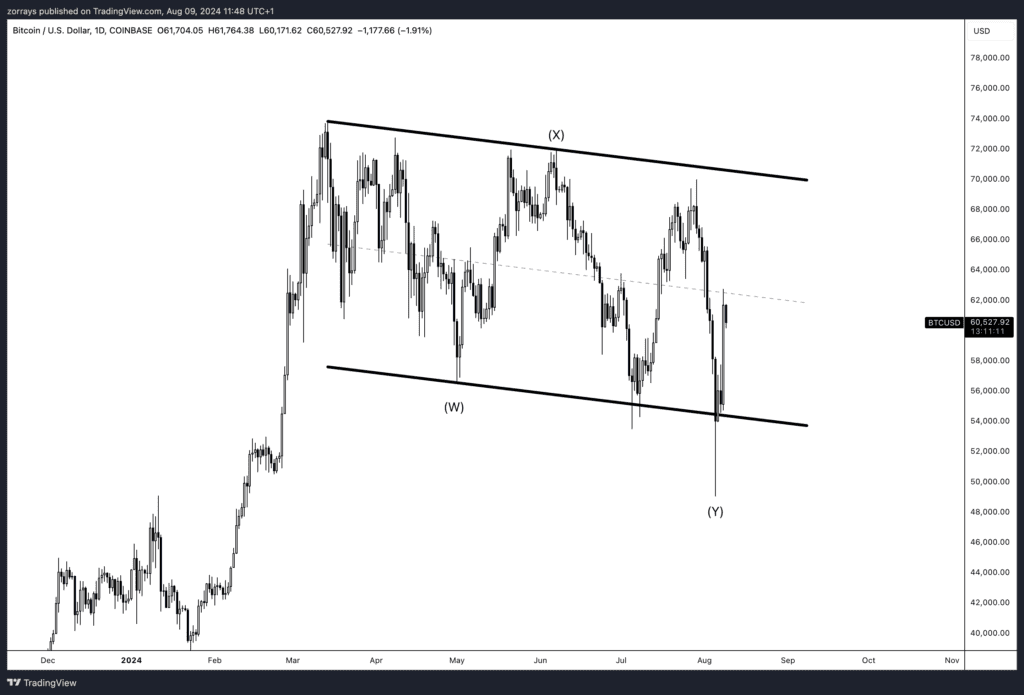
The attached BTC/USD daily chart reveals a broader consolidation pattern that has been in play for most of 2024. Bitcoin appears to be trading within a descending channel, with clearly defined upper and lower boundaries labelled as points (X) and (W) respectively.
- Descending Channel Formation: Bitcoin has been moving within a descending channel, with the upper boundary (X) acting as resistance and the lower boundary (W) providing support. This structure has contained price movements, leading to a series of lower highs and lower lows.
- Recent Price Action: The latest price action shows Bitcoin testing the lower boundary of this channel near point (Y), where it has seen a sharp bounce. This indicates that the support line remains significant, as Bitcoin briefly dipped below it before recovering, suggesting that this level is being respected by the market.
- Potential Rebound: The rebound from point (Y) could indicate a temporary relief rally, especially if Bitcoin continues to move towards the middle or upper part of the channel. However, this potential recovery is within the context of a larger downtrend, so caution is warranted.
- Critical Resistance and Support: The resistance level at point (X) remains a crucial barrier. If Bitcoin can break above this level, it might signal the end of the current downtrend and a possible reversal. On the flip side, a failure to maintain above point (W) could lead to further declines, with the lower boundary acting as a critical support level.
- Market Sentiment: The overall market sentiment, combined with Bitcoin’s behaviour within this descending channel, suggests a cautious outlook. The boundaries of the channel provide clear levels to watch for potential breakouts or breakdowns. Traders should monitor these levels closely as they could signal the next significant move in Bitcoin’s price.
- Outlook: While the bounce from point (Y) is encouraging, the larger descending channel suggests that Bitcoin remains in a corrective phase. A sustained move above the resistance at point (X) would be necessary to shift the outlook to bullish. Until then, the prevailing trend within this channel suggests that any rallies may be short-lived unless accompanied by a broader shift in market sentiment.
This technical analysis, combined with broader market factors, will help traders and investors navigate the potential movements in Bitcoin in the upcoming weeks.


