
- Opening Bell
- August 6, 2024
- 3 min read
DXY Bearish, S&P 500 and Bitcoin Facing Trouble
After our forecast approximately 2 weeks ago, the Dollar Index has indeed formed a 3-legged move down – breaking the parallel channel and falling to the previous low (illustrated in purple).
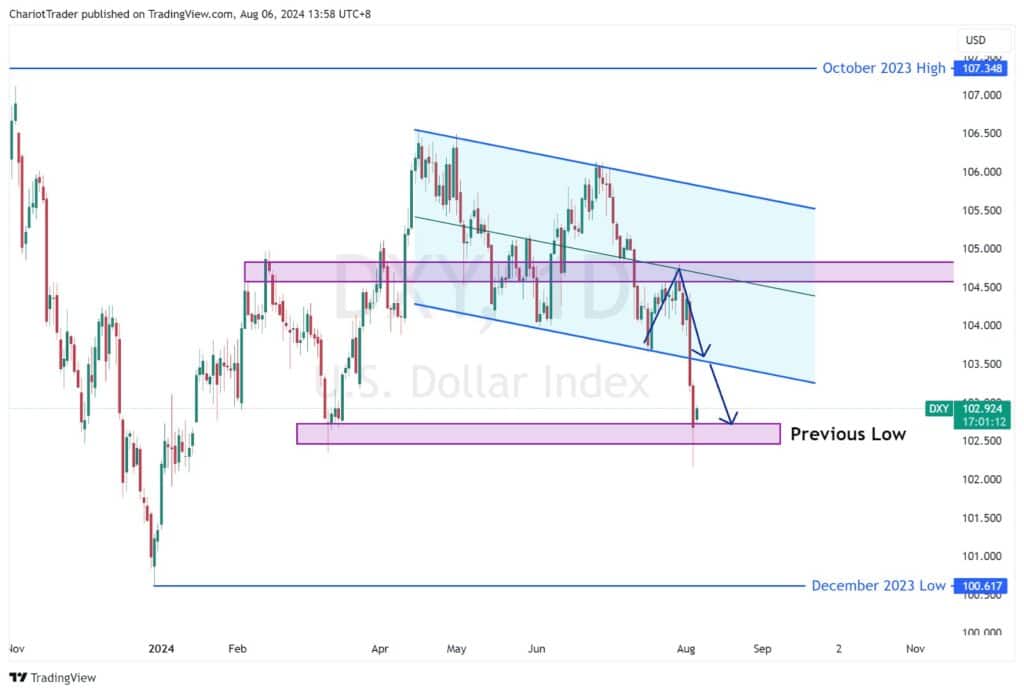
This purple zone is significant as it also coincides with the 0.618 Fibonacci retracement level, drawn from the lows from July 2023, to the October 2023 High.
The question now then becomes, which way is the DXY going to go from here?
Technical Analysis on the DXY
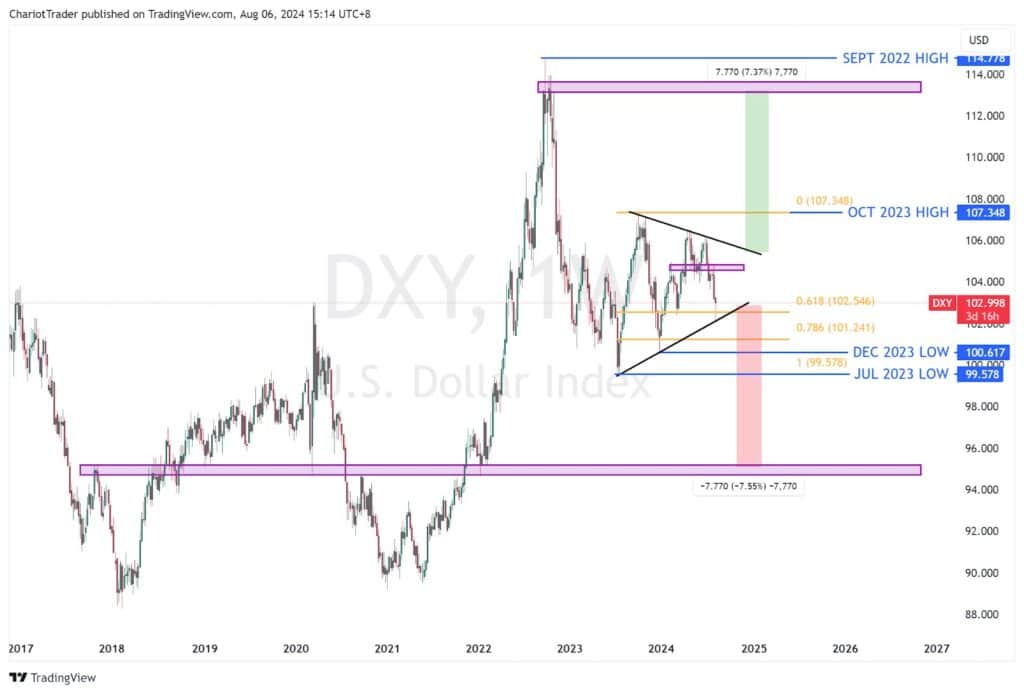
DXY is currently consolidating within a symmetrical triangle after a strong bearish impulse in 2022. This gives the Symmetrical Triangle Pattern a slight bearish edge.
DXY is currently bouncing from a significant support area at 102.000, which has three confluences: the previous low, the 618 retracement level, and support trendline of the triangle.
If this level can hold, we may see a move up to retest these areas:
| The neckline of the double top pattern from 104.569 to 104.824. |
| The upper trendline of the symmetrical triangle pattern at approximately 105.500. |
| Measured Move Target takes the price to around 113.000 – 114.000, around the 2022 highs. |
If this level breaks, we may see a move down to retest these areas:
| Major Psychological Level at 100.000, which coincides with the lows from July and December 2023. |
| Measured Move Target takes the price to around 95.000, which coincides with a significant low that can act as a support zone. |
Which is more likely, further drop or further rise?
The potential for interest rate cuts by the Federal Reserve, recent unfavourable unemployment data, and the Bank of Japan’s rate hike all contribute to the bearish outlook. These factors are crucial in determining the dollar’s future movement, and upcoming economic data will be critical.
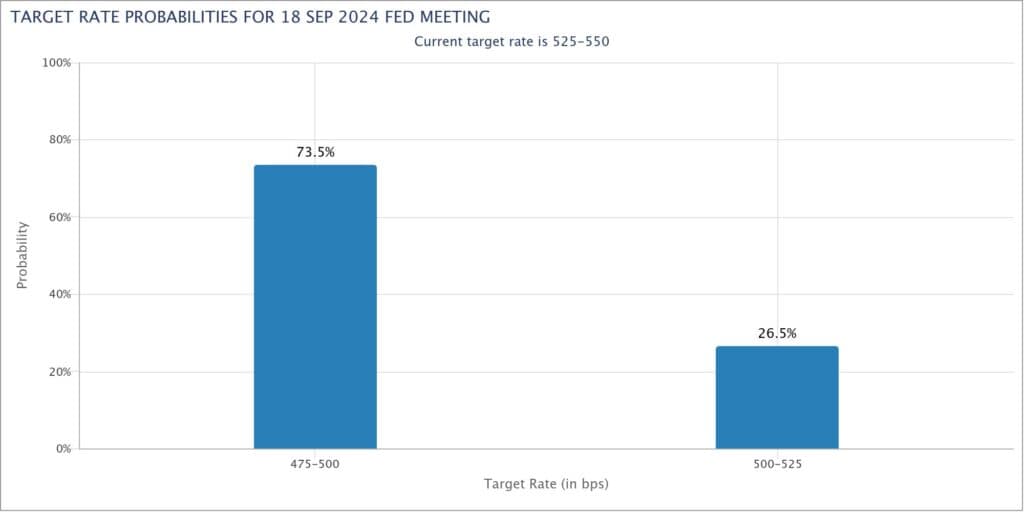
Source: CME Group Fedwatch Tool
If upcoming economic data is unfavourable, the Federal Reserve could regain a hawkish tone in the upcoming meeting – which will strengthen the dollar and inject bearish pressure into the general markets.
The Dollar is Dropping, Will S&P 500 and Bitcoin Make a Recovery?
S&P 500
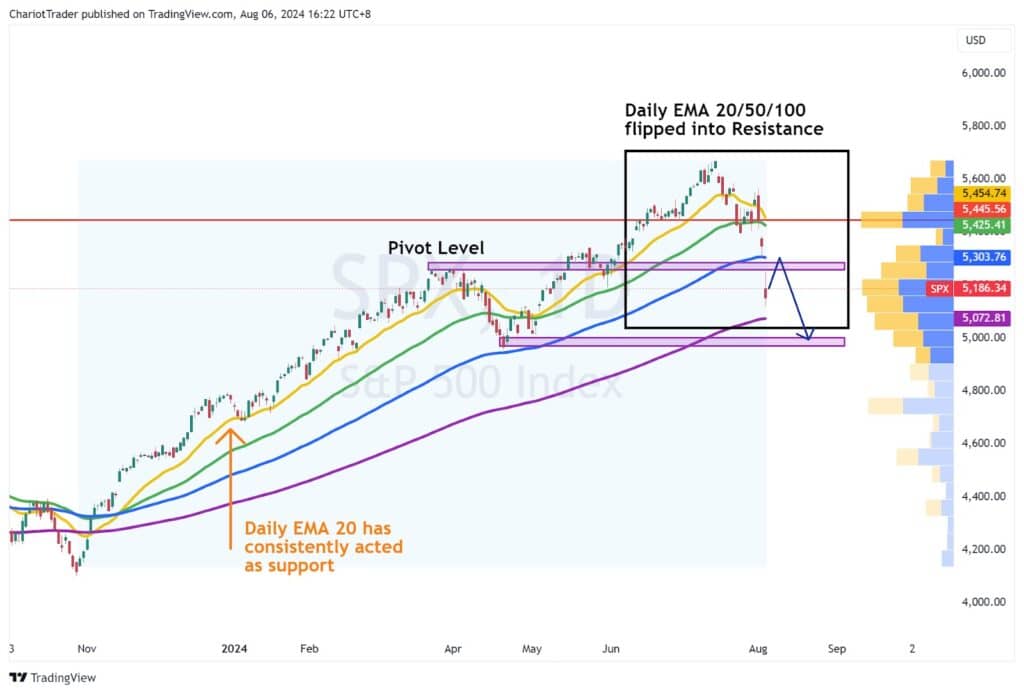
Bearish Short-Term, Bullish Long Term: The S&P 500 is facing significant resistance at previous highs and daily EMAs, indicating short-term bearishness. Key levels to watch are around $5,250-$5,280 (pivot), $5,303.76 (EMA 100), and $5,425.41 (EMA 50)
Watch these areas for a bearish rejection, or a bullish breakout:
| Pivot Level | Approximately $5,250 – $5,280 |
| Daily EMA 100 | Approximately $5,303.76 |
| Daily EMA 50 | Approximately $5,425.41 |
| Point of Control (Since the rise from Nov 2023) | $5,445.56 |
If these areas can be reclaimed, then S&P 500’s long term uptrend may resume.
Bitcoin
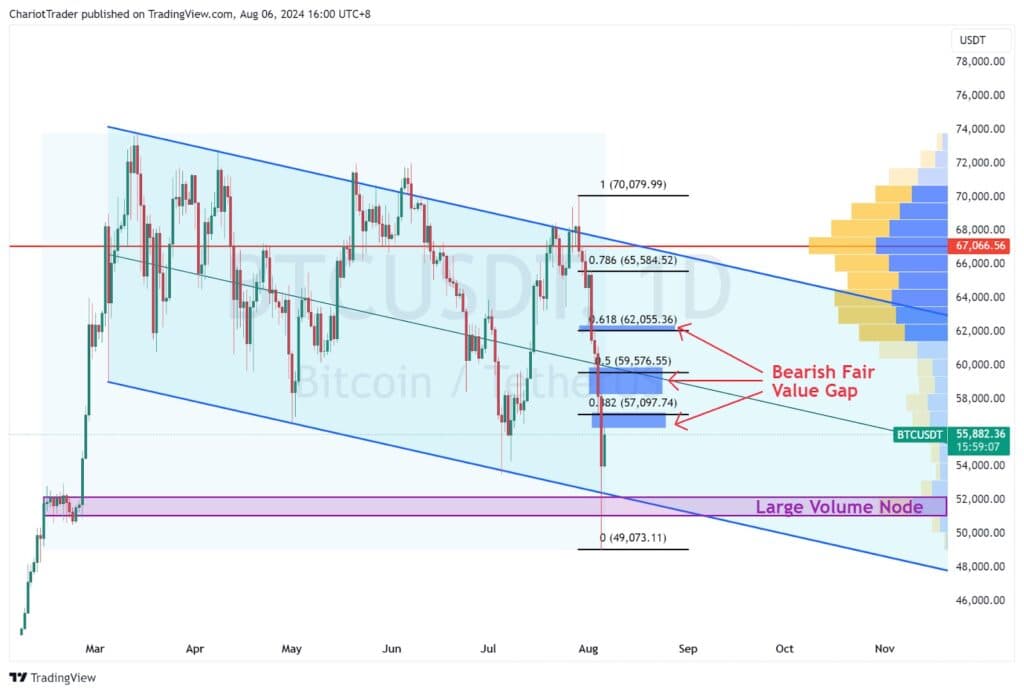
Bearish Short-Term, Bullish Long-Term: Bitcoin has a short-term bearish bias due to multiple bearish fair value gaps coinciding with Fibonacci levels. However, in the long term, it is still strong, having bounced off significant support around $51,000-$52,000
Watch these areas for a bearish rejection, or a bullish breakout:
| Bearish Fair Value Gap 1,Fibonacci Level 0.382 | $56271.40 – $57207.18, Fib: $57,097.74 |
| Bearish Fair Value Gap 2,Fibonacci Level 0.5 | $58295.95 – $59911.12, Fib: $57,097.74 |
| Bearish Fair Value Gap 3,Fibonacci Level 0.618 | $62046.58 – $62395.48, Fib: $62,055.36 |
If these areas can be reclaimed, then Bitcoin’s long term uptrend may resume.
You may also be interested in:
USDJPY: Nikkei Crash and US Unemployment Causes Panic
RBA: Will They or Won’t They and SPX in Trouble


