On August 2, 2024, the Nikkei 225 index fell sharply by 5.81%, marking its second-worst drop since the crash of 1987. This decline, driven by fears of a global recession and weak US unemployment data, brought the index to its lowest level in six months.
The impact was felt globally, with the S&P 500 falling 4.80%, the Nasdaq 100 dropping 6.40%, and Bitcoin plummeting 24% since Friday.
The Timeline – Why was it so volatile last week?
Federal Reserve Chair Powell gave a dovish statement on July 31st, causing the S&P 500 to rise by 1.58%, its best performance since February. The following day, fears of a global recession surged as the Dow Jones closed 500 points lower.
These fears intensified on August 2nd with the U.S. unemployment rate rising to 4.3% in July from 4.1% in June. Adding to the turmoil, the Nikkei dropped 5.81% on the same day, its worst decline since 1987, raising concerns that the Bank of Japan might hike rates, affecting the profitability of carry trades.
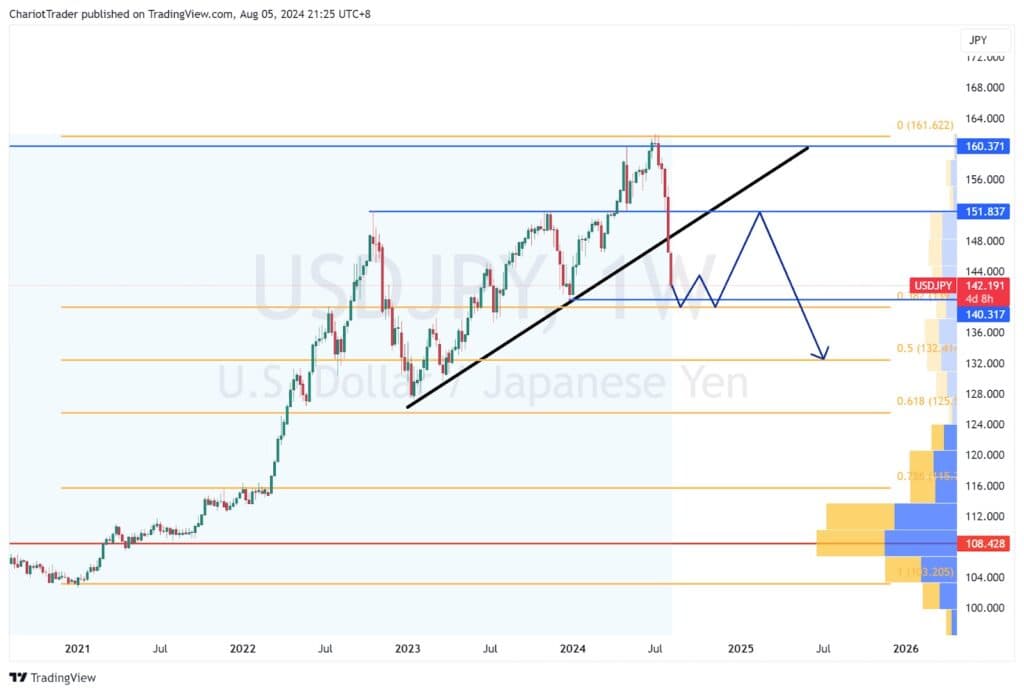
Technical Analysis on USDJPY

USDJPY has pierced through a rising trendline formed since late 2023, extending into July 2024. This marks a significant shift in trend direction, and the possibility of an ABC correction taking place in the upcoming days and weeks.
A possible scenario to look for would be a double bottom consolidation at around the 0.382 Fibonacci retracement level of 139.300, or the Previous Low at 140.317.
The previous high at approximately 151.837 should serve as a significant resistance for USDJPY, possibly acting as the start of the C wave down lower.
You may also be interested in:
RBA: Will They, Won’t They, SPX (US500) in Trouble
Rate Cuts Showdown: Fed and BOE


